Publisher’s version / Version de l'éditeur:
Applied and environmental microbiology, 76, 17, pp. 5773-5784, 2010
READ THESE TERMS AND CONDITIONS CAREFULLY BEFORE USING THIS WEBSITE. https://nrc-publications.canada.ca/eng/copyright
Vous avez des questions? Nous pouvons vous aider. Pour communiquer directement avec un auteur, consultez la première page de la revue dans laquelle son article a été publié afin de trouver ses coordonnées. Si vous n’arrivez pas à les repérer, communiquez avec nous à PublicationsArchive-ArchivesPublications@nrc-cnrc.gc.ca.
Questions? Contact the NRC Publications Archive team at
PublicationsArchive-ArchivesPublications@nrc-cnrc.gc.ca. If you wish to email the authors directly, please see the first page of the publication for their contact information.
NRC Publications Archive
Archives des publications du CNRC
This publication could be one of several versions: author’s original, accepted manuscript or the publisher’s version. / La version de cette publication peut être l’une des suivantes : la version prépublication de l’auteur, la version acceptée du manuscrit ou la version de l’éditeur.
For the publisher’s version, please access the DOI link below./ Pour consulter la version de l’éditeur, utilisez le lien DOI ci-dessous.
https://doi.org/10.1128/AEM.03094-09
Access and use of this website and the material on it are subject to the Terms and Conditions set forth at
Stable isotope probing analysis of the diversity and activity of
methanotrophic bacteria in soils from the Canadian High Arctic
Martineau, Christine; Whyte, Lyle G.; Greer, Charles W.
https://publications-cnrc.canada.ca/fra/droits
L’accès à ce site Web et l’utilisation de son contenu sont assujettis aux conditions présentées dans le site
LISEZ CES CONDITIONS ATTENTIVEMENT AVANT D’UTILISER CE SITE WEB.
NRC Publications Record / Notice d'Archives des publications de CNRC:
https://nrc-publications.canada.ca/eng/view/object/?id=29ef9d68-ed99-41e9-b5c8-fca2fda47be3
https://publications-cnrc.canada.ca/fra/voir/objet/?id=29ef9d68-ed99-41e9-b5c8-fca2fda47be3
0099-2240/10/$12.00 doi:10.1128/AEM.03094-09
Copyright © 2010, American Society for Microbiology. All Rights Reserved.
Stable Isotope Probing Analysis of the Diversity and Activity of
Methanotrophic Bacteria in Soils from the
Canadian High Arctic
䌤
Christine Martineau,
1,2Lyle G. Whyte,
2and Charles W. Greer
1*
National Research Council Canada, Biotechnology Research Institute, Montre´al, QC, Canada,1and Department of
Natural Resource Sciences, McGill University, Ste. Anne de Bellevue, QC, Canada2 Received 22 December 2009/Accepted 29 June 2010
The melting of permafrost and its potential impact on CH4emissions are major concerns in the context of global warming. Methanotrophic bacteria have the capacity to mitigate CH4emissions from melting perma-frost. Here, we used quantitative PCR (qPCR), stable isotope probing (SIP) of DNA, denaturing gradient gel electrophoresis (DGGE) fingerprinting, and sequencing of the 16S rRNA and pmoA genes to study the activity and diversity of methanotrophic bacteria in active-layer soils from Ellesmere Island in the Canadian high Arctic. Results showed that most of the soils had the capacity to oxidize CH4at 4°C and at room temperature (RT), but the oxidation rates were greater at RT than at 4°C and were significantly enhanced by nutrient amendment. The DGGE banding patterns associated with active methanotrophic bacterial populations were also different depending on the temperature of incubation and the addition of nutrients. Sequencing of the 16S rRNA and pmoA genes indicated a low diversity of the active methanotrophic bacteria, with all methanotroph 16S rRNA and pmoA gene sequences being related to type I methanotrophs from Methylobacter and
Methylo-sarcina. The dominance of type I methanotrophs over type II methanotrophs in the native soil samples was confirmed by qPCR of the 16S rRNA gene with primers specific for these two groups of bacteria. The 16S rRNA and pmoA gene sequences related to those of Methylobacter tundripaludum were found in all soils, regardless of the incubation conditions, and they might therefore play a role in CH4 degradation in situ. This work is providing new information supporting the potential importance of Methylobacter spp. in Arctic soils found in previous studies and contributes to the limited body of knowledge on methanotrophic activity and diversity in this extreme environment.
Permafrost regions occupy approximately 22% of the ex-posed land area of the Northern Hemisphere (63). In the past 100 years, the average temperatures in the arctic regions have increased at almost twice the average global rate (25). The melting of permafrost is one of the most important impacts of global warming on these high-latitude environments, and the-oretical modeling suggests that as much as 90% of the perma-frost could thaw by the end of the 21st century (29). While it has been generally reported that 15% of the total soil organic carbon is stocked in permafrost (42), a recent estimate indicates that it contains as much as 50% of the global below-ground organic carbon pool (53). Carbon stocked in perma-frost is now regarded as one of the most important carbon-climate feedbacks because of the size of the carbon pool and the intensity of climate change at high latitudes (46, 47). The presence of these large amounts of carbon in permafrost is raising serious concerns whether melting permafrost, and the resulting increase in microbial activity, might be a source of extensive emissions of the greenhouse gases carbon dioxide and methane (CH4) to the atmosphere. The actual emissions of CH4 from soils of high latitudes have been estimated to represent about 25% of the emissions from natural sources
(19). Methane, which is 25 times more potent than carbon dioxide as a greenhouse gas (25), is produced by methanogenic archaea under anaerobic conditions. These microorganisms are known to inhabit permafrost environments (44, 49), and their capacity to produce methane at cold temperatures has been reported (20, 35, 44, 56). Their methanogenic activity is expected to increase as permafrost soil temperature increases (20). Moreover, large amounts of methane are stocked as methane hydrates in permafrost at an average depth of several hundred meters (33). Methane is also found in permafrost layers near the surface and could potentially be liberated to the atmosphere as permafrost melts (44).
Methane can be oxidized in aerobic zones by aerobic anotrophic bacteria or in anaerobic zones by anaerobic meth-anotrophic archaea (for a recent review, see reference 27). Anaerobic methane oxidizers were not covered in the context of this study, which focused exclusively on aerobic meth-anotrophs. These bacteria utilize methane as the sole carbon and energy source through the activity of the enzyme methane monooxygenase (MMO). Most known aerobic methanotrophs are divided into two major groups (type I and type II) based on phylogeny and carbon assimilation pathways (5). Type I methanotrophs, also known as Gammaproteobacteria meth-anotrophs (6) belong to the family Methylococcaceae within the Gammaproteobacteria subdivision, while type II meth-anotrophs (Alphaproteobacteria methmeth-anotrophs) belong to the family Methylocystaceae in the Alphaproteobacteria subdivision (5). Because of their capacity to oxidize methane, aerobic
* Corresponding author. Mailing address: National Research Coun-cil Canada, Biotechnology Research Institute, 6100 Royalmount Ave., Montre´al, QC H4P 2R2, Canada. Phone: (514) 496-6182. Fax: (514) 496-6265. E-mail: Charles.Greer@cnrc-nrc.gc.ca.
䌤Published ahead of print on 9 July 2010.
5773
methanotrophs can significantly reduce methane emissions to the atmosphere and play an important role in the global meth-ane cycle (12, 22). Methanotrophic activity has been observed in cold environments, and methanotrophs might contribute to the reduction of methane emissions from melting permafrost. Aerobic methanotrophic bacteria from cold environments have been reviewed in detail elsewhere (54).
Most studies addressing methanotrophs from cold environ-ments were conducted on soils from very few sites located in Northern Europe and Siberia (14, 30, 31, 40, 56–58), while methanotrophic bacterial populations in soils from the Cana-dian high Arctic remain mostly unexplored (41). In addition, most of these studies were conducted at low latitudes, and the pool of knowledge concerning the activity and diversity of methanotrophic bacterial populations in high Arctic soils is limited. The question being addressed in this study is whether there are active methanotrophs in the active-layer soil in the high Arctic. Therefore, the present work had two objectives: (i) to evaluate the methane oxidation capacity of three active-layer soils from the Canadian high Arctic under various incu-bation conditions and (ii) to identify and characterize the di-versity of the active methanotrophs in these soils using stable isotope probing (SIP) of DNA (DNA-SIP) and sequencing of the 16S rRNA and pmoA genes. With this work, we identify for the first time active methanotrophs in high Arctic soils through the use of DNA-SIP.
MATERIALS AND METHODS
Site description, soil sampling, and soil characterization.The three soil sam-ples (32D, 33D, and 34D) used in this study were collected around a water retention pond located in Eureka, Ellesmere Island, Nunavut, Canada (80°0.029 N, 85°50.367 W). A fuel spill had occurred close to this site in 1990, and these soils had been collected in 2006 to monitor hydrocarbon contamination. Two of these samples (34D in 2006 and 33D in 2007) had low, but detectable concen-trations of petroleum hydrocarbons (see “Soil characteristics” in Results for more details). Composite samples from the active layer of soil just below the surface (top 10 cm) were aseptically collected in July 2006 and 2007 and were kept frozen at ⫺20°C until use. Soil analyses (pH, Mehlich-III, total nitrogen, nitrate, and cationic exchange capacity [CEC]) were performed by Agridirect Inc. (Longueuil, Que´bec, Canada) according to their standard operating meth-ods (http://www.agridirect.ca/systeme/nosmethodes.asp#sol). Organic matter content was determined by combustion for 16 h at 375°C, and the water content was determined at 105°C using a moisture analyzer (MA 30; Sartorius, Missis-sauga, Ontario, Canada). Total petroleum hydrocarbon concentrations were measured using the technique described by the Centre d’Expertise en Analyze Environnementale du Que´bec (10).
Soil incubation and methane degradation.Twenty grams of soil (wet weight) was mixed into a slurry with 20 ml of nitrate mineral salts (NMS) medium (60)
(NMS treatment) or added directly into 120-ml glass serum vials (no NMS treatment). NMS medium is a growth medium used for the enrichment and isolation of methanotrophic bacteria and was added to stimulate methane deg-radation by the soils, which were expected to have low methane oxidation rates. The vials were crimp sealed with a butyl rubber stopper and 1 ml of13CH4 (Sigma-Aldrich, Oakville, Ontario, Canada) was injected into the headspace of each microcosm. The samples were incubated at 4°C or at room temperature (RT) on a rotary shaker at 160 rpm in the case of the NMS treatment. Triplicate microcosms were prepared for each treatment, and autoclaved samples were used as negative controls for methane degradation. For each soil treatment, a fourth series of microcosms in which13CH4was replaced by12CH4was prepared and used as a negative control for DNA-SIP. Headspace methane concentration was monitored by gas chromatography by the method of Roy and Greer (45). Methane concentration was determined using a standard curve of serial dilutions of 99% pure methane in nitrogen. Soil methane oxidation rates were calculated from the initial linear decrease in CH4concentration over time. When more than 90% of the CH4had been consumed, the microcosms were flushed with sterile air to avoid the accumulation of CO2and either 1 ml (no NMS treatment) or 5 ml (NMS treatment) of13CH4or12CH4was added to the headspace. When the degradation of more than 90% of the methane was completed, the samples were frozen at ⫺20°C.
DNA extraction, fractionation, and quantification.DNA was extracted from 10 g of the native soil samples and from one of the triplicate microcosms for each incubation treatment following the protocol of Fortin et al. (18). DNA crude extracts from the native soil samples were purified using polyvinylpolypyrroli-done (PVPP)/Sephacryl spin columns (26) and used for PCR-DGGE (PCR and denaturing gradient gel electrophoresis [DGGE]) and quantitative PCR (qPCR) assays. DNA crude extracts from the samples incubated with13CH4were loaded onto cesium chloride (CsCl) density gradients together with SYBR safe (Invitro-gen, Carlsbad, CA) as described by Martineau et al. (34). Control tubes contain-ing12C- and13C-labeled DNA from Methylosinus trichosporium were also pre-pared and used to determine the expected position of the DNA when it was not visible in the environmental samples (43). The DNA was centrifuged at 265,000 ⫻ g for 16 h in a Vti80 rotor (L8-70 M ultracentrifuge; Beckman, Fullerton, CA). The DNA was visualized with the Safe Imager blue light tran-silluminator, and the total DNA was collected with a syringe. A second ultra-centrifugation was performed at 177,000 ⫻ g for 40 h to remove humic matter and other potential PCR inhibitors. After this second ultracentrifugation, 250-l DNA fractions were collected, and DNA was recovered from the CsCl by ethanol precipitation. DNA concentration in the extracts from the native samples and from each fraction was determined using the PicoGreen double-stranded DNA (dsDNA) quantitation assay (Invitrogen, Carlsbad, CA).
Real-time qPCR.A list of all primers used in this study is presented in Table 1. qPCR of the 16S rRNA genes of type I and type II methanotrophs was performed by the method of Yergeau et al. (62), with some modifications. The U785F primer was used in combination with either the MethT1bR primer or the MethT2R primer for the quantification of 16S rRNA genes of type I and type II methanotrophs, respectively. The MethT1bR primer was designed to target the 16S rRNA gene of type I methanotrophs from the genera Methylomonas,
Methy-lobacter, Methylomicrobium, and Methylococcus, while the MethT2R primer was designed to target type II methanotrophs from the genera Methylosinus and
Methylocystis(61). qPCR of the pmoA gene was performed using the general PCR assay of Kolb et al. for methanotrophic bacteria (28) using the A189F and Mb661R primers with some modifications. These primers can amplify the pmoA
TABLE 1. Primers used in this study
Target gene positionsE. colia Primer Sequenceb Reference(s)
Bacterial 16S rRNA 785–803 U785F 5⬘-GGATTAGATACCCTGGTAG-3⬘ 2
341–357 U341Fc 5⬘-CCTACGGGAGGCAGCAG-3⬘ 2, 38
785–803 U803R 5⬘-CTACCAGGGTATCTAATCC-3⬘ 2
Type I methanotroph 16S rRNA 988–1006 MethT1bR 5⬘-GATTCYMTGSATGTCAAGG-3⬘ 61
Type II methanotroph 16S rRNA 997–1017 MethT2R 5⬘-CATCTCTGRCSAYCATACCGG-3⬘ 61
pmoA A189Fc,d 5⬘- GGNGACTGGGACTTCTGG-3⬘ 23
Mb661Rd
5⬘- CCGGMGCAACGTCYTTACC-3⬘ 13
aThe positions refer to 16S rRNA gene primer positions.
bN ⫽ A, C, T, or G; Y ⫽ C or T; R ⫽ A or G; M ⫽ A or C; S ⫽ C or G.
cWhen the primer was used for DGGE, a GC clamp was attached to the 5⬘ end (see text).
gene of most known methanotrophs, with some exceptions (17, 51). For all assays, qPCRs were performed in 20-l volumes using the iQ SYBR green supermix (Bio-Rad Laboratories, Hercules, CA) on a Rotor-Gene 3000 appara-tus (Corbett Life Science, Sydney, Australia). Reactions were set up per the manufacturer’s instructions, with ⬃0.5 ng of purified DNA extract from native soil samples. After 3 min of initial denaturation at 95°C, PCR cycling was performed as follows: 40 cycles of 30 s at 95°C, 30 s at 55°C, and 30 s at 72°C. For the pmoA gene, an additional 15-s reading step at 82°C was added at the end of each cycle, and the fluorescence signal was acquired at the end of this step to avoid fluorescence from primer dimers. Standards were made from 10-fold dilutions of linearized plasmids containing the gene fragment of interest that was cloned from amplified pure culture DNA. The limit of detection (LOD) was determined for each qPCR assay used in this study. Briefly, qPCR of a 2-fold dilution series of linearized plasmids containing the gene fragment of interest were performed in 6 replicates, starting with a concentration of approximately 1,000 gene copies/reaction to a concentration of less than 1 gene copy/reaction. The results were used to determine the number of copies necessary for reliable detection of the gene using the LOD tool from the GenEx Pro software (version 4.4.2; MultiD Analyses AB, Go¨teborg, Sweden). When a cutoff value of 34 cycles and a level of confidence of 95% were applied, LODs of 5.43 copies reaction⫺1 (pmoA gene), 12.56 copies reaction⫺1 (16S rRNA gene of type I meth-anotrophs), and 17.56 copies reaction⫺1 (16S rRNA gene of type II meth-anotrophs) were determined. The specificity of each reaction was verified by melting-curve analysis. Lambda DNA was used to correct for potential PCR inhibitors present in soil extracts (3). Briefly, equal volumes of diluted soil DNA extracts and a cloned 500-bp fragment of bacteriophage lambda (105copies per l) were mixed. When the recovery of lambda was below 100%, quantification values for all other genes were corrected accordingly. PCR inhibition ranged from 59% to 89%, and qPCR values for all other assays were corrected accord-ingly.
PCR amplification and DGGE analyses.Microbial patterns associated with the DNA from the native soil samples and from the fractions collected from the cesium chloride density gradients were investigated using denaturing gradient gel electrophoresis (38) of PCR-amplified 16S rRNA and pmoA gene fragments. PCR amplifications targeting the bacterial 16S rRNA gene were performed on a minimum of 2 or 3 DNA fractions from the13C-labeled DNA region (“heavy” DNA fractions) and 2 or 3 DNA fractions from the12C-labeled DNA region (“light” DNA fractions). For both gene amplifications, a GC clamp with the sequence 5⬘-CGCCCGCCGCGCGCGGCGGGCGGGGCGGGGGCACGGG GGG-3⬘ (48) was attached to the 5⬘ end of the forward primer. The U341F and U803R primers were used for PCR amplification of the bacterial 16S rRNA gene, while the A189F and Mb661R primers, in which the degenerate bases were replaced by inosine (7), were used for PCR amplification of the pmoA gene (see Table 1 for more details on the primers). Each 50-l PCR mixture contained ⬃25 ng of template DNA, 0.5 M (each) oligonucleotide primer, 200 M (each) deoxynucleoside triphosphate (dNTP), 1 mM MgCl2, 5 g of DNase-free bovine serum albumin (BSA) (Amersham Biosciences, Baie d’Urfe´, Que´bec, Canada), and 2.5 U of Taq polymerase in 1⫻ buffer (Amersham Biosciences). To increase the specificity of amplification, both genes were amplified by a touchdown PCR method (15). For the 16S rRNA gene, the annealing temperature was set at 65°C and decreased by 1°C every cycle for 10 cycles, and then 15 additional cycles were performed at 55°C. For the pmoA gene amplification, the annealing temperature was set at 60°C and decreased by 0.5°C every cycle for 20 cycles, and then 10 additional cycles were performed at 50°C. After 5 min of initial denaturation at 94°C, each PCR cycle consisted of 1 min at 94°C, 1 min at the annealing temperature, and 3 min at 72°C.
For each sample, 300 ng of amplicon was loaded onto an 8% (wt vol⫺1) acrylamide gel containing a 30 to 65% (16S rRNA gene) or 25 to 55% (pmoA gene) denaturing gradient, where 100% denaturant consists of 7 M urea and 40% formamide. The gels were run at 60°C for 16 h at 80 V using a Bio-Rad Dcode universal mutation detection system (Bio-Rad Laboratories, Mississauga, On-tario, Canada). The gels were stained with SYBR gold (Invitrogen, Carlsbad, CA) and visualized with a FluorImager system model 595 (Molecular Dynamics, Sunnyvale, CA). Selected DGGE bands were excised from the gels and eluted in 60 l of water at 4°C overnight. One microliter of DNA eluate was reamplified with the appropriate corresponding primers without the GC clamp as follows: an initial denaturation of 5 min at 94°C; 25 cycles, where 1 cycle consists of 94°C for 1 min, 58°C for 1 min, and 72°C for 1 min; and a final elongation at 72°C for 30 min. The PCR products were purified using the Illustra GFX PCR DNA puri-fication kit (GE Healthcare, Baie d’Urfe´, Que´bec, Canada). Sequencing was performed by the Laboratoire de Synthe`se et d’Analyze d’Acides Nucle´iques at Universite´ Laval (Ste-Foy, Que´bec, Canada) with a capillary ABI Prism 3100 sequencer.
Phylogenetic, cluster, and statistical analyses.Sequences were analyzed and manually corrected using BioEdit v7.0.5 (Ibis Bioscience, Carlsbad, CA) and were checked for chimeras with Bellerophon (24) using Huber-Hugenholtz cor-rection. The gene sequences (16S rRNA gene) and the deduced amino acid sequences (pmoA gene) were submitted for comparison to the GenBank data-base using the BlastN and BlastP algorithms, respectively. The sequences were aligned with their relatives using ClustalW, and phylogenetic trees were con-structed with the MacVector 7.2 software package (Accelrys, San Diego, CA). The neighbor-joining algorithm was used with Jukes-Cantor correction (16S rRNA gene) or Poisson correction (pmoA deduced amino acid sequences). The robustness of inferred topologies was tested by 1,000 bootstrap resamplings of the neighbor-joining data. DGGE gel image analysis was performed using GelComparII (Applied Maths, Austin, TX). Cluster analyses of 16S rRNA and
pmoADGGE patterns associated with one selected heavy DNA fraction from each sample were performed using the Dice similarity coefficient, and dendro-grams were generated by the unweighted-pair group method using average linkages (UPGMA).
All statistical analyses for the methane oxidation rate data were carried out using R (version 2.7.1; The R Foundation for Statistical Computing). Normality was tested using the “shapiro.test” function. Because transformation failed to normalize data and therefore meet the assumptions of parametric analysis of variance (ANOVA), data were analyzed using Kruskal-Wallis nonparametric ANOVA. Analyses were performed using the “kruskal.test” function of the “pgirmess” library.
Nucleotide sequence accession numbers. The 16S rRNA and pmoA gene sequences obtained in this study have been deposited in the GenBank database under accession numbers HM564340 to HM564353 and HM564354 to HM564378, respectively.
RESULTS
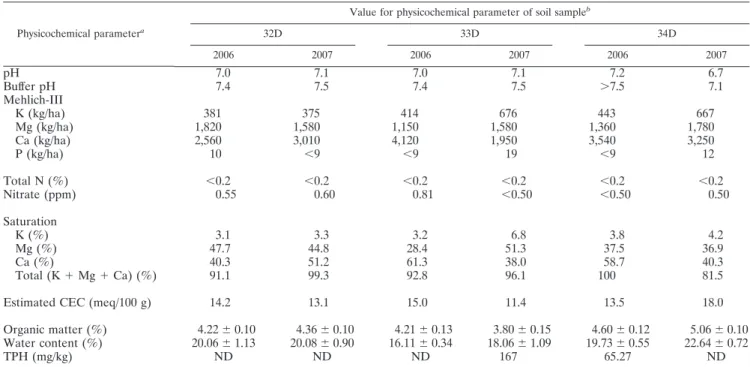
Soil characteristics.The mean annual temperatures at Eu-reka, Ellesmere Island, Nunavut, Canada, were ⫺16.7°C in 2006 and ⫺17.8°C in 2007, with a mean monthly maximum temperature of 11.8°C in July 2007 and a mean monthly min-imum temperature of ⫺42.8°C in March 2007 (http://www .climate.weatheroffice.ec.gc.ca/index.html). Results of soil analyses are presented in Table 2. The three soils had near-neutral pH values and were characterized by low levels of total nitrogen and phosphorus. The total nitrogen concentration was below the detection limit (⬍0.2%) for each soil and for both sampling years, while phosphorous concentrations slightly above the detection limit (9 kg ha⫺1
) were found in soil sam-ples 32D in 2006, 33D in 2007, and 34D in 2007. Organic matter content ranged between 3.8 and 5.06%, while total petroleum hydrocarbons (TPH) were detected only in samples 34D in 2006 and 33D in 2007 at low concentrations.
qPCR quantification.The pmoA gene was detected in all of the native soil samples with the exception of soil sample 32D from 2006 (Fig. 1A), and copy numbers ranged between 1.9 ⫻ 103
and 1.14 ⫻ 104
copies ng⫺1
of total DNA. The 16S rRNA gene of type I methanotrophs was detected in all samples (Fig. 1B), with copy numbers ranging between 1.47 ⫻ 104
and 4.53 ⫻ 104
copies ng⫺1
of total DNA. For all soil samples, the abun-dance of the 16S rRNA gene of type II methanotrophs was below the limit of detection of 17.56 copies/reaction (data not shown).
Methane oxidation rates. Methane oxidation was detected for all soil samples, with or without NMS medium and at both incubation temperatures except for sample 33D from 2007, which did not oxidize methane under any of the tested condi-tions (Fig. 2). No methane oxidation was detected for the autoclaved samples. The methane oxidation rates were signif-icantly (P ⬍ 0.0001) affected by the addition of NMS medium, all rates being much higher when samples were incubated with
NMS medium in soil slurries (Fig. 2B) than without NMS medium (Fig. 2A). Rates were also significantly affected by the temperature of incubation (P ⫽ 0.0043), with all rates being significantly higher at RT than at 4°C except for samples 32D
TABLE 2. Physicochemical parameters of soil samples 32D, 33D, and 34D from Eureka, collected in 2006 and 2007
Physicochemical parametera
Value for physicochemical parameter of soil sampleb
32D 33D 34D 2006 2007 2006 2007 2006 2007 pH 7.0 7.1 7.0 7.1 7.2 6.7 Buffer pH 7.4 7.5 7.4 7.5 ⬎7.5 7.1 Mehlich-III K (kg/ha) 381 375 414 676 443 667 Mg (kg/ha) 1,820 1,580 1,150 1,580 1,360 1,780 Ca (kg/ha) 2,560 3,010 4,120 1,950 3,540 3,250 P (kg/ha) 10 ⬍9 ⬍9 19 ⬍9 12 Total N (%) ⬍0.2 ⬍0.2 ⬍0.2 ⬍0.2 ⬍0.2 ⬍0.2 Nitrate (ppm) 0.55 0.60 0.81 ⬍0.50 ⬍0.50 0.50 Saturation K (%) 3.1 3.3 3.2 6.8 3.8 4.2 Mg (%) 47.7 44.8 28.4 51.3 37.5 36.9 Ca (%) 40.3 51.2 61.3 38.0 58.7 40.3 Total (K ⫹ Mg ⫹ Ca) (%) 91.1 99.3 92.8 96.1 100 81.5
Estimated CEC (meq/100 g) 14.2 13.1 15.0 11.4 13.5 18.0
Organic matter (%) 4.22 ⫾ 0.10 4.36 ⫾ 0.10 4.21 ⫾ 0.13 3.80 ⫾ 0.15 4.60 ⫾ 0.12 5.06 ⫾ 0.10 Water content (%) 20.06 ⫾ 1.13 20.08 ⫾ 0.90 16.11 ⫾ 0.34 18.06 ⫾ 1.09 19.73 ⫾ 0.55 22.64 ⫾ 0.72
TPH (mg/kg) ND ND ND 167 65.27 ND
aMehlich-III is a technique to determine water-soluble and exchangeable K, Mg, Ca, and P. Saturation, percent base saturation; CEC, cationic exchange capacity (milliequivalents/100 g); TPH, total petroleum hydrocarbons.
bFor the organic matter content and water content, values are means of three replicate samples (standard errors of the means are given). ND, TPH not detectable (⬍50 mg/kg).
FIG. 1. Quantitative PCR (qPCR) of pmoA gene (A) and 16S rRNA gene of type I methanotrophs (B) in native soil samples 32D, 33D, and 34D from Eureka, collected in 2006 and 2007. The abun-dance of the 16S rRNA gene of type II methanotrophs was below the limit of detection of 17.56 copies reaction⫺1for all samples (data not
shown). N.D., not detected.
FIG. 2. Methane oxidation rates of soil samples 32D, 33D, and 34D from Eureka, collected in 2006 and 2007 incubated in microcosms without (A) or with (B) the addition of NMS medium at 4°C (䡺) or at room temperature (RT) (f). Values are means of triplicates, and the error bars represent the standard errors of the means. Asterisks indi-cate significantly different means for the temperature treatment within each sample at P ⫽ 0.05 according to Kruskal-Wallis nonparametric ANOVA. N.D., not detected; dw, dry weight.
and 34D in 2006 incubated without NMS medium (Fig. 2B). No significant effect on the methane oxidation rate was de-tected due to the sampling site (P ⫽ 0.524) or the sampling year (P ⫽ 0.904).
Methane oxidation rates increased over time for the slurries of soil and NMS medium, while incubation without NMS me-dium was generally characterized by a decrease in the methane oxidation rate over time (data not shown). Because of this reduction over time for most of the samples incubated without NMS medium, sample 32D from 2007 was the only sample that degraded enough methane to be further analyzed using DNA-SIP. The total incubation time for the samples supplemented with NMS medium varied between 8 and 12 days at RT and between 31 and 45 days at 4°C. The incubation of sample 32D in 2007 without NMS medium was stopped after 200 days for both the RT and 4°C treatments, although methane degrada-tion was not completed in the 4°C incubadegrada-tion.
13C labeling of DNA and DGGE analysis of the 16S rRNA
gene.The heavy DNA fraction (labeled with13
C) was clearly visible in the cesium chloride gradients below the light DNA fraction (labeled with12
C) for all extracts from soils incubated with13
CH4in the presence of NMS medium. The only excep-tion was sample 32D from 2007 incubated without NMS me-dium, so heavy DNA was collected from a position in the gradient that was based on the position of13
C-labeled DNA from a pure culture.
In order to identify microorganisms that utilized13 CH4and incorporated 13
C into their DNA, PCR-DGGE of the 16S rRNA gene was performed on 2 or 3 heavy and light DNA fractions collected from the CsCl gradients. No profile differ-ence was observed between the heavy and light DNA fractions of soil samples incubated with12
CH4(data not shown), while a clear enrichment of some DGGE bands in the heavy DNA fractions was observed when the samples were incubated with 13
CH4(Fig. 3). These enriched bands correspond to the
bac-teria that directly or indirectly assimilated the13
CH4. For the samples incubated with NMS medium, clearly distinct banding profiles characterized by low numbers of intense DGGE bands were found in the heavy DNA fractions (Fig. 3A). For sample 32D from 2007 incubated without NMS medium, the banding profiles were not as distinct in the heavy DNA fractions and several bands were common to all heavy and light DNA frac-tions (Fig. 3B). This could reflect that only a small amount of
DNA was13
C labeled and that a12
C-labeled DNA background is still visible in the heavy DNA fractions. PCR-DGGE analysis of the 16S rRNA gene from the native soil samples did not successfully detect any known methanotrophic bacteria, sug-gesting that they were initially below the detection limit of the technique (data not shown).
For each sample, the DGGE banding pattern of the 16S rRNA gene amplified from the heavy DNA was selected for cluster analyses, and resulted in two main clusters based on their incubation with or without NMS medium (Fig. 4A). Within the samples incubated with NMS medium, the DGGE banding patterns of samples incubated at 4°C were more closely related to each other than to the DGGE banding pat-terns of samples incubated at RT. No clear effect of the sam-pling site or the samsam-pling year on the clustering of the 16S rRNA DGGE banding patterns was observed.
DGGE analysis of the pmoA gene. PCR amplification and DGGE of the pmoA gene were performed on the DNA frac-tions previously selected as being characteristic of the heavy DNA for the 16S rRNA gene, and the corresponding pmoA DGGE banding patterns were analyzed through clustering. Incubation temperature had the strongest effect on the pmoA DGGE banding patterns, with samples incubated at 4°C clus-tering separately from the samples incubated at RT (Fig. 4B). The effect of the incubation with or without NMS medium on the DGGE patterns of the pmoA gene was not as clear as it was for the 16S rRNA gene, and soil sample 32D from 2007
incu-FIG. 3. DGGE of PCR-amplified 16S rRNA gene fragments from DNA fractions retrieved from CsCl density gradients. For each sample, 2 or 3 heavy (H) DNA fractions and 2 or 3 light (L) DNA fractions were selected for DGGE analysis. Bands that are clearly enriched in the heavy DNA fractions compared to the light DNA fractions are indicated by black arrowheads. (A) Typical DGGE pattern obtained for samples incubated with the addition of NMS medium (sample 33D collected in 2006 incubated at room temperature [RT] is presented). (B) DGGE pattern of DNA fractions from sample 32D 2007 incubated at 4°C or at room temperature (RT) without NMS medium. The M lanes contain markers.
bated without NMS at 4°C and RT did not form a separate cluster. No clear effect of the sampling site or sampling year on the clustering of the pmoA gene DGGE patterns was detected. The pmoA gene could not be amplified from the native soil samples when the A189F and Mb661R primers and the GC clamp were used, so DGGE could not be performed.
Sequence analysis of the 16S rRNA and pmoA genes. Spe-cific phylogenetic information for the 16S rRNA and pmoA genes was determined by sequencing of the individual DGGE bands. Unless otherwise indicated in Fig. 4, all bands that migrated to the same position in a gel gave identical sequenc-ing results. Sequences with a length between 420 and 440 bp (16S rRNA gene) or between 400 and 480 bp (130 to 160 deduced amino acids) (pmoA gene) were obtained and were submitted for comparison to the GenBank database.
Bands with 98 or 99% sequence identity to the 16S rRNA gene of Methylobacter tundripaludum (bands 4, 8, 13, and 20)
were found in all samples, with or without NMS medium and at both incubation temperatures, with the exception of soil sample 32D from 2007 incubated with NMS medium at RT (Fig. 4A). All soil samples incubated at RT were characterized by the presence of bands with 96 or 97% identity to the 16S rRNA gene of Methylobacter luteus (bands 10 and 14), while these bands did not appear in the samples incubated at 4°C (Fig. 4A).
When the soil samples were incubated without NMS me-dium, some of the 16S rRNA gene DGGE bands enriched in the heavy DNA fractions were found to be related to bacteria that are not currently known as methanotrophs. Bands related to Myxobacterium sp. strain SMH-27-4 (band 13b, 97% se-quence identity) and to an uncultured Bacteroidetes (band 12, 98% sequence identity) were enriched in the heavy DNA DGGE banding patterns of soil sample 32D incubated at RT without NMS medium (Fig. 4A). Moreover, a band related to
FIG. 4. Cluster analysis of 16S rRNA (A) and pmoA (B) gene DGGE banding patterns of selected heavy DNA fractions collected from CsCl density gradients for Eureka soil samples 32D, 33D, and 34D collected in 2006 and 2007 incubated with NMS medium and for sample 32D collected in 2007 (32D2007) incubated without NMS medium (NoNMS). The bands that were extracted for nucleotide sequencing are numbered.
Methylophilussp. strain ECd5 (band 18, 97% sequence iden-tity) was found at both incubation temperatures (Fig. 4A). Some sequences related to methylotrophs from the
Methylo-philus and Methylotenera genera (bands 11 and 15, 93% and 97% identity, respectively) were also detected in samples in-cubated with NMS medium, especially in the samples incu-bated at RT (Fig. 4A).
A phylogenetic tree of the 16S rRNA gene sequences from bands enriched in the heavy DNA fractions of all soil samples tested and their closest relatives is presented in Fig. 5. All 16S rRNA gene sequences that were related to known meth-anotrophs exhibited more than 96% identity with cultivable type I methanotrophs of the Gammaproteobacteria. These methanotroph sequences mainly formed two groups among the
genus Methylobacter, one group being related to Methylobacter
luteus (GenBank accession no. AF304195) and the other to
Methylobacter tundripaludum(GenBank accession no. AJ414655). Sequences related to Methylosarcina quisquiliarum (GenBank ac-cession no. NR_025040) were found exclusively in sample 32D collected in 2007 incubated without NMS medium at both incu-bation temperatures.
Several of the 16S rRNA gene sequences found in the soil samples from Eureka were closely related to 16S rRNA gene clones from cold environments, including an uncultured
Methy-lotenera-related clone from a Himalayan glacier (GenBank accession no. EU809719), an uncultured Betaproteobacterium-related clone from Siberia groundwater (GenBank accession no. AJ583175), an uncultured Methylobacter-related clone
FIG. 5. Phylogenetic relationships of bacterial 16S rRNA gene sequences obtained from DGGE bands enriched in the heavy DNA fractions collected from CsCl density gradients for soil samples 32D, 33D, and 34D from Eureka, Ellesmere Island, Nunavut, Canada, collected in 2006 and 2007 incubated in the presence of [13C]methane with or without NMS medium and at 4°C or at room temperature. The tree was inferred by
neighbor-joining analysis of 434 homologous positions of sequence from each band. Escherichia coli (GenBank accession no. AJ567606) was used as the outgroup. Numbers on the nodes are the bootstrap values (percentages) based on 1,000 replicates (values above 70 are presented). The scale bar indicates the estimated number of base changes per nucleotide sequence position. The numbered DGGE bands presented in Fig. 4 are shown in roman (normal) type. Known genotypes are shown in boldface type. GenBank accession numbers are shown after the species in smaller type. Lake Constance is located in Germany, Switzerland, and Austria at the northern foot of the Alps.
from the Lena Delta, Siberia (GenBank accession no. EU124849), and an uncultured bacterium from a borehole in Finland (GenBank accession no. FJ823170).
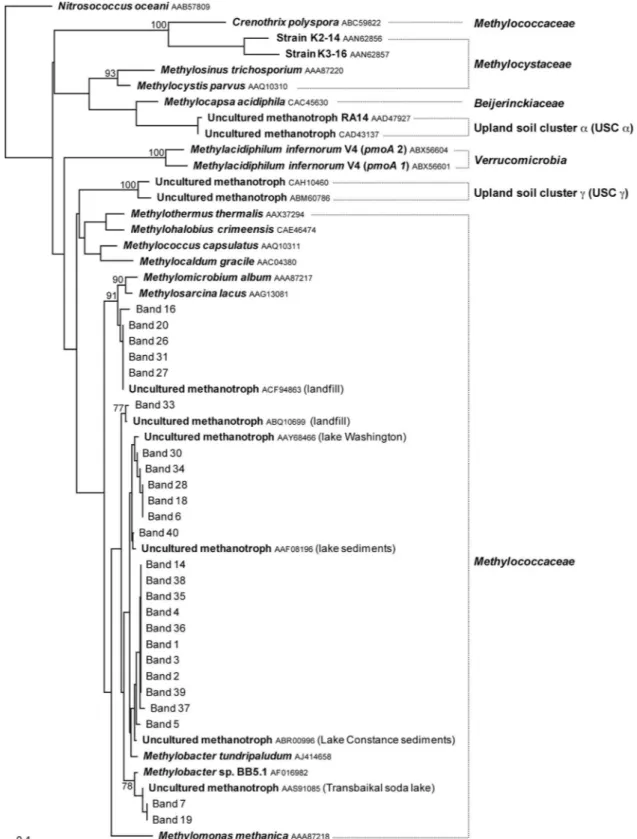
The pmoA DGGE patterns of soil samples incubated at 4°C were characterized by the presence of several bands migrating at different positions in the gel but exhibiting as much as 100% homology (for example, bands 1, 2, and 3 in Fig. 4B). With the exception of bands 16, 20, 26, 27, and 31, which exhibited 93 to 95% identity with Methylosarcina lacus (GenBank accession no. AY007286), all the pmoA amino acid sequences retrieved from the heavy DNA fractions of soil samples from Eureka exhibited more than 94% identity to members of the genus
Methylobacter(Fig. 6). As it was the case for the 16S rRNA gene, several sequences from the 4°C incubations were related to Methylobacter tundripaludum (GenBank accession no. AJ414658).
DISCUSSION
All the Arctic soils examined in this study had the capacity to oxidize methane at room temperature and at 4°C, with and without NMS medium, except for soil sample 33D from 2007. All our soil samples had higher methane oxidation rates at room temperature than at 4°C, which indicates that the active methanotrophic bacterial populations in these Arctic soils are psychrotolerant rather than psychrophilic: quite active at low temperatures (4 to 7°C) but with higher optimal growth tem-peratures (15 to 30°C). Liebner and Wagner (31) also found maximum methane oxidation potentials at 21°C for upper ac-tive-layer soils from the Lena Delta, Siberia, while deeper active-layer soils were more active at 4°C. Several studies have also reported that microbial communities in Arctic soils, including permafrost soils, are dominated by psychrotoler-ant rather than by psychrophilic bacteria (1, 21, 37, 50).
All the soil samples from Eureka were characterized by low levels of nutrients essential to bacterial growth, like nitrogen and phosphorus, which is typical of high-latitude Arctic soils (52). According to our results for methane oxidation rates, this lack of essential nutrients may be an important factor limiting the activity of methanotrophic bacteria in Arctic soils. Indeed, when the soil samples were incubated with nitrate mineral salts (NMS) medium, a growth medium that was designed for the enrichment and isolation of methanotrophic bacteria (60), methane oxidation rates were 15 to 100 times greater than for the corresponding soil samples incubated without NMS me-dium. In trials performed on soil sample 32D from 2007, we found that the addition of only the nitrogen component of the NMS medium resulted in methane oxidation rates that were similar to the NMS treatment, while the addition of tap water or the phosphorous component had only intermediary effects (data not shown). Therefore, nitrogen appears to be the main limiting nutrient to methane oxidation in our samples. Nitro-gen is known to be a strong regulator of methane oxidation in soils, as reviewed by Bodelier and Laanbroek (4). While sev-eral studies have shown that the application of ammonium-based fertilizers can strongly reduce methane consumption by different soil types, a strong stimulation of soil methane con-sumption following application of ammonium- and nitrate-based fertilizers is also frequently observed (4).
Surprisingly, we did not detect methane degradation for soil
sample 33D from 2007 under any of the incubation conditions tested, even though this sample was oxidizing methane in 2006. This corresponded with the detection of small amounts of total petroleum hydrocarbons (TPH) in the sample in 2007 (Table 2) and to increased respiratory activity in the microcosms (data not shown). Our hypothesis is that the input of an exogenous carbon source at this site led to the development of an active heterotrophic bacterial population that outcompeted meth-anotrophic bacteria and limited their activity in the micro-cosms. However, this hypothesis still needs to be confirmed.
While the addition of NMS medium and the incubation temperature were found to greatly increase methane oxidation rates in the soil at Eureka, a strong impact of these two pa-rameters on the bacterial diversity of the heavy DNA fractions from DNA-SIP assays was also observed. Cluster analysis showed that 16S rRNA DGGE banding patterns of heavy DNA fractions from samples incubated without NMS medium were clearly distinct from those of samples incubated with NMS medium. DGGE banding patterns of heavy DNA frac-tions from samples incubated with NMS medium at 4°C were more closely related to each other than to the DGGE banding patterns of samples incubated at RT for both the 16S rRNA and pmoA genes, while no clear effect of the sampling site or sampling year was detected. A previous DNA-SIP study per-formed on soil from an agricultural field had shown that incu-bation with NMS medium can modify the community structure and reduce the diversity of the methanotrophic bacterial pop-ulations of the heavy DNA fraction (9). In addition, it was shown by Mohanty et al. that the relative abundance of differ-ent methanotrophic bacterial populations in soil from a rice field and from a forest is affected by the temperature of incu-bation (36). The absence of a clear effect of the sampling site on the active methanotrophic bacterial populations is not sur-prising, as the three sites were located close to each other and the soil samples had similar physicochemical characteristics (Table 2). However, it is also possible that this absence of effect of the sampling site or year is due to the incubation conditions to which the samples were exposed. These conditions might have selected for specific bacterial populations in all the sam-ples.
Concomitant with the methane oxidation results, sequencing of 16S rRNA and pmoA genes from the heavy DNA fractions of soil samples from Eureka incubated with [13
C]methane in-dicated that the active methanotrophic bacterial populations were related to psychrotolerant bacteria rather than to psy-chrophilic bacteria. Several sequences of the 16S rRNA and
pmoA genes found were related to Methylobacter
tundripalu-dum, a psychrotolerant methanotrophic bacterium with an op-timal growth temperature of 23°C, isolated from an Arctic wetland soil from the Svalbard Islands, Norway (57). When the soil samples were incubated at 4°C with NMS medium, almost 100% of the sequences found in the heavy DNA fractions were related to M. tundripaludum. With one exception, bacteria related to this bacterium were active in all our samples at both incubation temperatures, with and without NMS medium. Se-quences related to M. tundripaludum were therefore detected even under the conditions that were the most closely related to the natural environmental conditions (without NMS medium and at 4°C). These results indicate that psychrotolerant meth-anotrophs related to M. tundripaludum may play a more
im-FIG. 6. Phylogenetic relationships of pmoA deduced amino acid sequences obtained from DGGE bands enriched in the heavy DNA fractions collected from CsCl density gradients for soil samples 32D, 33D, and 34D from Eureka, collected in 2006 and 2007, incubated in the presence of [13C]methane with or without NMS medium at 4°C or at room temperature. The tree was inferred by neighbor-joining analysis of 114 homologous
positions of deduced amino acid sequence from each band. The ammonia monooxygenase subunit A amino acid sequence from Nitrosococcus oceani(GenBank accession no. AAB57809) was used as the outgroup. Numbers on the nodes are the bootstrap values (percentages) based on 1,000 replicates (values above 70 are presented). The scale bar indicates the estimated number of base changes per nucleotide sequence position. The numbered DGGE bands presented in Fig. 4 are shown in roman (normal) type. Known genotypes are shown in boldface type. GenBank accession numbers are shown after the species in smaller type. Lake Washington is located in King County, Washington state. Transbaikal soda lake is located in the Transbaikal region of Russia.
portant role in methane degradation in situ than other bacte-rial taxa that were detected under more selective conditions (with NMS medium and at RT), like Methylobacter luteus. In addition, 16S rRNA gene sequences related to Methylosarcina
quisquiliarumwere found exclusively in soil sample 32D from 2007 incubated without NMS medium at both incubation tem-peratures and might therefore also be ecologically relevant.
Despite some minor differences, the phylogenetic trees gen-erated with the pmoA amino acid and 16S rRNA gene se-quences retrieved by SIP showed a high degree of similarity compared to known methanotrophic bacteria. Some differ-ences between the 16S rRNA and pmoA genes were detected in the closest relatives at the species level, but these differences appeared to be related to a lack of information for the pmoA gene in the databases. For example, no pmoA sequence is available in GenBank for Methylobacter luteus, which was found to be closely related to some of our sequences for the 16S rRNA gene. Overall, all sequences detected in this study exhibited high identities (⬎96% for the 16S rRNA gene and ⬎93% for the pmoA amino acid sequences) to cultured bac-teria.
Although methanotrophs are present in the native soil sam-ples from Eureka, as indicated by their capacity to degrade methane and by the qPCR detection of genes specific to meth-anotrophic bacteria (pmoA gene, 16S rRNA genes of type I and type II methanotrophs), these bacteria do not appear to be dominant members of the bacterial population. PCR-DGGE of the 16S rRNA gene of the native soil samples did not detect sequences related to known methanotrophic bacteria, while the pmoA gene could not be amplified using the A189F and Mb661R primers with the GC clamp, so DGGE could not be performed. Our results also showed that the overall diversity of active methanotrophic bacteria as detected by DNA-SIP in the Eureka soil samples was low. All methanotroph 16S rRNA and
pmoAgene sequences found in the heavy DNA fractions were related to type I methanotrophs from the genera
Methylosar-cinaand Methylobacter, while no sequences related to type II methanotrophs were detected. Interestingly, these results are consistent with those of a recent study by Liebner et al. (30), who used DGGE and cloning of 16S rRNA and pmoA gene fragments to study the methanotrophic bacterial diversity at two depths in an active-layer soil from the Lena Delta, Siberia. For both genes and using either DGGE or cloning, they also found sequences exclusively related to type I methanotrophs from the genera Methylobacter and Methylosarcina, with a strong dominance of sequences related to Methylobacter (30). Several characteristics, including high latitudes, pH, and or-ganic matter content, shared by the Eureka soils analyzed in this study and the soils from the Lena Delta studied by Liebner et al. (30) could explain the similarities in their methanotro-phic bacterial populations. These characteristics might be im-posing selective pressure toward a restricted group of meth-anotrophs that have the capacity to colonize these extreme environments. However, it is also possible that the diversity of the active methanotrophic bacteria in the Eureka samples was negatively affected by the enrichment process that would have occurred during incubation with [13
C]methane.
The dominance of type I methanotrophs over type II meth-anotrophs in the native soil samples was confirmed through the quantitative detection of the 16S rRNA gene using primers
specific to these two groups of bacteria. Earlier studies on soils from the Lena Delta, Siberia, describing the activity and abun-dance of methanotrophic bacteria, showed that type I meth-anotrophs were the most abundant methmeth-anotrophs (31) and that the abundance of a phospholipid fatty acid (PLFA) re-lated to type II methanotrophs was low, if not undetectable, throughout the active layer of soil (56). Immunofluorescence microscopy using 14 antibodies against the majority of known methanotrophic species in Russian tundra bog soils also indi-cated the dominance of members from the genus Methylobacter (55). Yergeau et al. also found a dominance of type I meth-anotrophs over type II methmeth-anotrophs in other active-layer and permafrost soil samples from Eureka, using qPCR of the 16S rRNA gene (62). Using both DNA-SIP and qPCR, we now provide new evidence indicating the importance of type I methanotrophs in high Arctic soils.
Stable isotope probing of DNA is a technique that has some limitations, as discussed by many authors (16, 39). Low sub-strate incorporation and short incubation times can result in poor labeling of the13
C-labeled DNA, which becomes indis-tinguishable from the 12
C-labeled DNA background. High concentrations of the substrate and long incubation times can lead to significant enrichment and cross-feeding, a mechanism by which nontargeted microorganisms incorporate 13
C into their DNA through the metabolism of by-products derived from the targeted organisms. In this study and in most DNA-SIP studies, methane concentrations that are higher than those expected to be found in situ and long incubation times, de-pending of the treatment, were used in order to obtain good 13
C labeling of the DNA. Because of the potential enrichment of low-affinity methanotrophs under these conditions, our re-sults have to be interpreted cautiously in relation to the meth-anotrophic bacterial populations active under in situ condi-tions.
Several of the 16S rRNA gene sequences enriched in the heavy DNA fractions from our soil samples were related to bacteria that were not previously reported as methanotrophs. Most of these sequences were related to bacteria from the genera Methylophilus and Methylotenera, both members of the
Betaproteobacteria. This observation has often been associated with SIP experiments, and sequences related to bacteria known for their capacity to degrade methanol, the first compound produced by methanotrophs during methane oxidation, are widely detected in SIP studies targeting methanotrophic bac-teria (8, 9, 32). While it is generally hypothesized that the presence of these sequences in the heavy DNA fractions is due to cross-feeding, it is extremely challenging to determine whether the bacteria were13
C enriched through direct or in-direct incorporation of the13
C. Recent studies have shown that the diversity of methanotrophic bacteria is broader than what has generally been reported (for a review, see reference 11). Therefore, the hypothesis that the enrichment in the heavy DNA fractions of bacteria that were not previously known as methanotrophs through direct utilization of 13
CH4, and not through cross-feeding, has to be considered.
Conclusions. In this study, we showed that active meth-anotrophic bacterial populations are present in soils from the Canadian high Arctic but that their methane oxidation capacity is limited by nutrient availability and low ambient temperature. These limitations raise questions on the potential of
meth-anotrophic bacteria to oxidize methane in situ and their ability to limit emissions of methane from melting permafrost. Future studies employing in situ soil methane flux measurements and CH4isotope signature analyses (59) should provide insight into the role played by methanotrophic bacteria in the carbon cycle in Arctic environments.
Typically, SIP experiments require incubation conditions and substrate concentrations that differ considerably from the natural environment and the data may have to be interpreted with caution (39). However, most of the results presented in this study using stable isotope probing of DNA are consistent with previous studies demonstrating the important role of type I methanotrophs of the genus Methylobacter in the Arctic en-vironment. The consistent detection of sequences related to
Methylobacter tundripaludumin all our samples and under var-ious incubation conditions suggests that this bacterium might play an important role in Arctic soils and might contribute to the reduction of methane emissions in melting permafrost en-vironments as a result of global warming.
ACKNOWLEDGMENTS
We thank David F. Juck for collecting the soil samples. Logistical support from the Canadian Polar Continental Shelf Project (PCSP) is gratefully acknowledged.
This work was supported by grants from the Natural Sciences and Engineering Research Council of Canada (NSERC) Discovery Pro-gram, Northern Supplements ProPro-gram, Special Research Opportuni-ties IPY Program. Christine Martineau was supported by NSERC and FQRNT postgraduate scholarships for the duration of this project. Additional funding for Christine Martineau was provided by the Northern Scientific Training Program (NSTP) of the Department of Indian and Northern Affairs.
REFERENCES
1. Aislabie, J., D. Saul, and J. Foght. 2006. Bioremediation of hydrocarbon-contaminated polar soils. Extremophiles 10:171–179.
2. Baker, G. C., J. J. Smith, and D. A. Cowan. 2003. Review and re-analysis of domain-specific 16S primers. J. Microbiol. Methods 55:541–555.
3. Beller, H. R., S. R. Kane, T. C. Legler, and P. J. J. Alvarez. 2002. A real-time polymerase chain reaction method for monitoring anaerobic, hydrocarbon-degrading bacteria based on a catabolic gene. Environ. Sci. Technol. 36: 3977–3984.
4. Bodelier, P. L. E., and H. J. Laanbroek. 2004. Nitrogen as a regulatory factor of methane oxidation in soils and sediments. FEMS Microbiol. Ecol. 47:265– 277.
5. Bowman, J. 2006. The methanotrophs—the families Methylococcaceae and
Methylocystaceae, p. 266–289. In M. Dworkin, S. Falkow, E. Rosenberg, K.-H. Schleifer, and E. Stackebrandt (ed.), The prokaryotes, 3rd ed., vol. 5. Springer, New York, NY.
6. Camp, H. J. M. O. D., T. Islam, M. B. Stott, H. R. Harhangi, A. Hynes, S.
Schouten, M. S. M. Jetten, N.-K. Birkeland, A. Pol, and P. F. Dunfield.2009. Environmental, genomic and taxonomic perspectives on methanotrophic
Verrucomicrobia. Environ. Microbiol. Rep. 1:293–306.
7. Candrian, U., B. Furrer, C. Hofelein, and J. Luthy. 1991. Use of inosine-containing oligonucleotide primers for enzymatic amplification of different alleles of the gene coding for heat-stable toxin type I of enterotoxigenic
Escherichia coli. Appl. Environ. Microbiol. 57:955–961.
8. Ce´bron, A., L. Bodrossy, Y. Chen, A. C. Singer, I. P. Thompson, J. I. Prosser,
and J. C. Murrell.2007. Identity of active methanotrophs in landfill cover soil as revealed by DNA-stable isotope probing. FEMS Microbiol. Ecol.
62:12–23.
9. Ce´bron, A., L. Bodrossy, N. Stralis-Pavese, A. C. Singer, I. P. Thompson, J. I.
Prosser, and J. C. Murrell.2007. Nutrient amendments in soil DNA stable isotope probing experiments reduce the observed methanotroph diversity. Appl. Environ. Microbiol. 73:798–807.
10. Centre d’Expertise Environnementale du Que´bec. 1997. Me´thode d’analyse. Sols. Dosage des hydrocarbures pe´troliers C10 a` C50. MA.410-HYD. 1.0. Cen-tre d’Expertise Environnementale du Que´bec, Ministe`re de l’Environnement et de la Faune du Que´bec, Montre´al, Que´bec, Canada.
11. Conrad, R. 2009. The global methane cycle: recent advances in understand-ing the microbial processes involved. Environ. Microbiol. Rep. 1:285–292. 12. Conrad, R. 1996. Soil microorganisms as controllers of atmospheric trace
gases (H2, CO, CH4, OCS, N2O, and NO). Microbiol. Rev. 60:609–640.
13. Costello, A. M., and M. E. Lidstrom. 1999. Molecular characterization of functional and phylogenetic genes from natural populations of meth-anotrophs in lake sediments. Appl. Environ. Microbiol. 65:5066–5074. 14. Dedysh, S. N., N. S. Panikov, and J. M. Tiedje. 1998. Acidophilic
meth-anotrophic communities from sphagnum peat bogs. Appl. Environ. Micro-biol. 64:922–929.
15. Don, R. H., P. T. Cox, B. J. Wainwright, K. Baker, and J. S. Mattick. 1991. Touchdown PCR to circumvent spurious priming during gene amplification. Nucleic Acids Res. 19:4008.
16. Dumont, M. G., and J. C. Murrell. 2005. Stable isotope probing—linking microbial identity to function. Nat. Rev. Microbiol. 3:499–504.
17. Dunfield, P. F., V. N. Khmelenina, N. E. Suzina, Y. A. Trotsenko, and S. N.
Dedysh.2003. Methylocella silvestris sp. nov., a novel methanotroph isolated from an acidic forest cambisol. Int. J. Syst. Evol. Microbiol. 53:1231–1239. 18. Fortin, N., D. Beaumier, K. Lee, and C. W. Greer. 2004. Soil washing
improves the recovery of total community DNA from polluted and high organic content sediments. J. Microbiol. Methods 56:181–191.
19. Fung, I., J. John, J. Lerner, E. Matthews, M. Prather, L. P. Steele, and P. J.
Fraser.1991. 3-Dimensional model synthesis of the global methane cycle. J. Geophys. Res.-Atmos. 96:13033–13065.
20. Ganzert, L., G. Jurgens, U. Munster, and D. Wagner. 2007. Methanogenic communities in permafrost-affected soils of the Laptev Sea coast, Siberian Arctic, characterized by 16S rRNA gene fingerprints. FEMS Microbiol. Ecol.
59:476–488.
21. Gilichinsky, D. 2002. Permafrost, p. 2367–2385. In G. Bitton (ed.), Encyclo-pedia of environmental microbiology. John Wiley & Sons, New York, NY. 22. Hanson, R. S., and T. E. Hanson. 1996. Methanotrophic bacteria. Microbiol.
Rev. 60:439–471.
23. Holmes, A. J., A. Costello, M. E. Lidstrom, and J. C. Murrell. 1995. Evidence that particulate methane monooxygenase and ammonia monooxygenase may be evolutionarily related. FEMS Microbiol. Lett. 132:203–208.
24. Huber, T., G. Faulkner, and P. Hugenholtz. 2004. Bellerophon: a program to detect chimeric sequences in multiple sequence alignments. Bioinformatics
20:2317–2319.
25. Intergovernmental Panel on Climate Change. 2007. Climate change 2007: the physical science basis. Contribution of Working Group I to the Fourth Assessment Report of the Intergovernmental Panel on Climate Change. Cambridge University Press, Cambridge, United Kingdom.
26. Jugnia, L.-B., S. Ait-Benichou, N. Fortin, A. R. Cabral, and C. W. Greer. 2009. Diversity and dynamics of methanotrophs within an experimental land-fill cover soil. Soil Sci. Soc. Am. J. 73:1479–1487.
27. Knittel, K., and A. Boetius. 2009. Anaerobic oxidation of methane: progress with an unknown process. Annu. Rev. Microbiol. 63:311–334.
28. Kolb, S., C. Knief, S. Stubner, and R. Conrad. 2003. Quantitative detection of methanotrophs in soil by novel pmoA-targeted real-time PCR assays. Appl. Environ. Microbiol. 69:2423–2429.
29. Lawrence, D. M., and A. G. Slater. 2005. A projection of severe near-surface permafrost degradation during the 21st century. Geophys. Res. Lett. 32: L24401. doi:10.1029/2005GL025080.
30. Liebner, S., K. Rublack, T. Stuehrmann, and D. Wagner. 2009. Diversity of aerobic methanotrophic bacteria in a permafrost active layer soil of the Lena Delta, Siberia. Microb. Ecol. 57:25–35.
31. Liebner, S., and D. Wagner. 2007. Abundance, distribution and potential activity of methane oxidizing bacteria in permafrost soils from the Lena Delta, Siberia. Environ. Microbiol. 9:107–117.
32. Lin, J.-L., S. Radajewski, B. T. Eshinimaev, Y. A. Trotsenko, I. R. McDonald,
and J. C. Murrell.2004. Molecular diversity of methanotrophs in Trans-baikal soda lake sediments and identification of potentially active popula-tions by stable isotope probing. Environ. Microbiol. 6:1049–1060. 33. MacDonald, G. J. 1990. Role of methane clathrates in past and future
climates. Clim. Change 16:247–281.
34. Martineau, C., L. G. Whyte, and C. W. Greer. 2008. Development of a SYBR Safe technique for the sensitive detection of DNA in cesium chloride density gradients for stable isotope probing assays. J. Microbiol. Methods 73:199– 202.
35. Metje, M., and P. Frenzel. 2007. Methanogenesis and methanogenic path-ways in a peat from subarctic permafrost. Environ. Microbiol. 9:954–964. 36. Mohanty, S. R., P. L. E. Bodelier, and R. Conrad. 2007. Effect of
tempera-ture on composition of the methanotrophic community in rice field and forest soil. FEMS Microbiol. Ecol. 62:24–31.
37. Mohn, W. W., and G. R. Stewart. 2000. Limiting factors for hydrocarbon biodegradation at low temperature in Arctic soils. Soil Biol. Biochem. 32: 1161–1172.
38. Muyzer, G., E. C. Dewaal, and A. G. Uitterlinden. 1993. Profiling of complex microbial populations by denaturing gradient gel electrophoresis analysis of polymerase chain reaction-amplified genes coding for 16S ribosomal RNA. Appl. Environ. Microbiol. 59:695–700.
39. Neufeld, J., M. Dumont, J. Vohra, and J. Murrell. 2007. Methodological considerations for the use of stable isotope probing in microbial ecology. Microb. Ecol. 53:435–442.
40. Omelchenko, M. V., L. V. Vasilyeva, and G. A. Zavarzin. 1993. Psychrophilic methanotroph from tundra soil. Curr. Microbiol. 27:255–259.
41. Pacheco-Oliver, M., I. R. McDonald, D. Groleau, J. C. Murrell, and C. B.
Miguez. 2002. Detection of methanotrophs with highly divergent pmoA genes from Arctic soils. FEMS Microbiol. Lett. 209:313–319.
42. Post, W. M., W. R. Emanuel, P. J. Zinke, and A. G. Stangenberger. 1982. Soil carbon pools and world life zones. Nature 298:156–159.
43. Radajewski, S., P. Ineson, N. R. Parekh, and J. C. Murrell. 2000. Stable-isotope probing as a tool in microbial ecology. Nature 403:646–649. 44. Rivkina, E., V. Shcherbakova, K. Laurinavichius, L. Petrovskaya, K.
Kriv-ushin, G. Kraev, S. Pecheritsina, and D. Gilichinsky.2007. Biogeochemistry of methane and methanogenic archaea in permafrost. FEMS Microbiol. Ecol. 61:1–15.
45. Roy, R., and C. W. Greer. 2000. Hexadecane mineralization and denitrifica-tion in two diesel fuel-contaminated soils. FEMS Microbiol. Ecol. 32:17–23. 46. Schuur, E. A. G., J. Bockheim, J. G. Canadell, E. Euskirchen, C. B. Field,
S. V. Goryachkin, S. Hagemann, P. Kuhry, P. M. Lafleur, H. Lee, G. Mazhi-tova, F. E. Nelson, A. Rinke, V. E. Romanovsky, N. Shiklomanov, C. Tarno-cai, S. Venevsky, J. G. Vogel, and S. A. Zimov.2008. Vulnerability of per-mafrost carbon to climate change: implications for the global carbon cycle. Bioscience 58:701–714.
47. Schuur, E. A. G., J. G. Vogel, K. G. Crummer, H. Lee, J. O. Sickman, and
T. E. Osterkamp.2009. The effect of permafrost thaw on old carbon release and net carbon exchange from tundra. Nature 459:556–559.
48. Sheffield, V. C., D. R. Cox, L. S. Lerman, and R. M. Myers. 1989. Attachment of a 40-base-pair G⫹C-rich sequence (GC-clamp) to genomic DNA frag-ments by the polymerase chain reaction results in improved detection of single-base changes. Proc. Natl. Acad. Sci. U. S. A. 86:232–236.
49. Simankova, M. V., O. R. Kotsyurbenko, T. Lueders, A. N. Nozhevnikova, B.
Wagner, R. Conrad, and M. W. Friedrich.2003. Isolation and characteriza-tion of new strains of methanogens from cold terrestrial habitats. Syst. Appl. Microbiol. 26:312–318.
50. Steven, B., G. Briggs, C. P. McKay, W. H. Pollard, C. W. Greer, and L. G.
Whyte.2007. Characterization of the microbial diversity in a permafrost sample from the Canadian high Arctic using dependent and culture-independent methods. FEMS Microbiol. Ecol. 59:513–523.
51. Stralis-Pavese, N., A. Sessitsch, A. Weilharter, T. Reichenauer, J. Riesing, J.
Csontos, J. C. Murrell, and L. Bodrossy.2004. Optimization of diagnostic microarray for application in analysing landfill methanotroph communities under different plant covers. Environ. Microbiol. 6:347–363.
52. Tarnocai, C., and I. Campbell. 2006. Soils of the polar region, p. 1330–1333.
InR. Lal (ed.), Encyclopedia of soil science, 2nd ed. Taylor & Francis, Boca Raton, FL.
53. Tarnocai, C., J. G. Canadell, E. A. G. Schuur, P. Kuhry, G. Mazhitova, and
S. Zimov.2009. Soil organic carbon pools in the northern circumpolar per-mafrost region. Global Biogeochem. Cycles Global Biogeochem. Cycles 23:2. doi:10.1029/2008GB003327.
54. Trotsenko, Y. A., and V. N. Khmelenina. 2005. Aerobic methanotrophic bacteria of cold ecosystems. FEMS Microbiol. Ecol. 53:15–26.
55. Vecherskaya, M. S., V. F. Galchenko, E. N. Sokolova, and V. A. Samarkin. 1993. Activity and species composition of aerobic methanotrophic commu-nities in tundra soils. Curr. Microbiol. 27:181–184.
56. Wagner, D., A. Lipski, A. Embacher, and A. Gattinger. 2005. Methane fluxes in permafrost habitats of the Lena delta: effects of microbial community structure and organic matter quality. Environ. Microbiol. 7:1582–1592. 57. Wartiainen, I., A. G. Hestnes, I. R. McDonald, and M. M. Svenning. 2006.
Methylobacter tundripaludumsp. nov., a methane-oxidizing bacterium from Arctic wetland soil on the Svalbard Islands, Norway (78 degrees N). Int. J. Syst. Evol. Microbiol. 56:109–113.
58. Wartiainen, I., A. G. Hestnes, and M. M. Svenning. 2003. Methanotrophic diversity in high arctic wetlands on the islands of Svalbard (Norway)— denaturing gradient gel electrophoresis analysis of soil DNA and enrichment cultures. Can. J. Microbiol. 49:602–612.
59. Whiticar, M. J. 1999. Carbon and hydrogen isotope systematics of bacterial formation and oxidation of methane. Chem. Geol. 161:291–314.
60. Whittenbury, R., K. C. Phillips, and J. F. Wilkinson. 1970. Enrichment, isolation and some properties of methane-utilizing bacteria. J. Gen. Micro-biol. 61:205–218.
61. Wise, M. G., J. V. McArthur, and L. J. Shimkets. 1999. Methanotroph diversity in landfill soil: isolation of novel type I and type II methanotrophs whose presence was suggested by culture-independent 16S ribosomal DNA analysis. Appl. Environ. Microbiol. 65:4887–4897.
62. Yergeau, E., H. Hogues, L. G. Whyte, and C. W. Greer. 15 April 2010. The functional potential of high Arctic permafrost revealed by metagenomic sequencing, qPCR and microarray analyses. ISME J. doi:10.1038/is-mej.2010.41. [Epub ahead of print.]
63. Zhang, T., J. A. Heginbottom, R. G. Barry, and J. Brown. 2000. Further statistics on the distribution of permafrost and ground ice in the Northern Hemisphere. Polar Geogr. 24:126–131.