arXiv:0805.1521v1 [nucl-ex] 11 May 2008
from √s
NN= 22.5 to 200 GeV
A. Adare,10 S.S. Adler,5 S. Afanasiev,24 C. Aidala,11 N.N. Ajitanand,51 Y. Akiba,26, 45, 46 H. Al-Bataineh,40 J. Alexander,51 A. Al-Jamel,40K. Aoki,30, 45 L. Aphecetche,53 R. Armendariz,40 S.H. Aronson,5 J. Asai,46
E.T. Atomssa,31 R. Averbeck,52 T.C. Awes,41 B. Azmoun,5 V. Babintsev,20 G. Baksay,16 L. Baksay,16 A. Baldisseri,13 K.N. Barish,6 P.D. Barnes,33 B. Bassalleck,39S. Bathe,6, 36 S. Batsouli,11, 41 V. Baublis,44 F. Bauer,6A. Bazilevsky,5, 46 S. Belikov,5, 20, 23, ∗ R. Bennett,52Y. Berdnikov,48 A.A. Bickley,10M.T. Bjorndal,11
J.G. Boissevain,33 H. Borel,13 K. Boyle,52 M.L. Brooks,33D.S. Brown,40 N. Bruner,39 D. Bucher,36 H. Buesching,5, 36 V. Bumazhnov,20 G. Bunce,5, 46 J.M. Burward-Hoy,32, 33 S. Butsyk,33, 52 X. Camard,53 S. Campbell,52 J.-S. Chai,25 P. Chand,4 B.S. Chang,60 W.C. Chang,2 J.-L. Charvet,13 S. Chernichenko,20 J. Chiba,26C.Y. Chi,11 M. Chiu,11, 21 I.J. Choi,60 R.K. Choudhury,4 T. Chujo,5, 57 P. Chung,51A. Churyn,20
V. Cianciolo,41 C.R. Cleven,18 Y. Cobigo,13 B.A. Cole,11 M.P. Comets,42 P. Constantin,23, 33 M. Csan´ad,15 T. Cs¨org˝o,27 J.P. Cussonneau,53T. Dahms,52 K. Das,17 G. David,5 F. De´ak,15M.B. Deaton,1 K. Dehmelt,16
H. Delagrange,53A. Denisov,20 D. d’Enterria,11 A. Deshpande,46, 52 E.J. Desmond,5 A. Devismes,52 O. Dietzsch,49 A. Dion,52 M. Donadelli,49 J.L. Drachenberg,1 O. Drapier,31 A. Drees,52 A.K. Dubey,59 A. Durum,20 D. Dutta,4 V. Dzhordzhadze,6, 54 Y.V. Efremenko,41 J. Egdemir,52 F. Ellinghaus,10W.S. Emam,6
A. Enokizono,19, 32 H. En’yo,45, 46 B. Espagnon,42 S. Esumi,56 K.O. Eyser,6 D.E. Fields,39, 46 C. Finck,53 M. Finger, Jr.,7, 24 M. Finger,7, 24 F. Fleuret,31 S.L. Fokin,29 B. Forestier,34 B.D. Fox,46 Z. Fraenkel,59, ∗ J.E. Frantz,11, 52 A. Franz,5 A.D. Frawley,17 K. Fujiwara,45Y. Fukao,30, 45, 46 S.-Y. Fung,6 T. Fusayasu,38 S. Gadrat,34 I. Garishvili,54 F. Gastineau,53 M. Germain,53 A. Glenn,10, 54 H. Gong,52M. Gonin,31J. Gosset,13
Y. Goto,45, 46 R. Granier de Cassagnac,31 N. Grau,23 S.V. Greene,57 M. Grosse Perdekamp,21, 46 T. Gunji,9 H.-˚A. Gustafsson,35 T. Hachiya,19, 45 A. Hadj Henni,53 C. Haegemann,39 J.S. Haggerty,5 M.N. Hagiwara,1 H. Hamagaki,9 R. Han,43 A.G. Hansen,33 H. Harada,19 E.P. Hartouni,32 K. Haruna,19M. Harvey,5 E. Haslum,35
K. Hasuko,45R. Hayano,9 M. Heffner,32 T.K. Hemmick,52 T. Hester,6 J.M. Heuser,45 X. He,18 P. Hidas,27 H. Hiejima,21 J.C. Hill,23 R. Hobbs,39 M. Hohlmann,16 M. Holmes,57 W. Holzmann,51K. Homma,19B. Hong,28 A. Hoover,40T. Horaguchi,45, 46, 55 D. Hornback,54M.G. Hur,25 T. Ichihara,45, 46 V.V. Ikonnikov,29 K. Imai,30, 45
M. Inaba,56 Y. Inoue,47, 45 M. Inuzuka,9 D. Isenhower,1 L. Isenhower,1 M. Ishihara,45 T. Isobe,9M. Issah,51 A. Isupov,24 B.V. Jacak,52, †J. Jia,11, 52 J. Jin,11 O. Jinnouchi,45, 46 B.M. Johnson,5 S.C. Johnson,32 K.S. Joo,37
D. Jouan,42 F. Kajihara,9, 45 S. Kametani,9, 58 N. Kamihara,45, 55J. Kamin,52 M. Kaneta,46 J.H. Kang,60 H. Kanou,45, 55 K. Katou,58 T. Kawabata,9T. Kawagishi,56D. Kawall,46A.V. Kazantsev,29 S. Kelly,10, 11 B. Khachaturov,59A. Khanzadeev,44J. Kikuchi,58 D.H. Kim,37 D.J. Kim,60E. Kim,50 G.-B. Kim,31 H.J. Kim,60 Y.-S. Kim,25E. Kinney,10 A. Kiss,15E. Kistenev,5 A. Kiyomichi,45 J. Klay,32C. Klein-Boesing,36 H. Kobayashi,46 L. Kochenda,44V. Kochetkov,20R. Kohara,19 B. Komkov,44M. Konno,56 D. Kotchetkov,6 A. Kozlov,59 A. Kr´al,12
A. Kravitz,11 P.J. Kroon,5 J. Kubart,7, 22 C.H. Kuberg,1, ∗ G.J. Kunde,33 N. Kurihara,9 K. Kurita,45, 47 M.J. Kweon,28 Y. Kwon,54, 60 G.S. Kyle,40R. Lacey,51Y.-S. Lai,11 J.G. Lajoie,23A. Lebedev,23, 29 Y. Le Bornec,42
S. Leckey,52 D.M. Lee,33 M.K. Lee,60 T. Lee,50 M.J. Leitch,33 M.A.L. Leite,49 B. Lenzi,49 H. Lim,50 T. Liˇska,12 A. Litvinenko,24M.X. Liu,33X. Li,8X.H. Li,6B. Love,57D. Lynch,5C.F. Maguire,57Y.I. Makdisi,5A. Malakhov,24
M.D. Malik,39 V.I. Manko,29 Y. Mao,43, 45 G. Martinez,53 L. Maˇsek,7, 22 H. Masui,56 F. Matathias,11, 52 T. Matsumoto,9, 58 M.C. McCain,1, 21 M. McCumber,52 P.L. McGaughey,33Y. Miake,56 P. Mikeˇs,7, 22K. Miki,56
T.E. Miller,57 A. Milov,52 S. Mioduszewski,5 G.C. Mishra,18 M. Mishra,3 J.T. Mitchell,5 M. Mitrovski,51 A.K. Mohanty,4 A. Morreale,6D.P. Morrison,5J.M. Moss,33 T.V. Moukhanova,29 D. Mukhopadhyay,57, 59 M. Muniruzzaman,6 J. Murata,47, 45 S. Nagamiya,26Y. Nagata,56 J.L. Nagle,10, 11 M. Naglis,59I. Nakagawa,45, 46
Y. Nakamiya,19T. Nakamura,19K. Nakano,45, 55J. Newby,32, 54 M. Nguyen,52 B.E. Norman,33A.S. Nyanin,29 J. Nystrand,35 E. O’Brien,5 S.X. Oda,9C.A. Ogilvie,23H. Ohnishi,45 I.D. Ojha,3, 57 H. Okada,30, 45K. Okada,45, 46
M. Oka,56 O.O. Omiwade,1 A. Oskarsson,35I. Otterlund,35 M. Ouchida,19 K. Oyama,9 K. Ozawa,9R. Pak,5 D. Pal,57, 59 A.P.T. Palounek,33 V. Pantuev,52V. Papavassiliou,40 J. Park,50W.J. Park,28 S.F. Pate,40 H. Pei,23
V. Penev,24J.-C. Peng,21 H. Pereira,13 V. Peresedov,24 D.Yu. Peressounko,29A. Pierson,39 C. Pinkenburg,5 R.P. Pisani,5M.L. Purschke,5 A.K. Purwar,33, 52 J.M. Qualls,1 H. Qu,18 J. Rak,23, 39 A. Rakotozafindrabe,31 I. Ravinovich,59K.F. Read,41, 54S. Rembeczki,16 M. Reuter,52 K. Reygers,36 V. Riabov,44Y. Riabov,44G. Roche,34
A. Romana,31, ∗ M. Rosati,23 S.S.E. Rosendahl,35 P. Rosnet,34 P. Rukoyatkin,24V.L. Rykov,45 S.S. Ryu,60 B. Sahlmueller,36 N. Saito,30, 45, 46 T. Sakaguchi,5, 9, 58 S. Sakai,56H. Sakata,19V. Samsonov,44 L. Sanfratello,39 R. Santo,36 H.D. Sato,30, 45 S. Sato,5, 26, 56 S. Sawada,26Y. Schutz,53J. Seele,10R. Seidl,21 V. Semenov,20R. Seto,6
D. Sharma,59 T.K. Shea,5 I. Shein,20 A. Shevel,44, 51 T.-A. Shibata,45, 55 K. Shigaki,19 M. Shimomura,56 T. Shohjoh,56 K. Shoji,30, 45 A. Sickles,52 C.L. Silva,49 D. Silvermyr,33, 41 C. Silvestre,13 K.S. Sim,28 C.P. Singh,3
V. Singh,3 S. Skutnik,23 M. Sluneˇcka,7, 24 W.C. Smith,1 A. Soldatov,20 R.A. Soltz,32 W.E. Sondheim,33 S.P. Sorensen,54 I.V. Sourikova,5F. Staley,13 P.W. Stankus,41 E. Stenlund,35 M. Stepanov,40 A. Ster,27 S.P. Stoll,5 T. Sugitate,19 C. Suire,42J.P. Sullivan,33 J. Sziklai,27T. Tabaru,46 S. Takagi,56 E.M. Takagui,49 A. Taketani,45, 46 K.H. Tanaka,26Y. Tanaka,38 K. Tanida,45, 46 M.J. Tannenbaum,5 A. Taranenko,51 P. Tarj´an,14 T.L. Thomas,39 M. Togawa,30, 45A. Toia,52J. Tojo,45 L. Tom´aˇsek,22 H. Torii,30, 45, 46 R.S. Towell,1V-N. Tram,31
I. Tserruya,59Y. Tsuchimoto,19, 45 S.K. Tuli,3 H. Tydesj¨o,35N. Tyurin,20 T.J. Uam,37 C. Vale,23 H. Valle,57 H.W. van Hecke,33 J. Velkovska,5, 57M. Velkovsky,52 R. Vertesi,14 V. Veszpr´emi,14A.A. Vinogradov,29M. Virius,12
M.A. Volkov,29V. Vrba,22 E. Vznuzdaev,44 M. Wagner,30, 45 D. Walker,52X.R. Wang,18, 40 Y. Watanabe,45, 46 J. Wessels,36 S.N. White,5 N. Willis,42 D. Winter,11 F.K. Wohn,23 C.L. Woody,5 M. Wysocki,10 W. Xie,6, 46
Y.L. Yamaguchi,58 A. Yanovich,20 Z. Yasin,6 J. Ying,18 S. Yokkaichi,45, 46 G.R. Young,41 I. Younus,39 I.E. Yushmanov,29 W.A. Zajc,11 O. Zaudtke,36 C. Zhang,11, 41S. Zhou,8 J. Zim´anyi,27, ∗ L. Zolin,24 and X. Zong23
(PHENIX Collaboration)
1Abilene Christian University, Abilene, TX 79699, USA 2Institute of Physics, Academia Sinica, Taipei 11529, Taiwan 3Department of Physics, Banaras Hindu University, Varanasi 221005, India
4Bhabha Atomic Research Centre, Bombay 400 085, India 5Brookhaven National Laboratory, Upton, NY 11973-5000, USA 6University of California - Riverside, Riverside, CA 92521, USA 7Charles University, Ovocn´y trh 5, Praha 1, 116 36, Prague, Czech Republic 8China Institute of Atomic Energy (CIAE), Beijing, People’s Republic of China
9Center for Nuclear Study, Graduate School of Science, University of Tokyo, 7-3-1 Hongo, Bunkyo, Tokyo 113-0033, Japan 10University of Colorado, Boulder, CO 80309, USA
11Columbia University, New York, NY 10027 and Nevis Laboratories, Irvington, NY 10533, USA 12Czech Technical University, Zikova 4, 166 36 Prague 6, Czech Republic
13Dapnia, CEA Saclay, F-91191, Gif-sur-Yvette, France 14Debrecen University, H-4010 Debrecen, Egyetem t´er 1, Hungary
15ELTE, E¨otv¨os Lor´and University, H - 1117 Budapest, P´azm´any P. s. 1/A, Hungary 16Florida Institute of Technology, Melbourne, FL 32901, USA
17Florida State University, Tallahassee, FL 32306, USA 18Georgia State University, Atlanta, GA 30303, USA
19Hiroshima University, Kagamiyama, Higashi-Hiroshima 739-8526, Japan
20IHEP Protvino, State Research Center of Russian Federation, Institute for High Energy Physics, Protvino, 142281, Russia 21University of Illinois at Urbana-Champaign, Urbana, IL 61801, USA
22Institute of Physics, Academy of Sciences of the Czech Republic, Na Slovance 2, 182 21 Prague 8, Czech Republic 23Iowa State University, Ames, IA 50011, USA
24Joint Institute for Nuclear Research, 141980 Dubna, Moscow Region, Russia 25KAERI, Cyclotron Application Laboratory, Seoul, Korea
26KEK, High Energy Accelerator Research Organization, Tsukuba, Ibaraki 305-0801, Japan 27KFKI Research Institute for Particle and Nuclear Physics of the Hungarian Academy
of Sciences (MTA KFKI RMKI), H-1525 Budapest 114, POBox 49, Budapest, Hungary
28Korea University, Seoul, 136-701, Korea
29Russian Research Center “Kurchatov Institute”, Moscow, Russia 30Kyoto University, Kyoto 606-8502, Japan
31Laboratoire Leprince-Ringuet, Ecole Polytechnique, CNRS-IN2P3, Route de Saclay, F-91128, Palaiseau, France 32Lawrence Livermore National Laboratory, Livermore, CA 94550, USA
33Los Alamos National Laboratory, Los Alamos, NM 87545, USA
34LPC, Universit´e Blaise Pascal, CNRS-IN2P3, Clermont-Fd, 63177 Aubiere Cedex, France 35Department of Physics, Lund University, Box 118, SE-221 00 Lund, Sweden 36Institut f¨ur Kernphysik, University of Muenster, D-48149 Muenster, Germany
37Myongji University, Yongin, Kyonggido 449-728, Korea
38Nagasaki Institute of Applied Science, Nagasaki-shi, Nagasaki 851-0193, Japan 39University of New Mexico, Albuquerque, NM 87131, USA
40New Mexico State University, Las Cruces, NM 88003, USA 41Oak Ridge National Laboratory, Oak Ridge, TN 37831, USA
42IPN-Orsay, Universite Paris Sud, CNRS-IN2P3, BP1, F-91406, Orsay, France 43Peking University, Beijing, People’s Republic of China
44PNPI, Petersburg Nuclear Physics Institute, Gatchina, Leningrad region, 188300, Russia 45RIKEN, The Institute of Physical and Chemical Research, Wako, Saitama 351-0198, Japan 46RIKEN BNL Research Center, Brookhaven National Laboratory, Upton, NY 11973-5000, USA
47Physics Department, Rikkyo University, 3-34-1 Nishi-Ikebukuro, Toshima, Tokyo 171-8501, Japan 48Saint Petersburg State Polytechnic University, St. Petersburg, Russia
49Universidade de S˜ao Paulo, Instituto de F´ısica, Caixa Postal 66318, S˜ao Paulo CEP05315-970, Brazil 50System Electronics Laboratory, Seoul National University, Seoul, Korea
51Chemistry Department, Stony Brook University, Stony Brook, SUNY, NY 11794-3400, USA 52Department of Physics and Astronomy, Stony Brook University, SUNY, Stony Brook, NY 11794, USA 53SUBATECH (Ecole des Mines de Nantes, CNRS-IN2P3, Universit´e de Nantes) BP 20722 - 44307, Nantes, France
54University of Tennessee, Knoxville, TN 37996, USA
55Department of Physics, Tokyo Institute of Technology, Oh-okayama, Meguro, Tokyo 152-8551, Japan 56Institute of Physics, University of Tsukuba, Tsukuba, Ibaraki 305, Japan
57Vanderbilt University, Nashville, TN 37235, USA 58Waseda University, Advanced Research Institute for Science and
Engineering, 17 Kikui-cho, Shinjuku-ku, Tokyo 162-0044, Japan
59Weizmann Institute, Rehovot 76100, Israel 60Yonsei University, IPAP, Seoul 120-749, Korea
(Dated: November 2, 2018)
A comprehensive survey of event-by-event fluctuations of charged hadron multiplicity in rela-tivistic heavy ions is presented. The survey covers Au+Au collisions at √sNN = 62.4 and 200
GeV, and Cu+Cu collisions at√sNN = 22.5, 62.4, and 200 GeV. Fluctuations are measured as a
function of collision centrality, transverse momentum range, and charge sign. After correcting for non-dynamical fluctuations due to fluctuations in the collision geometry within a centrality bin, the remaining dynamical fluctuations expressed as the variance normalized by the mean tend to decrease with increasing centrality. The dynamical fluctuations are consistent with or below the expectation from a superposition of participant nucleon-nucleon collisions based upon p+p data, indicating that this dataset does not exhibit evidence of critical behavior in terms of the compressibility of the system. A comparison of the data with a model where hadrons are independently emitted from a number of hadron clusters suggests that the mean number of hadrons per cluster is small in heavy ion collisions.
PACS numbers: 25.75.Gz, 25.75.Nq, 21.65.Qr, 25.75.Ag
I. INTRODUCTION
Recent work with lattice gauge theory simulations has attempted to map out the phase diagram of Quan-tum Chromodynamics (QCD) in temperature and baryo-chemical potential (µB) using finite values of the up and down quark masses. The results of these studies indi-cate that the QCD phase diagram may contain a first-order transition line between the hadron gas phase and the strongly-coupled Quark-Gluon Plasma (sQGP) phase that terminates at a critical point [1]. This property is analogous to that observed in the phase diagram for many common liquids and other substances, including water. However, different model predictions and lattice calculations yield widely varying estimates of the loca-tion of the critical point on the QCD phase diagram [2]. Direct experimental observation of critical phenom-ena in heavy ion collisions would confirm the existence of the critical point, narrow down its location on the QCD phase diagram, and provide an important constraint for the QCD models.
The estimated value of energy densities achieved in heavy ion collisions at the Brookhaven National Labo-ratory’s Relativistic Heavy Ion Collider (RHIC) exceeds
∗Deceased
†PHENIX Spokesperson: jacak@skipper.physics.sunysb.edu
the threshold for a phase transition from normal hadronic matter to partonic matter. Recent experimental evidence indicates that properties of the matter being produced include strong collective flow and large opacity to scat-tered quarks and gluons - the matter appears to behave much like a perfect fluid [3]. While measurements suggest the produced matter has properties that differ from nor-mal nuclear matter, unambiguous evidence of the nature and location of any phase transition from normal nuclear matter has been elusive thus far. Described here is a search for direct evidence of a phase transition by mea-suring the fluctuations of the event-by-event multiplici-ties of produced charge particles in a variety of collision systems.
In order to illustrate how the measurement of charged particle multiplicity fluctuations can be sensitive to the presence of a phase transition, the isothermal compress-ibility of the system can be considered [4]. The isother-mal compressibility is defined as follows:
kT = −1/V (δV/δP )T, (1)
where V is the volume, T is the temperature, and P is the pressure of the system. In order to relate the com-pressibility to measurements of multiplicity fluctuations, we assume that relativistic nucleus-nucleus collisions can be described as a thermal system in the Grand Canon-ical Ensemble (GCE) [5]. The GCE can be applied to the case of measurements near mid-rapidity since energy
and conserved quantum numbers in this region can be ex-changed with the rest of the system, that serves as a heat bath [6]. Detailed studies of multiplicity fluctuations in the Canonical and Microcanonical Ensembles with the application of conservation laws can be found elsewhere [7, 8]. In the GCE, the isothermal compressibility is di-rectly related to the variance of the particle multiplicity as follows:
h(N − hNi)2i = var(N) = kBT hNi2
V kT, (2)
where N is the particle multiplicity, hNi = µN is the mean multiplicity, and kB is Boltzmann’s constant [9]. Here, multiplicity fluctuation measurements are pre-sented in terms of the scaled variance, ωN:
ωN= var(N ) µN = kBT µN V kT (3)
In a continuous, or second-order, phase transition, the compressibility diverges to an infinite value at the critical point. Near the critical point, this divergence is described by a power law in the variable ǫ = (T − TC)/TC, where TC is the critical temperature. Hence, the relationship between multiplicity fluctuations and the compressibility can be exploited to search for a clear signature of critical behavior by looking for the expected power law scaling of the compressibility:
kT∝ (T − TC TC
)−γ∝ ǫ−γ, (4)
where γ is the critical exponent for isothermal compress-ibility [9]. If the QCD phase diagram contains a critical point, systems with a low value of baryo-chemical poten-tial (µB) could pass through the cross-over region and un-dergo a continuous phase transition [2]. Recent estimates [10, 11] of the behavior of the quark number susceptibil-ity, χq, which is proportional to the value of the isother-mal compressibility of the system, predict that its value will increase by at least an order of magnitude close to the QCD critical point. Given that the scaled variance is pro-portional to kT, measurements of charged particle mul-tiplicity are expected to be a sensitive probe for critical behavior. In addition, within a scenario where droplets of Quark-Gluon Plasma are formed during a first-order phase transition, the scaled variance of the multiplicity could increase by a factor of 10-100 [12].
Experimentally, a search for critical behavior is facili-tated by the rich and varied dataset provided by RHIC. It is expected that the trajectory of the colliding sys-tem in the QCD phase diagram can be modified by vary-ing the collidvary-ing energy [2]. If the system approaches close enough to the critical line for a long enough time period, then critical phenomena could be readily appar-ent through the measuremappar-ent of multiplicity fluctuations [13]. It may also be possible to determine the critical exponents of the system. Nature tends to group ma-terials into universality classes whereby all mama-terials in
the same universality class share identical values for their set of critical exponents. Although beyond the scope of this analysis, observation of critical behavior in heavy ion collisions and the subsequent measurement of the critical exponents could determine the universality class in which QCD is grouped, providing essential constraints for the models.
Charged particle multiplicity fluctuations have been measured in elementary collisions over a large range of collisions energies [14, 15, 16, 17, 18, 19, 20]. Initial mea-surements of multiplicity fluctuations in minimum-bias O+Cu collisions at √sNN=4.86 GeV were made by BNL Experiment E802 [21], minimum-bias O+Au collisions at √sNN=17.3 GeV by CERN Experiment WA80 [23] and minimum-bias S+S, O+Au, and S+Au collisions at √s
NN=17.3 GeV by CERN Experiment NA35 [22]. Re-cently, larger datasets have enabled the measurement of the centrality-dependence of multiplicity fluctuations in Pb+Pb collisions at√sNN=17.3 GeV by CERN Exper-iment WA98 [24] and in Pb+Pb, C+C, and Si+Si col-lisions at√sNN=17.3 GeV by CERN Experiment NA49 [25]. The PHENIX Experiment at RHIC has performed an analysis of density correlations in longitudinal space with a differential analysis of charged particle multiplic-ity fluctuations in 200 GeV Au+Au collisions over the entire transverse momentum range [26]. Thus far, the fluctuation measurements in heavy ion collisions do not indicate significant signs of a phase transition. However, the full range of collision energies and species accessible by RHIC are yet to be explored.
Presented here is a comprehensive survey of multi-plicity fluctuations of charged hadrons measured by the PHENIX Experiment at RHIC. The survey will cover the following collision systems:√sNN=200 GeV Au+Au, 62.4 GeV Au+Au, 200 GeV Cu+Cu, 62.4 GeV Cu+Cu, and 22.5 GeV Cu+Cu with comparisons to√s=200 GeV p+p collisions, which serve as a baseline measurement. The Au+Au data were taken during RHIC Run-4 (2004), the Cu+Cu data were taken during RHIC Run-5 (2005), and the p+p data were taken during RHIC Run-3 (2003). Multiplicity fluctuations for each collision system with the exception of p+p will also be presented as a function of centrality to help select the system volume. Multiplic-ity fluctuations will also be presented as a function of transverse momentum range, and charge sign.
This paper is organized as follows: Sec. II will discuss the experimental apparatus and details; Sec. III will dis-cuss the methods applied for the measurement of mul-tiplicity fluctuations and the removal of non-dynamical fluctuations due to fluctuations of the collision geometry within a centrality bin; Sec. IV will present the results and compare them to other models. Sec. V will present a discussion and summary of the results.
II. EXPERIMENTAL SETUP
The PHENIX detector consists of two central spec-trometer arms designed for charged particle tracking, designated east and west, and two muon spectrometers designed for muon tracking and identification, designated north and south. The muon spectrometers are not used in this analysis. A comprehensive description of the PHENIX detector is documented elsewhere [27]. The analysis described here utilizes the central spectrometer arms, which consist of a set of tracking detectors [28], particle identification detectors [29], and an electromag-netic calorimeter [30]. The central spectrometer arms cover a rapidity range of |η| < 0.35 and each arm sub-tends 90 degrees in azimuth. A detailed description of the algorithms and performance of the central arm track re-construction and momentum rere-construction can be found in [31].
There are two detectors that are used for triggering, centrality determination, and event vertex determina-tion. The Beam-Beam Counters (BBCs) consist of 64 individual quartz Cherenkov counters that cover the full azimuthal angle in the pseudorapidity range 3.0 < |η| < 3.9. The Zero Degree Calorimeters (ZDCs) cover the pseudorapidity range |η| > 6 and measure the energy of spectator neutrons with an energy resolution of approx-imately 20%. More details about these detectors can be found in [32]. The collision vertex position is determined using timing information from the BBCs with an r.m.s. resolution for central Au+Au events of 6 mm along the beam axis. The collision vertex is required to be recon-structed within ±30 cm from the center of the spectrom-eter. The BBCs also provide a minimum biased (MB) event trigger.
Due to the large dynamic range in √sNN covered by this analysis, it is necessary to implement algorithms that are dependent on the collision energy for the determina-tion of the centrality of each event. In Au+Au collisions at √sNN=200 GeV, the centrality of the collision is deter-mined by using correlations of the total energy deposited in the ZDCs with the total charge deposited in the BBCs as described in [33]. However, in 200 GeV Cu+Cu, 62.4 GeV Cu+Cu, and 62.4 GeV Au+Au collisions, the re-solving power of the ZDCs is insufficient to significantly contribute to the centrality definition. Therefore, only the total charge deposited in the BBCs is used to deter-mine centrality in these collision systems, as described in [33]. Using the 200 GeV Au+Au data, it has been veri-fied that application of the BBC-ZDC correlation for the centrality definition as opposed to the BBC-only defini-tion shows no significant differences in the values of the charged hadron fluctuation quantities presented here as a function of centrality.
The location of the BBCs are fixed for every collision energy. At the lowest collision energy (√sNN=22.5 GeV), it becomes kinematically possible for spectator nucleons to fall within the acceptance of the BBC. This results in a BBC response in its total charge sum that is no
longer linear with the number of participating nucleons (Npart). In this case, it becomes necessary to define the centrality using the total charged particle multiplicity in Pad Chamber 1 (PC1) [28]. PC1 is chosen due to its fine segmentation, high tracking efficiency, and relative proximity to the event vertex. Details on this procedure are also described in [33]. For all collision species and energies, the distribution of the number of participants was determined using a Monte Carlo simulation based upon the Glauber model [33, 34].
The number of minimum bias events analyzed for each dataset are 25.6 million events for 200 GeV Au+Au, 24.9 million events for 62.4 GeV Au+Au, 15.0 million events for 200 GeV Cu+Cu, 12.2 million events for 62.4 GeV Cu+Cu, 5.5 million events for 22.5 GeV Cu+Cu, and 2.7 million events for 200 GeV p+p. Only a fraction of the complete 200 GeV Au+Au, Cu+Cu, and p+p datasets are analyzed, but this fraction is more than sufficient for this analysis.
The charged particle multiplicity is determined on an event-by-event basis by counting the number of unam-biguous reconstructed tracks in the Drift Chamber origi-nating from the collision vertex that have corresponding hits in Pad Chamber 1 and Pad Chamber 3. Track se-lection includes cuts on reconstructed tracks in the Drift Chamber to reduce double-counted ghost tracks to a neg-ligible level. In order to minimize background originat-ing from the magnets, reconstructed tracks are required to lie within ±75 cm from the center of the Drift Cham-ber along the beam axis. This requirement reduces the pseudorapidity range of reconstructed tracks to |η| <0.26. The Ring Imaging Cherenkov detector (RICH) is utilized to reduce background from electrons resulting from pho-ton conversions.
Although the central arm spectrometer covers a to-tal azimuthal range of π radians, detector and tracking inefficiencies reduce the effective average azimuthal ac-tive area to 2.1 radians for the 200 Gev Au+Au and 200 GeV p+p datasets, and 2.0 radians for the other datasets. Fluctuation quantities are quoted for these acceptances separately for each dataset. The differences in accep-tance between datasets, which are due to variations in the detector over the three year period in which the data was collected, result in less than a 1% variation in the fluctuation quantities quoted here.
III. DATA ANALYSIS
Multiplicity fluctuations of charged particles, desig-nated ωch, can be generally defined [35] as follows:
ωch= (hN 2 chi − hNchi2) hNchi =σ 2 ch µch , (5)
where Nch is the charged particle multiplicity. Simply stated, the fluctuations can be quoted as the variance of the multiplicity (σ2
ch) normalized by the mean (µch= hNchi). This is also referred to as the scaled variance [25].
If the multiplicity distribution is Poissonian, the scaled variance is 1.0.
It has been well established that charged particle mul-tiplicity distributions in elementary nucleon-nucleon col-lisions can be described by the Negative Binomial Distri-bution (NBD) [17, 18, 19]. The NBD also well describes multiplicity distributions in heavy ion collisions [21, 22]. The Negative Binomial Distribution of an integer n is defined as follows: P (n) = Γ(n + kNBD) Γ(n + 1)Γ(kNBD) (µch/kNBD)n (1 + µch/kNBD)n+kNBD , (6) where P (n) is normalized to 1.0 over the range 0 ≤ n ≤ ∞, µch = hNchi = hni, and kNBD is an additional pa-rameter. The NBD reduces to a Poisson distribution in the limit kNBD → ∞. The NBD variance and mean is related to kNBD as follows: σ2 ch µ2 ch = ωch µch = 1 µch + 1 kNBD . (7)
Hence, the scaled variance is given by ωch= 1 +
µch kNBD
. (8)
A useful property of the Negative Binomial Distribu-tion concerns its behavior when a populaDistribu-tion that fol-lows the NBD is subdivided randomly by repeated inde-pendent trials with a constant probability onto smaller subsets. This results in a binomial decomposition of the original population into subsets that also follow the NBD with the same value of kNBD [21]. This property can be applied to estimate the behavior of multiplicity fluctu-ations as a function of acceptance, assuming that there are no significant correlations present over the acceptance range being examined. Starting with an original NBD sample with mean µch and scaled variance ωch, a sam-ple in a fractional acceptance with mean µaccis also de-scribed by an NBD distribution. An acceptance fraction can be defined as facc = µacc/µch. The scaled variance of the subsample from Equation (8) is thus
ωacc= 1 + (µacc/kNBD) = 1 + (faccµch/kNBD). (9) Since kNBD is identical for the two samples, µch/kNBD= ωch−1 can be substituted, yielding the following relation between the scaled variances of the original and fractional acceptance samples:
ωacc= 1 + facc(ωch− 1) (10) Thus, the measured scaled variance will decrease as the acceptance is decreased while kNBD remains constant, if there are no additional correlations present over the given acceptance range.
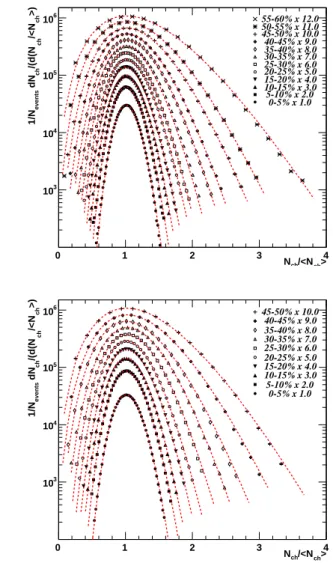
Figures 1-2 show the uncorrected, or raw, multiplicity distributions in the pT range 0.2 < pT < 2.0 GeV for all centralities from each collision system overlayed with fits to Negative Binomial Distributions (dashed lines). For
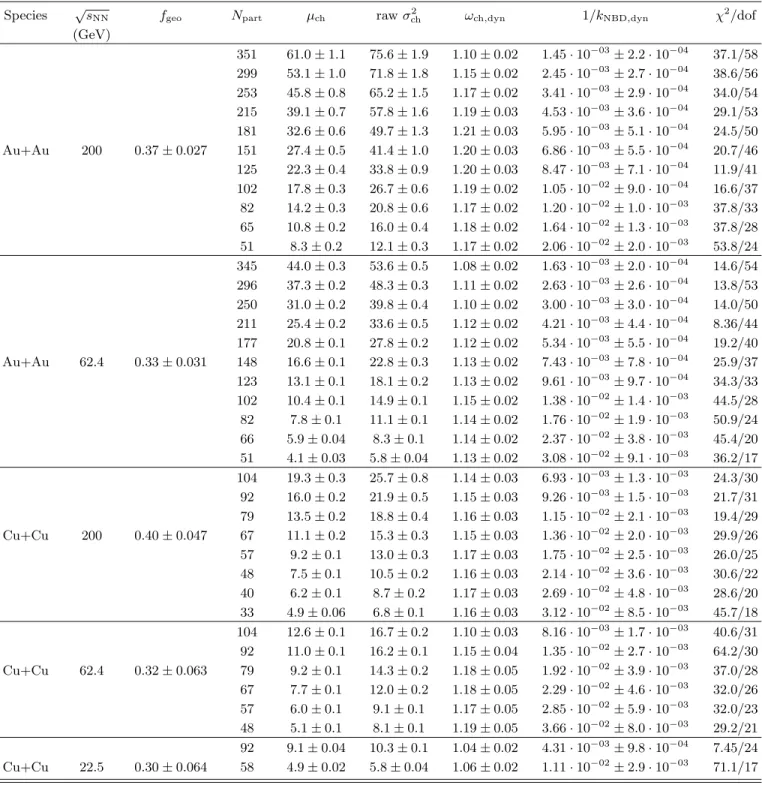
presentation purposes, the data have been normalized on the horizontal axis by the mean of the distribution and scaled on the vertical axis by the successive amounts stated in the legend. The NBD fits describe the data distributions very well for all collision systems, centrali-ties, and pT ranges. Hence, the mean and variance of the multiplicity distributions presented here are all extracted from NBD fits. The results of each fit for 0.2 < pT < 2.0 GeV are compiled in Table I. The mean and standard deviation of each fit for 0.2 < pT < 2.0 GeV are plotted in Fig. 3.
Each dataset was taken over spans of several days to several weeks, all spanning three separate RHIC run-ning periods. During these periods, changes in the total acceptance and efficiency of the central arm spectrom-eters cause the fluctuation measurements to vary, thus introducing an additional systematic error to the results. This systematic error was minimized by requiring that the dataset is stable in quantities that are sensitive to detector variations, including the mean charged parti-cle multiplicity, mean collision vertex position, and mean centrality. A time-dependent systematic error is applied independently to each point by calculating the standard deviation of the scaled variance calculated from subsets of the entire dataset, with each subset containing about 1 million events. These systematic errors are applied to all subsequent results.
The tracking efficiency of the PHENIX central arm spectrometer is dependent on centrality, especially in the most central 200 GeV Au+Au collisions [36]. With the assumption that tracking inefficiencies randomly effect the multiplicity distribution on an event-by-event basis, the effect of inefficiencies on the scaled variance can be estimated using Equation (10) where facc is replaced by the inverse of the tracking efficiency, 1/feff. Tracking effi-ciency effects the value of the scaled variance by 1.5% at the most. The scaled variance has been corrected for tracking inefficiency as a function of centrality for all species. The uncertainty of the tracking efficiency es-timate is typically 2% and has been propagated into the systematic error estimate on a point-by-point basis.
Due to the non-zero width of the centrality bin selec-tion from the data, each centrality bin necessarily se-lects a range of impact parameters. This introduces a non-dynamical fluctuation component to the measured multiplicity fluctuations due to the resulting fluctuations in the geometry of the collisions [26, 37]. Therefore, it is necessary to estimate the magnitude of the geometry fluc-tuation component so that only the interesting dynami-cal fluctuations remain. The most practidynami-cal method for estimating the geometry fluctuation component is with a model of heavy ion collisions. The URQMD [39] and HSD [40, 41] models have previously been applied for this purpose. Here, the HIJING event generator [38] is cho-sen for this estimate because it well reproduces the mean multiplicity in heavy ion collisions [33] as measured by the PHENIX detector. HIJING includes multiple mini-jet production based upon QCD-inspired models, soft
ex-citation, nuclear shadowing of parton distribution func-tions, and the interaction of jets in dense nuclear matter. The estimate is performed individually for each central-ity bin, collision system, and pT range using the following procedure. First, HIJING is run with an impact param-eter distribution that is sampled from a Gaussian distri-bution with a mean and standard deviation that, for a given centrality bin, reproduces the distributions of the charge deposited in the BBC and the energy deposited in the ZDC (for 200 GeV Au+Au). Second, HIJING is run at a fixed impact parameter with a value identical to the mean of the Gaussian distribution in the first run. For each centrality bin, 12,000 HIJING events are processed for each impact parameter selection. The scaled variance for each impact parameter selection, ωGaussand ωfixed, is extracted and the measured scaled variance is corrected
> ch /<N ch N 0 1 2 3 4 >) ch /<N ch /(d(N ch dN events 1/N 3 10 4 10 5 10 6 10 55-60% x 12.0 50-55% x 11.0 45-50% x 10.0 40-45% x 9.0 35-40% x 8.0 30-35% x 7.0 25-30% x 6.0 20-25% x 5.0 15-20% x 4.0 10-15% x 3.0 5-10% x 2.0 0-5% x 1.0 > ch /<N ch N 0 1 2 3 4 >) ch /<N ch /(d(N ch dN events 1/N 3 10 4 10 5 10 6 10 45-50% x 10.0 40-45% x 9.0 35-40% x 8.0 30-35% x 7.0 25-30% x 6.0 20-25% x 5.0 15-20% x 4.0 10-15% x 3.0 5-10% x 2.0 0-5% x 1.0
FIG. 1: The uncorrected multiplicity distributions of charged hadrons with 0.2 < pT < 2.0 GeV/c for 200 (upper) and 62.4
(lower) GeV Au+Au collisions. The dashed lines are fits to the Negative Binomial Distribution. The data are normalized to the mean and scaled by the amounts in the legend.
> ch /<N ch N 0 1 2 3 4 >) ch /<N ch /(d(N ch dN events 1/N 3 10 4 10 5 10 30-35% x 7.0 25-30% x 6.0 20-25% x 5.0 15-20% x 4.0 10-15% x 3.0 5-10% x 2.0 0-5% x 1.0 > ch /<N ch N 0 1 2 3 4 >) ch /<N ch /(d(N ch dN events 1/N 3 10 4 10 5 10 20-25% x 5.0 15-20% x 4.0 10-15% x 3.0 5-10% x 2.0 0-5% x 1.0 > ch /<N ch N 0 5 10 15 20 >) ch /<N ch /(d(N ch dN events 1/N 3 10 4 10 5 10 22.5 GeV Cu+Cu, 10-20% x 2.0 22.5 GeV Cu+Cu, 0-10% x 1.0 200 GeV p+p, Min. Bias. x 0.1
FIG. 2: The uncorrected multiplicity distributions of charged hadrons with 0.2 < pT < 2.0 GeV/c for 200 (upper), 62.4
(middle), and 22.5 (lower) GeV Cu+Cu and 200 GeV p+p (lower) collisions. The dashed lines are fits to the Negative Binomial Distribution. The data are normalized to the mean and scaled by the amounts in the legend.
TABLE I: Tabulation of the charged hadron multiplicity data and corrections for 0.2 < pT < 2.0 GeV/c. The errors quoted for
µchand σchrepresent their time-dependent systematic error. The errors quoted for ωch,dynand 1/kNBD,dynrepresent their total
systematic error. For each dataset the first three columns give the species, collision energy, and geometric correction factor, fgeo, respectively.
Species √sNN fgeo Npart µch raw σch2 ωch,dyn 1/kNBD,dyn χ2/dof
(GeV) 351 61.0 ± 1.1 75.6 ± 1.9 1.10 ± 0.02 1.45 · 10−03 ± 2.2 · 10−04 37.1/58 299 53.1 ± 1.0 71.8 ± 1.8 1.15 ± 0.02 2.45 · 10−03 ± 2.7 · 10−04 38.6/56 253 45.8 ± 0.8 65.2 ± 1.5 1.17 ± 0.02 3.41 · 10−03 ± 2.9 · 10−04 34.0/54 215 39.1 ± 0.7 57.8 ± 1.6 1.19 ± 0.03 4.53 · 10−03 ± 3.6 · 10−04 29.1/53 181 32.6 ± 0.6 49.7 ± 1.3 1.21 ± 0.03 5.95 · 10−03 ± 5.1 · 10−04 24.5/50 Au+Au 200 0.37 ± 0.027 151 27.4 ± 0.5 41.4 ± 1.0 1.20 ± 0.03 6.86 · 10−03 ± 5.5 · 10−04 20.7/46 125 22.3 ± 0.4 33.8 ± 0.9 1.20 ± 0.03 8.47 · 10−03 ± 7.1 · 10−04 11.9/41 102 17.8 ± 0.3 26.7 ± 0.6 1.19 ± 0.02 1.05 · 10−02 ± 9.0 · 10−04 16.6/37 82 14.2 ± 0.3 20.8 ± 0.6 1.17 ± 0.02 1.20 · 10−02 ± 1.0 · 10−03 37.8/33 65 10.8 ± 0.2 16.0 ± 0.4 1.18 ± 0.02 1.64 · 10−02 ± 1.3 · 10−03 37.8/28 51 8.3 ± 0.2 12.1 ± 0.3 1.17 ± 0.02 2.06 · 10−02 ± 2.0 · 10−03 53.8/24 345 44.0 ± 0.3 53.6 ± 0.5 1.08 ± 0.02 1.63 · 10−03 ± 2.0 · 10−04 14.6/54 296 37.3 ± 0.2 48.3 ± 0.3 1.11 ± 0.02 2.63 · 10−03 ± 2.6 · 10−04 13.8/53 250 31.0 ± 0.2 39.8 ± 0.4 1.10 ± 0.02 3.00 · 10−03 ± 3.0 · 10−04 14.0/50 211 25.4 ± 0.2 33.6 ± 0.5 1.12 ± 0.02 4.21 · 10−03 ± 4.4 · 10−04 8.36/44 177 20.8 ± 0.1 27.8 ± 0.2 1.12 ± 0.02 5.34 · 10−03 ± 5.5 · 10−04 19.2/40 Au+Au 62.4 0.33 ± 0.031 148 16.6 ± 0.1 22.8 ± 0.3 1.13 ± 0.02 7.43 · 10−03 ± 7.8 · 10−04 25.9/37 123 13.1 ± 0.1 18.1 ± 0.2 1.13 ± 0.02 9.61 · 10−03 ± 9.7 · 10−04 34.3/33 102 10.4 ± 0.1 14.9 ± 0.1 1.15 ± 0.02 1.38 · 10−02 ± 1.4 · 10−03 44.5/28 82 7.8 ± 0.1 11.1 ± 0.1 1.14 ± 0.02 1.76 · 10−02 ± 1.9 · 10−03 50.9/24 66 5.9 ± 0.04 8.3 ± 0.1 1.14 ± 0.02 2.37 · 10−02 ± 3.8 · 10−03 45.4/20 51 4.1 ± 0.03 5.8 ± 0.04 1.13 ± 0.02 3.08 · 10−02 ± 9.1 · 10−03 36.2/17 104 19.3 ± 0.3 25.7 ± 0.8 1.14 ± 0.03 6.93 · 10−03 ± 1.3 · 10−03 24.3/30 92 16.0 ± 0.2 21.9 ± 0.5 1.15 ± 0.03 9.26 · 10−03 ± 1.5 · 10−03 21.7/31 79 13.5 ± 0.2 18.8 ± 0.4 1.16 ± 0.03 1.15 · 10−02 ± 2.1 · 10−03 19.4/29 Cu+Cu 200 0.40 ± 0.047 67 11.1 ± 0.2 15.3 ± 0.3 1.15 ± 0.03 1.36 · 10−02 ± 2.0 · 10−03 29.9/26 57 9.2 ± 0.1 13.0 ± 0.3 1.17 ± 0.03 1.75 · 10−02 ± 2.5 · 10−03 26.0/25 48 7.5 ± 0.1 10.5 ± 0.2 1.16 ± 0.03 2.14 · 10−02 ± 3.6 · 10−03 30.6/22 40 6.2 ± 0.1 8.7 ± 0.2 1.17 ± 0.03 2.69 · 10−02 ± 4.8 · 10−03 28.6/20 33 4.9 ± 0.06 6.8 ± 0.1 1.16 ± 0.03 3.12 · 10−02 ± 8.5 · 10−03 45.7/18 104 12.6 ± 0.1 16.7 ± 0.2 1.10 ± 0.03 8.16 · 10−03 ± 1.7 · 10−03 40.6/31 92 11.0 ± 0.1 16.2 ± 0.1 1.15 ± 0.04 1.35 · 10−02 ± 2.7 · 10−03 64.2/30 Cu+Cu 62.4 0.32 ± 0.063 79 9.2 ± 0.1 14.3 ± 0.2 1.18 ± 0.05 1.92 · 10−02 ± 3.9 · 10−03 37.0/28 67 7.7 ± 0.1 12.0 ± 0.2 1.18 ± 0.05 2.29 · 10−02 ± 4.6 · 10−03 32.0/26 57 6.0 ± 0.1 9.1 ± 0.1 1.17 ± 0.05 2.85 · 10−02 ± 5.9 · 10−03 32.0/23 48 5.1 ± 0.1 8.1 ± 0.1 1.19 ± 0.05 3.66 · 10−02 ± 8.0 · 10−03 29.2/21 92 9.1 ± 0.04 10.3 ± 0.1 1.04 ± 0.02 4.31 · 10−03 ± 9.8 · 10−04 7.45/24 Cu+Cu 22.5 0.30 ± 0.064 58 4.9 ± 0.02 5.8 ± 0.04 1.06 ± 0.02 1.11 · 10−02 ± 2.9 · 10−03 71.1/17
part N 100 200 300 400 ch µ 0 20 40 60 80 200 GeV Au+Au 62.4 GeV Au+Au part N 50 100 ch µ 0 10 20 200 GeV Cu+Cu 62.4 GeV Cu+Cu 22.5 GeV Cu+Cu
FIG. 3: The mean from the NBD fit as a function of Npart
for Au+Au (upper) and Cu+Cu (lower) collisions over the range 0.2 < pT < 2.0 GeV/c. The mean shown is within the
PHENIX central arm spectrometer acceptance. The error bars represent the standard deviation of the distribution.
as the fractional deviation from a scaled variance of 1.0 of a Poisson distribution as follows:
ωch,dyn−1 =
(ωfixed− 1) (ωGauss− 1)
(ωch,raw−1) = fgeo(ωch,raw−1), (11) where ωch,dyn represents the estimate of the remaining dynamical multiplicity fluctuations and ωch,raw repre-sents the uncorrected multiplicity fluctuations. Since the correction, fgeo, is calculated as a ratio of the two run-ning conditions of the simulation, most multiplicity fluc-tuations intrinsic to the model should be canceled. The correction always reduces the magnitude of the measured scaled variance. Note that the value of fgeois
mathemat-ically identical when applied to the inverse of kNBD:
k−1
NBD,dyn= fgeokNBD−1 . (12) The resulting geometrical correction factors for each species are constant as a function of centrality, there-fore a single correction factor is calculated for each trans-verse momentum range by fitting the correction factors as a function of Npart to a constant. This behavior is expected since centrality bins are defined to be con-stant percentages of the total geometric cross section. The correction factors for each transverse momentum range for a given collision species are consistent with each other. The standard deviation of the individual geometrical correction factors from the linear fits as a function of Npart are included in the systematic error of the correction factor estimation and propagated into the total systematic error for each point in ωch,dyn and kNBD,dyn. For 0.2 < pT < 2.0 GeV/c, the geometrical correction factors, fgeo, and systematic errors from the fit are 0.37 ± 0.027 for 200 GeV Au+Au, 0.33 ± 0.031 for 62.4 GeV Au+Au, 0.40 ± 0.047 for 200 GeV Cu+Cu, 0.32 ± 0.063 for 62.4 GeV Cu+Cu, and 0.30 ± 0.064 for 22.5 GeV Cu+Cu. The extraction of the geometrical cor-rection factors are inherently model-dependent and are also dependent on the accuracy with which the central-ity detectors are modelled. The effect of the latter de-pendence has been studied by also calculating the correc-tion factors using constant but non-overlapping impact parameter distributions for each centrality bin and com-paring them to the correction factors using the Gaussian impact parameter distributions. For all pT ranges, an additional fraction of the value of ωch,dyn or kNBD,dyn−1 has been included in the final systematic errors for these quantities. The magnitude of this systematic error is 8% for 200 GeV Au+Au, 8% for 62.4 GeV Au+Au, 11% for 200 GeV Cu+Cu, 17% for 62.4 GeV Cu+Cu, and 25% for 22.5 GeV Cu+Cu. A sample comparison of the scaled variance before and after the application of the geomet-rical correction factor is shown for the 200 GeV Au+Au dataset in Fig. 4.
IV. RESULTS
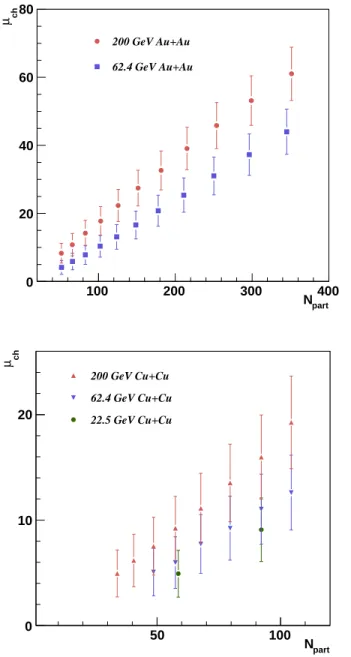
The scaled variance as a function of the number of participating nucleons, Npart, over the pT range 0.2 < pT < 2.0 GeV/c is shown in Fig. 5. For all centrali-ties, the scaled variance values consistently lie above the Poisson distribution value of 1.0. In all collision systems, the minimum scaled variance occurs in the most central collisions and then begins to increase as the centrality decreases. In 200 GeV Au+Au collisions, this increase is only observed for Npart > 200. For Npart < 200 ωch,dyn suggests a slight decrease but is consistent with a con-stant value. In 62.4 GeV Au+Au collisions, the increase in ωch,dynwith decreasing centrality is observed only over the range Npart > 110. The source of the qualitative
part N 100 200 300 400 ch ω 1 1.2 1.4 1.6 ch,raw ω 200 GeV Au+Au, ch,dyn ω 200 GeV Au+Au,
FIG. 4: Fluctuations expressed as the scaled variance as a function of centrality for 200 GeV Au+Au collisions in the range 0.2 < pT < 2.0 GeV/c. Shown are the uncorrected
fluctuations, ωch,raw, along with fluctuations after correcting
for the estimated contribution from geometry fluctuations us-ing Equation 11, ωch,dyn.
differences between the 200 and 62.4 GeV Au+Au col-lisions is not known, although some of the differences could be explained by the increased contribution from hard scattering processes at 200 GeV compared to 62.4 GeV. Studies performed by varying the centrality selec-tion cuts establish that the differences are not due to the differences in the centrality selection algorithm. A similar centrality-dependent trend of the scaled variance has also been observed at the SPS in low energy Pb+Pb collisions at √sNN=17.3 GeV and at forward rapidities (1.1< yc.m. <2.6), measured by experiment NA49 [25], where the hard scattering contribution is expected to be small. The Cu+Cu data exhibit a weaker decrease in the scaled variance for more central collisions. The 62.4 GeV Cu+Cu scaled variance values are consistently above those from the 200 GeV Cu+Cu dataset, but the two are consistent within the systematic errors for all centralities.
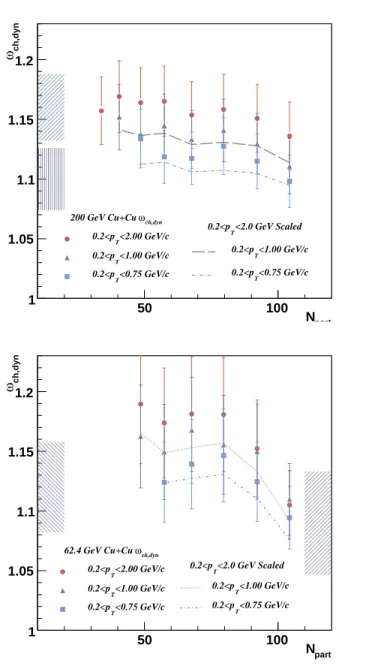
The scaled variance has been studied as a function of the pT range over which the multiplicity distributions are measured in order to determine if any significant pT -dependent dynamical fluctuations are present. Results for several pT ranges from 0.2 < pT < 2.0 GeV/c down to 0.2 < pT < 0.5 GeV/c are shown in Figs. 6-7. In the absence of pT-dependent dynamical fluctuations, restrict-ing the pT range should reduce the scaled variance in the same manner as for a fractional acceptance. Similar to Equation (10):
ωpT= 1 + fpt(ωref− 1), (13) where ωpT represents the fluctuations in the pT range of
interest, ωref represents the fluctuations in the reference pT range, and fpT = µpT/µref is the ratio of the mean multiplicity in the two ranges. Also shown are curves rep-resenting the expected scaling of the fluctuations using the range 0.2 < pT < 2.0 GeV/c as the reference range. The shaded regions reflect the systematic errors of the
part N 100 200 300 400 ch,dyn ω 1 1.1 1.2 200 GeV Au+Au 62.4 GeV Au+Au
Superposition Model, 200 GeV Au+Au Superposition Model, 62.4 GeV Au+Au Poisson + flow, 200 GeV Au+Au
part N 40 60 80 100 120 ch,dyn ω 1 1.1 1.2 200 GeV Cu+Cu 62.4 GeV Cu+Cu 22.5 GeV Cu+Cu
Superposition Model, 200 GeV Cu+Cu Superposition Model, 62.4 GeV Cu+Cu Superposition Model, 22.5 GeV Cu+Cu
FIG. 5: Fluctuations expressed as the scaled variance as a function of Npart for Au+Au (upper) and Cu+Cu (lower)
collisions for 0.2 < pT< 2.0 GeV/c. The estimated
contribu-tion from geometry fluctuacontribu-tions has been removed. Results from the superposition model are overlayed with the shaded regions representing a one standard deviation range of the prediction for the fluctuation magnitude derived from p+p collision data. Also shown (upper) is the estimated contribu-tion from non-correlated particle emission with the Poisson distribution of the scaled variance of 1.0 with the addition of elliptic flow in 200 GeV Au+Au collisions.
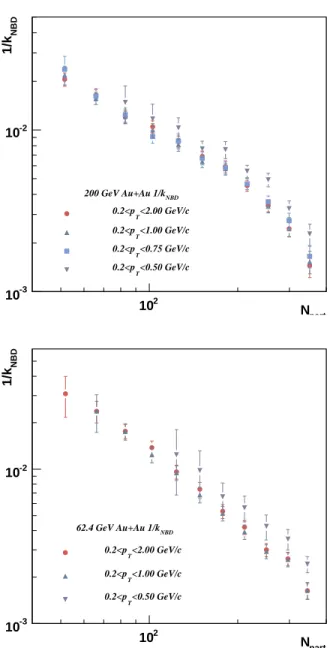
reference range. For all pT ranges, the scaled fluctuation curves are consistent with the data, indicating that no significant pT-dependence is observed, although the data in the range 0.2 < pT < 0.5 GeV are consistently above the scaled reference curves. The pT-dependence can also be examined in more directly with the parameter kNBD from the NBD fits. Substitution of the scaled variance in Equation (8) into Equation (13) shows that kNBDshould be independent of pT in the absence of pT-dependent dy-namical fluctuations. As shown in Figs. 8-9, there is no significant pT-dependence of the observed values of kNBD.
part N 100 200 300 400 ch,dyn ω 1 1.1 1.2 ch,dyn ω 200 GeV Au+Au <2.00 GeV/c T 0.2<p <1.00 GeV/c T 0.2<p <0.75 GeV/c T 0.2<p <0.50 GeV/c T 0.2<p <2.0 GeV Scaled T 0.2<p <1.00 GeV/c T 0.2<p <0.75 GeV/c T 0.2<p <0.50 GeV/c T 0.2<p part N 100 200 300 400 ch,dyn ω 1 1.1 1.2 ch,dyn ω 62.4 GeV Au+Au <2.00 GeV/c T 0.2<p <1.00 GeV/c T 0.2<p <0.50 GeV/c T 0.2<p <2.0 GeV Scaled T 0.2<p <1.00 GeV/c T 0.2<p <0.50 GeV/c T 0.2<p
FIG. 6: Scaled variance for 200 (upper) and 62.4 (lower) GeV Au+Au collisions plotted as a function of Npartfor several pT
ranges. The lines represent the data for the reference range 0.2 < pT < 2.0 scaled down using the mean multiplicity in
each successive pT range. The shaded areas represent the
systematic errors from the reference range.
part N 50 100 ch,dyn ω 1 1.05 1.1 1.15 1.2 ch,dyn ω 200 GeV Cu+Cu <2.00 GeV/c T 0.2<p <1.00 GeV/c T 0.2<p <0.75 GeV/c T 0.2<p <2.0 GeV Scaled T 0.2<p <1.00 GeV/c T 0.2<p <0.75 GeV/c T 0.2<p part N 50 100 ch,dyn ω 1 1.05 1.1 1.15 1.2 ch,dyn ω 62.4 GeV Cu+Cu <2.00 GeV/c T 0.2<p <1.00 GeV/c T 0.2<p <0.75 GeV/c T 0.2<p <2.0 GeV Scaled T 0.2<p <1.00 GeV/c T 0.2<p <0.75 GeV/c T 0.2<p
FIG. 7: Scaled variance for 200 (upper) and 62.4 (lower) GeV Cu+Cu collisions plotted as a function of Npartfor several pT
ranges. The lines represent the data for the reference range 0.2 < pT < 2.0 scaled down using the mean multiplicity in
each successive pT range. The shaded areas represent the
systematic errors from the reference range.
The scaled variance as a function of the charge sign of the charged hadrons is shown in Fig. 10 for 200 GeV Au+Au collisions in the pT range 0.2 < pT < 2.0 GeV/c in order to investigate any Coulomb-based contributions to the fluctuations. In the absence of additional dynamic fluctuations, the scaled variance for positively or nega-tively charged hadrons should be reduced from the inclu-sive charged hadron value by
ω+−= 1 + f+−(ωch− 1), (14) where ω+− are the fluctuations for positive or negative
part N 2 10 NBD 1/k -3 10 -2 10 NBD 200 GeV Au+Au 1/k <2.00 GeV/c T 0.2<p <1.00 GeV/c T 0.2<p <0.75 GeV/c T 0.2<p <0.50 GeV/c T 0.2<p part N 2 10 NBD 1/k -3 10 -2 10 NBD 62.4 GeV Au+Au 1/k <2.00 GeV/c T 0.2<p <1.00 GeV/c T 0.2<p <0.50 GeV/c T 0.2<p
FIG. 8: The inverse of the parameter kNBDfrom the Negative
Binomial Distribution fits for 200 (upper) and 62.4 (lower) GeV Au+Au collisions. The fluctuations are plotted as a function of Npartfor several pT ranges.
particles, ωch are the fluctuations for inclusive charged hadrons, and f+− = µ+−/µch is the ratio of the mean multiplicities. The scaled variance from the positive and negative hadrons are consistent with each other and consistent with the expected reduction of the inclusive charged hadron fluctuations.
An additional non-dynamic contribution to multiplic-ity fluctuations arises from the presence of elliptic flow. This contribution has been estimated using a simple Monte Carlo simulation. In this simulation, a random reaction plane angle is assigned to each event. The mul-tiplicity distribution due to the elliptic flow component
part N 2 10 NBD 1/k -2 10 NBD 200 GeV Cu+Cu 1/k <2.00 GeV/c T 0.2<p <1.00 GeV/c T 0.2<p <0.75 GeV/c T 0.2<p part N 2 10 NBD 1/k -2 10 62.4 GeV Cu+Cu 1/kNBD <2.00 GeV/c T 0.2<p <1.00 GeV/c T 0.2<p <0.75 GeV/c T 0.2<p
FIG. 9: The inverse of the parameter kNBDfrom the Negative
Binomial Distribution fits for 200 (upper) and 62.4 (lower) GeV Cu+Cu collisions. The fluctuations are plotted as a function of Npart for several pT ranges.
is given by the following:
dN/dφ = C[1 + 2 v2 cos(2∆φ)], (15)
where C is a normalization factor, v2 is the measured magnitude of the elliptic flow, and ∆φ is the difference between the particle emission angle and the reaction plane angle. For each event, this multiplicity distribu-tion funcdistribu-tion is integrated over the PHENIX azimuthal acceptance and the resulting scaled variance from one million events is calculated. The value of v2 used in the simulation is taken from PHENIX measurements of ellip-tic flow at the mean transverse momentum of the inclu-sive charged hadron spectra in the range 0.2 < pT < 2.0
GeV/c within the central arm spectrometers [45]. The estimated contribution from elliptic flow to the observed scaled variance is less than 0.038% for all centralities and is shown for 200 GeV Au+Au collisions in Fig. 5.
part N 100 200 300 400 ch,dyn ω 1 1.1 1.2
200 GeV Au+Au, inclusive charge 200 GeV Au+Au, positive charge 200 GeV Au+Au, negative charge
=0.5
+-inclusive charge, f
FIG. 10: The scaled variance as a function of Npart for 200
GeV Au+Au collisions in the range 0.2 < pT < 2.0 GeV/c.
Shown are measurements for inclusive charged particles, pos-itive particles, and negative particles. The line represents the inclusive data scaled down in acceptance by 50% with the shaded area representing the systematic error.
V. DISCUSSION
A. Comparisons to a participant superposition model
It is informative to compare fluctuations in relativistic heavy ion collisions to what can be expected from the superposition of individual participant nucleon-nucleon collisions. For this purpose, PHENIX data will be com-pared to a participant superposition, or wounded nu-cleon, model [42] based upon data from elementary col-lisions. In the participant superposition model, the total multiplicity fluctuations can be expressed in terms of the scaled variance [35],
ωN= ων+ µWN ωNpart, (16) where ων are the fluctuations from each individual source, e.g. from each elementary collision, ωNpart are the fluctuations of the number of sources, and µWN is the mean multiplicity per wounded nucleon. The second term includes non-dynamic contributions from geometry fluctuations due to the width of the centrality bin along with additional fluctuations in the number of participants for a fixed impact parameter. Ideally, the second term is
nearly nullified after applying the geometry corrections described previously, so the resulting fluctuations are in-dependent of centrality as well as collision species.
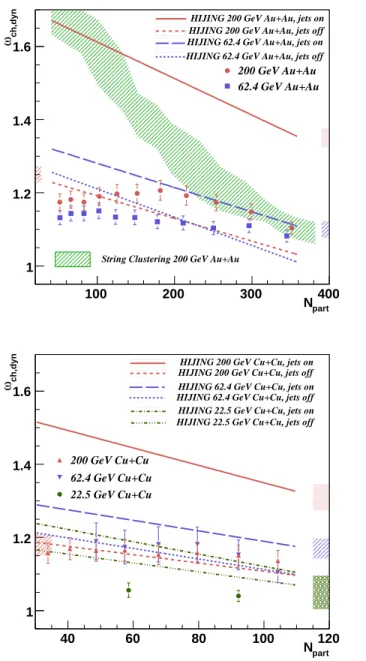
part N 100 200 300 400 ch,dyn ω 1 1.2 1.4 1.6 200 GeV Au+Au 62.4 GeV Au+Au HIJING 200 GeV Au+Au, jets on HIJING 200 GeV Au+Au, jets off HIJING 62.4 GeV Au+Au, jets on HIJING 62.4 GeV Au+Au, jets off
String Clustering 200 GeV Au+Au
part N 40 60 80 100 120 ch,dyn ω 1 1.2 1.4 1.6 200 GeV Cu+Cu 62.4 GeV Cu+Cu 22.5 GeV Cu+Cu
HIJING 200 GeV Cu+Cu, jets on HIJING 200 GeV Cu+Cu, jets off HIJING 62.4 GeV Cu+Cu, jets on HIJING 62.4 GeV Cu+Cu, jets off HIJING 22.5 GeV Cu+Cu, jets on HIJING 22.5 GeV Cu+Cu, jets off
FIG. 11: Fluctuations expressed as the scaled variance as a function of Npartfor Au+Au (upper) and Cu+Cu (lower)
col-lisions for 0.2 < pT < 2.0 GeV/c. The estimated contribution
from geometry fluctuations has been removed. Results from the HIJING model with jets turned on and jets turned off are overlayed with the shaded regions representing the systematic error for each curve.
Baseline comparisons are facilitated by PHENIX mea-surements of charged particle multiplicity fluctuations in minimum bias 200 GeV p+p collisions. The p+p data and the NBD distribution to the multiplicity distribu-tion are shown in Fig. 2. The NBD fit yields µch = 0.32 ± 0.003, ωch= 1.17 ± 0.01, and kNBD = 1.88 ± 0.01.
These results are in agreement within errors with previ-ous measurements in the same pseudorapidity range of kNBD= 1.9 ± 0.2 ± 0.2 by the UA5 Collaboration [20] in collision of protons and antiprotons at 200 GeV. Compar-isons of the participant superposition model to the 22.5 GeV Cu+Cu data can be made to multiplicity fluctua-tions measured in 20 GeV p+p collisions by the NA22 Collaboration [19] over the same pseudorapidity range as the PHENIX Cu+Cu measurement. After scaling the NA22 scaled variance to the PHENIX azimuthal accep-tance, the participant superposition model scaled vari-ance is expected to be constant as a function of centrality with a value of 1.08 ±0.04. Lacking multiplicity distribu-tion data from elementary collisions at 62.4 GeV within the PHENIX pseudorapidity acceptance, it is assumed that as a function of collision energy, the scaled variance in the PHENIX pseudorapidity acceptance scales in the same manner as in an acceptance of 4π, which can be parametrized from existing p+p and p+¯p data as follows [17]:
µch≈ −4.2 + 4.69( s GeV2)
0.155. (17)
Given the mean charged particle multiplicity, the scaled variance in p+p and p+¯p can be parametrized as follows [35]:
ωch≈ 0.35
(µch− 1)2 µch
. (18)
Scaling this parametrization to match the values of ωch at 200 GeV and 22.5 GeV, the estimated value of ωchat 62.4 GeV is 1.15 ± 0.02.
Comparisons of the data to the predictions of the par-ticipant superposition model are shown in Fig. 5 for Au+Au and Cu+Cu collisions. The shaded regions about the participant superposition model lines represent the systematic error of the estimates described above. All of the data points are consistent with or below the partic-ipant superposition model estimate. This suggests that the data do not show any indications of the presence of a critical point, where the fluctuations are expected to be much larger than the participant superposition model expectation.
B. Comparisons to the HIJING model
Shown in Fig. 11 are the scaled variance curves from HIJING simulations into the PHENIX acceptance. The HIJING simulations are performed with a fixed impact parameter corresponding to the mean of the impact pa-rameter distribution for each bin as determined by the Glauber model in order to minimize the geometry fluc-tuation component of the result. The mean and variance of the resulting multiplicity distributions from HIJING are extracted from fits to Negative Binomial Distribu-tions. The HIJING simulation multiplicity fluctuations
with the jet production parameter turned on are consis-tently above the data and increase continuously through the most peripheral collisions. This behavior is not con-sistent with the data, where the fluctuations do not in-crease in the most peripheral collisions. Although HI-JING reproduces the total charged particle multiplicity well, it consistently overpredicts the amount of fluctua-tions in multiplicity. When the jet production parameter in HIJING is turned off, the scaled variance as a func-tion of centrality is independent of collision energy, illus-trating that jet production accounts for the energy de-pendence of the HIJING results. Note that the HIJING results with jet production turned off are in better agree-ment with the data for all collision energies. Together with the observation that the multiplicity fluctuations demonstrate no significant pT-dependence, this may be an indication that correlated emission of particles from jet production do not significantly contribute to the mul-tiplicity fluctuations observed in the data.
C. Comparisons to the clan model
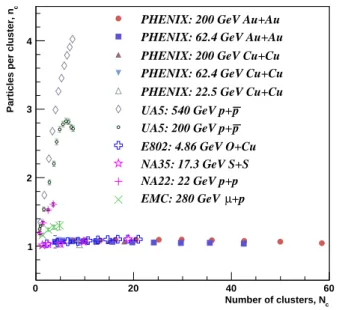
The clan model [46] has been developed to interpret the fact that Negative Binomial Distributions describe charged hadron multiplicity distributions in elementary and heavy ion collisions. In this model, hadron produc-tion is modeled as independent emission of a number of hadronic clusters, Nc, each with a mean number of hadrons, nc. The independent emission is described by a Poisson distribution with an average cluster, or clan, mul-tiplicity of ¯Nc. After the clusters are emitted, they frag-ment into the final state hadrons. The measured value of the mean multiplicity, µch, is related to the cluster multiplicities by µch= ¯Ncn¯c. In this model, the cluster multiplicity parameters can be simply related to the NBD parameters of the measured multiplicity distribution as follows: ¯ Nc= kNBD log(1 + µch/kNBD) (19) and ¯ nc= (µch/kNBD)/log(1 + µch/kNBD). (20)
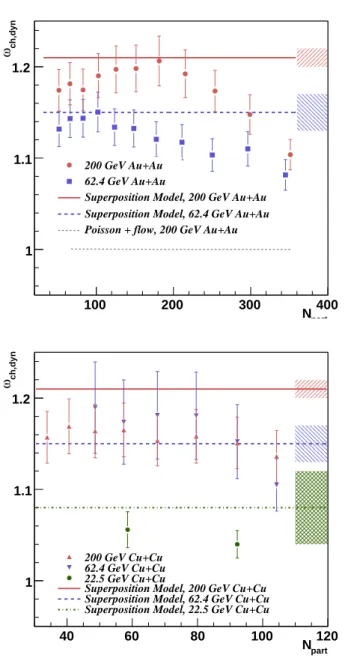
The results from the NBD fits to the data are plot-ted in Fig. 12 for all collision species. Also shown are data from elementary and heavy ion collisions at various collision energies. The individual data points from all but the PHENIX data are taken from multiplicity distri-butions measured over varying ranges of pseudorapidity, while the PHENIX data are taken as a function of cen-trality. The characteristics of all of the heavy ion data sets are the same. The value of ¯nc varies little within the range 1.0-1.1. The heavy ion data universally ex-hibit only weak clustering characteristics as interpreted by the clan model. There is also no significant variation
seen with collision energy. However, ¯nc is consistently significantly higher in elementary collisions. In elemen-tary collisions, it is less probable to produce events with a high multiplicity, which can reveal rare sources of clusters such as jet production or multiple parton interactions.
c Number of clusters, N
0 20 40 60
c
Particles per cluster, n
1 2 3 4
PHENIX: 200 GeV Au+Au PHENIX: 62.4 GeV Au+Au PHENIX: 200 GeV Cu+Cu PHENIX: 62.4 GeV Cu+Cu PHENIX: 22.5 GeV Cu+Cu
p UA5: 540 GeV p+
p UA5: 200 GeV p+ E802: 4.86 GeV O+Cu NA35: 17.3 GeV S+S NA22: 22 GeV p+p
+p
µ
EMC: 280 GeV
FIG. 12: The correlation of the clan model parameters ¯nc
and ¯Ncfor all of the collision species measured as a function
of centrality. Also shown are results from pseudorapidity-dependent studies from elementary collisions (UA5 [17], EMC [18], and NA22 [19]) and heavy ion collisions (E802 [21] and NA35 [22]).
A feature that is especially apparent in the Au+Au data is the fact that the scaled variance decreases with increasing centrality, with the most central point lying below the participant superposition model expectatation. The clan model provides one possible explanation for this effect whereby there is a higher probability for con-tributions from cluster sources such as jet production in the lower multiplicity peripheral events. The cluster sources introduce correlations that can increase the value of 1/kNBD and hence the value of the scaled variance of the multiplicity distribution. Another possible explana-tion for this feature can be addressed with a string perco-lation model in heavy ion collisions [43]. In general, per-colation theory considers the formation of clusters within a random spatial distribution of individual objects that are allowed to overlap with each other. The clusters are formed by the geometrical connection of one or more of the individual objects. This can be applied to estimate multiplicity fluctuations in heavy ion collisions whereby the objects are the circular cross sections of strings in the transverse plane [44] and the strings form clusters of overlapping strings that then each emit a number of par-ticles related to the number of strings in each cluster. As the centrality increases, the number of individual clus-ters decreases along with the variance of the number of
strings per cluster, which can result in a decrease in the magnitude of the resulting multiplicity fluctuations. The prediction of the scaled variance from the string percola-tion model for 200 GeV Au+Au collisions scaled down to the PHENIX acceptance in azimuth and pseudorapidity [44] is shown in Fig. 11. Although percolation describes the trend observed at the four highest centralities very well, the scaled variance from the model continues to in-crease well above the data as centrality dein-creases. The implementation of the HIJING model contains merging of strings that are in close spatial proximity, so percola-tion can explain the trends in the scaled variance from HIJING.
VI. SUMMARY
PHENIX has completed a survey of multiplicity fluc-tuations of charged hadrons in Au+Au and Cu+Cu col-lisions at three collision energies. The motivation for the analysis is to search for signs of a phase transition or the presence of the predicted critical point on the QCD phase diagram by looking for increased multiplicity fluctuations as a function of system energy and system volume. After correcting for non-dynamical fluctuations due to fluctu-ations of the collision geometry within a centrality bin, the multiplicity fluctuations in 200 GeV and 62.4 GeV Au+Au collisions are consistent with or below the ex-pectation from the superposition model of participant nucleons. The multiplicity fluctuations decrease as the collision centrality increases, dropping below the partic-ipant superposition model expectation for the most cen-tral Au+Au collisions. Fluctuations from Cu+Cu colli-sions exhibit a weaker centrality-dependence that also is consistent with or below the expectation from the partic-ipant superposition model. The absence of large dynami-cal fluctuations in excess of the participant superposition model expectation indicate that there is no evidence of critical behavior related to the compressibility observable in this dataset. There is also no significant evidence of dynamical fluctuations that are dependent on the trans-verse momentum or the charge of the particles measured. As interpreted by the clan model, the observed fluctu-ations demonstrate only weak clustering characteristics for all of the heavy ion collision systems discussed here. The decreasing scaled variance with increasing central-ity may be explained by percolation phenomena, however this fails to explain the most peripheral Au+Au data. Al-though this analysis does not observe evidence of critical behavior, it does not rule out the existence of a QCD crit-ical point. Further measurements will be possible during the upcoming low energy scan program at RHIC allowing for a more comprehensive search for critical behavior.