HAL Id: hal-00407853
https://hal.archives-ouvertes.fr/hal-00407853
Submitted on 24 Oct 2016
HAL is a multi-disciplinary open access
archive for the deposit and dissemination of
sci-entific research documents, whether they are
pub-lished or not. The documents may come from
teaching and research institutions in France or
abroad, or from public or private research centers.
L’archive ouverte pluridisciplinaire HAL, est
destinée au dépôt et à la diffusion de documents
scientifiques de niveau recherche, publiés ou non,
émanant des établissements d’enseignement et de
recherche français ou étrangers, des laboratoires
publics ou privés.
Upper mantle flow beneath and around the Hangay
Dome, central Mongolia
Guilhem Barruol, Anne Deschamps, Jacques Déverchère, Valentina V.
Mordvinova, Ulziibat Munkhuu, Julie Perrot, A. Artemiev, T. Dugarmaa,
Götz H.R. Bokelmann
To cite this version:
Guilhem Barruol, Anne Deschamps, Jacques Déverchère, Valentina V. Mordvinova, Ulziibat Munkhuu,
et al.. Upper mantle flow beneath and around the Hangay Dome, central Mongolia. Earth and
Planetary Science Letters, Elsevier, 2008, 274 (1-2), pp.221-233. �10.1016/j.epsl.2008.07.027�.
�hal-00407853�
Upper mantle
flow beneath and around the Hangay dome, Central Mongolia
Guilhem Barruol
a,⁎
, Anne Deschamps
b, Jacques Déverchère
c,d, Valentina V. Mordvinova
e,
Munkhuu Ulziibat
f, Julie Perrot
c,d, Alexandre A. Artemiev
e, Tundev Dugarmaa
f, Götz H.R. Bokelmann
aa
Université Montpellier II, CNRS, Géosciences Montpellier, F-34095 Montpellier cedex 5, France
b
Université Nice Sophia Antipolis, CNRS, Observatoire de la Côte d'Azur, Géosciences Azur, 250, Rue Albert Einstein, F-06560 Valbonne, France
c
Université Européenne de Bretagne, France
d
Université de Brest; CNRS, UMR 6538 Domaines Océaniques; Institut Universitaire Européen de la Mer, Place Copernic, 29280 Plouzané, France
e
Institute of the Earth's Crust SB RAS, Lermontov st. 128, Irkutsk, 664033, Russia
fResearch Centre of Astronomy & Geophysics of the Mongolian Academy of Sciences (RCAG), P.O. Box 51, Ulaanbaatar, Mongolia
a b s t r a c t
Mongolia represents the northernmost area affected by the India–Asia collision, and it is actively deformed along transpressive belts closely associated with large-scale strike-slip faults. The active and past mantleflow beneath this region is, however, poorly known. In order to investigate deep mantle deformation beneath central Mongolia and its relation with the surrounding major structures such as the Siberian craton, the Gobi–Altay belt and the Baikal rift, a NS-trending profile of broadband seismic stations has been deployed in the summer 2003 from the southern Siberian craton to the Gobi–Altay range, crossing the entire Hangay dome. Mantle flow is deduced from the splitting of teleseismic shear waves such as SKS phases. In eastern Mongolia, the permanent station ULN in Ulaanbaatar reveals the presence of two anisotropic layers, the upper one being oriented NE–SW, close to the trend of lithospheric structures and the lower one NW–SE, close to the trend of Eurasia absolute plate motion. Along the NS profile in central Mongolia, seismic anisotropy deduced from SKS splitting reveals a homogeneous NW–SE trending structure, fully consistent with the observations made in the Altay–Sayan in western Mongolia. The observed delay times of 1.5 to more than 2.0 s favor consistent mantleflow over large mantle thicknesses. Since the lithosphere is less than 100 km thick beneath central Mongolia and since the observed fast directions are parallel to the trend of the lithospheric structures but also close to the trend of the absolute plate motion, we propose that both the lithosphere and the asthenosphere may join their anisotropic effects beneath central Mongolia to explain the large delay times. Although GPS vectors represent the instantaneous displacement of the Earth's surface and SKS splitting the time and vertical integration offinite strain at depth, we use the opportunity of the dense geodetic measurements available in this region to discuss the anisotropy pattern in term of present-day deformation. In the Eurasia-fixed reference frame, GPS and SKS both depict a similar trend beneath central Mongolia, suggesting a lithospheric block“escaping” toward the east that could orient olivine a-axes in the upper mantle, within a transpressive tectonic regime. A different behaviour is observed in western Mongolia: the GPS vectors trend NS, close to the regional compression direction, whereas the fast SKS directions trend EW, suggesting a tectonic regime close to a mode of axial shortening, generating the development of an EW-trending foliation at depth. We therefore propose that Mongolia is a place where active and frozen lithospheric deformation may add their effects, together with the sublithosphericflow. In the three sources of anisotropy inferred, a fundamental role is played by the Siberian craton that acted as an undeformable core of the continent through time: the frozen Paleozoic and Mesozoic structures wrap around the craton, building up the fast anisotropic direction pattern; the present-day sublithospheric flow induced by the plate motion is likely deflecting around its deep roots; finally, the present-day tectonic regime appears to be controlled by the presence of the craton to the north.
1. Introduction
The crustal deformations occurring along the Siberian platform and within the Mongolian plateau (northern Asia) are broadly accepted to represent the northernmost effects of the India-Eurasia collision (Fig. 1). At large scale, these deformations most probably result from the difference in external boundary conditions to the South and the East, with compression from the south due to the India/Eurasia collision, and
⁎ Corresponding author. Université Montpellier II, CNRS, Laboratoire Géosciences Montpellier, Pl. E. Bataillon, 34095 Montpellier cedex 5, France. Tel.: +33 4 67 14 34 87; fax: +33 4 67 14 36 03.
E-mail addresses: barruol@gm.univ-montp2.fr(G. Barruol),
deschamps@geoazur.unice.fr (A. Deschamps), jacdev@univ-brest.fr (J. Déverchère),
mordv@crust.irk.ru (V.V. Mordvinova), ulzibat@rcag.url.mn (M. Ulziibat),
jperrot@univ-brest.fr (J. Perrot), dugarmaa@rcag.url.mn (T. Dugarmaa),
the“open limit” of the plate over the Pacific subduction zone to the east, and to a lesser extent, internal buoyancy forces within Asia, all of them acting on a faulted lithosphere with laterally varying strength (Flesch et al., 2001; Petit and Fournier, 2005; Vergnolle et al., 2007). In central Mongolia, the style of the present-day surface deformation is dominated by transpression and is characterized by the presence of large-scale, E– W trending senestral strike-slip faults such as the Bolnay and Bogd faults that have been the source of 3 large earthquakes of magnitude larger than 8.0 during the twentieth century (e.g.,Baljinnyam, 1993; Ritz et al., 1995; Delouis et al., 2002; Pollitz et al., 2003). In western Mongolia, the NS compression induced by the Indian collision is accommodated through the NW–SE trending transpressive Altay range and several large dextral strike-slip faults (Molnar and Deng, 1984).
Though several recent geological and geophysical studies have allowed us to describe active tectonics and kinematics in northern Asia relatively well, the deep structures, either active or frozen in the mantle, are still poorly known. A better knowledge of the structures at lithospheric and upper mantle scales across the main lithospheric units such as the Siberian craton, the Mongolian plateau, its Hangay dome, and the Gobi–Altay range is required in order to constrain the large-scale processes at depth in this northernmost continental structure of the India–Asia collision. Seismic stations were deployed in 1991/1992 across the Baikal rift system and from the Siberian platform to south-eastern Mongolia. Data from these deployments were used for teleseismic tomography (Gao et al., 1994a, 2003) and anisotropy research (Gao et al., 1994b, 1997). P-wave travel time tomography evidenced a low-velocity zone as shallow as 40 km deep interpreted as an asthenospheric upwarp beneath the rift axis. The splitting of SKS waves indicates a rift-normal mantleflow close to the rift and a rift-parallel one at a distance of about 500 km South from the rift. These station deployments were focused on the Baikal rift and did not provide
accurate information concerning central Mongolia. From these experi-ments, there is, however, slight evidence for the presence of a low-velocity upper mantle beneath central Mongolia: the tomographic image obtained from a rough surface wave inversion seems to show that the low-velocity zone beneath the SW termination of the Baikal could have a southward extent below the Hangay Dome (Zorin et al., 2002).
In the summer of 2003 we operated a 1300 km long, NS-trending, seismic line (Fig.1). This is a collaborative Russian, Mongolian, and French effort aiming at imaging the crustal and upper mantle structure from the Siberian platform in the north to the Gobi–Altay range in the south, in order to provide geodynamic constraints on deep lithosphere and asthenosphere velocity structures and deformations. Another aim was to clarify and quantify the relationship between the deep structures of the Siberian craton, the Baikal rift, the Hangay dome, and the large-scale strike-slip faults. By determining the upper mantle velocity structures beneath the MOBAL profile from receiver function techniques and shear-wave tomography,Mordvinova et al. (2007)showed a clear correlation of low velocities in the uppermost 250 km of the mantle with the late Cenozoic and Holocene volcanism in this area. Their observations suggest a hot upper mantle beneath central Mongolia likely associated to a lithosphere thinning, that may also explain the anomalous elevation associated with the Hangay dome. In the present paper, we focus on upper mantle anisotropy deduced from SKS splitting and discuss the possible origins and scenarios, and in particular the influence of inherited structures, of the recent deformationfield, and of the plate displacement. Seismic anisotropy in the upper mantle results primarily from elastic anisotropy of rock-forming minerals – particularly olivine – which develop preferred orientations in response to tectonic stress andflow (e.g.,Nicolas and Christensen, 1987; Mainprice et al., 2000). Upper mantle seismic anisotropy can be detected from the splitting of teleseismic shear waves: a polarized shear wave propagating through
an anisotropic medium is split into two perpendicularly polarized waves that travel at different velocities. From three-component seismic records, two parameters can be measured to quantify anisotropy: the difference in arrival time (δt) between the two split waves, which depends on the thickness and on the degree of intrinsic anisotropy of the medium, and the azimuthΦ of the fast split shear wave polarization planes, which is related to the orientation of the pervasive fabric (foliation and lineation) in the anisotropic structure. Measurement of teleseismic shear-wave splitting is therefore used to probe active or fossil mantle deformation beneath a station, with a good lateral resolution of a few tens of kilometers that can provide crucial information on present and past geodynamic processes that occurred in the upper mantle. Unfortunately, SKS splitting has a poor vertical resolution and the vertical location of anisotropy in the mantle is always a key unknown when interpreting SKS splitting measurements. If one assumes that most of the anisotropy affecting the vertically propagating shear waves lies within the uppermost 400 km of the Earth (e.g.,Savage, 1999; Mainprice et al., 2000, 2005; Sieminski et al., 2007) and that the crust may contribute to the total observed delay times to only a few tenths of seconds (Barruol and Mainprice, 1993; Godfrey et al., 2000), then most of the SKS splitting has to be explained by active or fossil upper mantle deformation.
In the present paper, after a description of the experiment and of the shear wave splitting measurements, we discuss the various possible origins of anisotropy (in the lithosphere and in the astheno-sphere) in the light of independent geological and geophysical data and the current tectonic processes.
2. Experiment, data and methodology
From April to October 2003, 18 three-component broadband stations from the French Lithoscope program were deployed along a NS trending profile extending from the southern Siberian platform to the Gobi–Altay range (Fig. 1), crossing the southwestern tip of the Baikal rift and the whole Hangay dome. This temporary seismic deployment took place in a larger project combining other observa-tions such as geodesy and seismotectonics in order to constrain the crustal and mantle structures but also the past and present-day tectonic processes occurring in the Baikal–Mongolia system.
In order to observe distinct, high signal-to-noise ratio SKS and SKKS phases, we selected teleseismic events located at distances larger than 85° and of magnitude generally greater than 5.8. The origins and locations of the events used in this study, which are reported in the supplementary material, are taken from the U.S. Geological Survey (USGS) Preliminary Determination of Epicenters. Phase arrivals are computed using the IASP91 Earth reference model (Kennett and Engdahl, 1991).
We measured the shear wave splitting using the method ofSilver and Chan (1991) which determines the ‘shear wave splitting parameters’, ϕ and δt, that best minimize energy on the transverse component of the seismogram for a selected time window. We also used the SplitLab analysis software (Wüstefeld et al., 2008) that combines both theSilver and Chan (1991)method and the Rotation-correlation approach (Bowman and Ando, 1987). SplitLab is particu-larly suited to process large volumes of data, and the combination of
Fig. 2. Examples of splitting measurements obtained for event 2003/208 (27-Jul-2003, 02:04, Mw = 6.6, lat.−21.08N, long. −176.59E, depth 212 km, backazimuth 110°) at stations HURE, BAYN and DALA. From left to right we show for each station the raw data (radial and transverse components of the SKS phase), the corrected fast and slow split waves, the particle motion in the horizontal plane before and after the anisotropy correction, and the map of the eigenvalues for the variousϕ and δt values.
two independent techniques has been shown to provide helpful information to identify and quantify weak anisotropy and null observations (Wüstefeld and Bokelmann, 2007). We present inFig. 2
three examples of splitting measurements obtained at stations HURE, BAYN and DALA for the Tonga event occurring on July 27 that show clear SKS phases with signal/noise ratio larger than 10 and clear splitting with different parameters depending on the station location. We ascribe a quality factor (good, fair, or poor) to the measurements, as defined byBarruol et al. (1997), depending on the signal to noise ratio of the initial phase, on the rectilinear polarization of the particle motion in the horizontal plane after anisotropy correction, and on the waveform correlation between the fast and slow split shear waves. In addition to the temporary MOBAL stations, we also processed the data recorded during more than ten years at the two permanent IRIS stations TLY (Talaya, Russia), located at the southwestern tip of the Baikal lake, and ULN (Ulaanbaatar, Mongolia).
3. Shear wave splitting observations 3.1. Anisotropy along the MOBAL profile
Thanks to the site quality, the low noise level in this region, and the occurrence of several events of sufficient magnitude at the right
epicentral distance during the six-month experiment, shear wave splitting has been observed at most of the temporary stations except for some located at the southwestern tip of the Baikal rift. The regional anisotropy pattern presented inFig. 3can be described with respect to large-scale lithospheric structures.
i) The two MOBAL stations on the Siberian platform (KAIT, OKTB) are characterized by measurements of intermediate quality. They show a complex pattern with fast directions trending from NW– SE to EW, similar to fast directions that have already been reported byGao et al. (1997)for this area. The small number of individual measurements does not allow any conclusive interpretation. ii) We did not succeed in detecting anisotropy at the temporary
stations located at the southwestern tip of the Baikal rift: we obtained only a very limited amount of data due to instru-mentation problems in stations KIRN, ARSH, DLY2 and DALY, and only null measurements have been observed at the station TORI that provided good quality data.
iii) The eleven seismic stations aligned across the Hangay dome are characterized by homogeneously oriented fast split directions trending N115°E to N134°E with an average close to N130°E with some local exceptions such as TSET (ϕ=N170°E). This homo-geneity inϕ is visible inFig. 4that shows the NS variation of the mean splitting parameters. Delay times are not characterized by similar homogeneity. They display strong variations ranging from 0.75 s (UULA) to 2.86 s (BAYN, example shown on Fig. 2) suggesting short-scale and rather superficial variations in the magnitude of deformation. It is worth noting that the four stations sampling the northern half of the Hangay dome (SHA2, HURE, BADR and BAYN) and two stations located on the southern half of the dome (TUSG and BUMB) are characterized byδt larger than 1.5 s (Fig. 4). The largest delay time of the whole profile is observed at station BAYN located on the eastward continuation of the Bolnay senestral strike-slip fault but also above the slowest shear velocity anomaly evidenced by seismic tomography by
Mordvinova et al. (2007). The regional NW–SE trending fast anisotropic direction we observed across the Hangay dome is perfectly aligned with the observations made byDricker et al. (2002)in the Altay–Sayan region further west. These authors also
Fig. 3. SKS wave splitting measurements observed at the MOBAL temporary stations, and at the GSN permanent broad band stations TLY and ULN. The splitting observations are characterized by their azimuths and the delay time (length of the segment). The individual splitting measurements of fair (grey) and good (black) quality are shown at each station. The quality of the measurement is based on the SNR of the initial SKS phase, on the initial ellipticity of the ground motion associated to the SKS phase, on the linearization of the transverse component after anisotropy correction and on the similarity between the split waveforms.
Fig. 4. Variations of the mean anisotropy parameters (ϕ and δt) obtained along the MOBAL profile from the high quality splitting measurements (seeTable 1). For station ULN the azimuth of the lower and upper fast directions obtained from the best-fitting two-layer model are plotted.
observed strong delay times at station ERN (2.3 s) slightly north of the Bolnay fault.
iv) The two stations DALA and ALTA located in the Gobi–Altay range on the Bogd senestral strike-slip fault provided a rather large number of good splitting measurements (10 and 6 respectively) that display a clear anisotropy trending respec-tively N150°E and N145°E andδt of 1.29 and 1.34 s (Table 1and example onFig. 2). The quality and the homogeneity of the splitting results at these two stations make them different from the Hangay dome stations and clearly not parallel to the major strike-slip fault trending N100°E.
Extracting the SKS splitting parameters from the SKS world database (http://www.gm.univ-montp2.fr/splitting/) at the scale of the India– Asia collision shows that the averageδt (1.03 s) calculated from the 230 mean SKS splitting values published for this area is very similar to the global average already described for instance bySilver (1996). Interest-ingly, only 12 stations from this data set displayδt higher than 2.0 s. These values have been measured in Tibet (McNamara et al., 1994; Huang et al., 2000), in Altay (Dricker et al., 2002), and in central Tian Shan (Li and Chen, 2006), i.e., in active crustal and mantle deformation areas. At these stations, the overall parallelism of the fast directions with the trend of the lithospheric structures suggest active mantle deforma-tion at the scale of the lithosphere. In Mongolia, the distribudeforma-tion of these strong anisotropies is not directly located on the present-day major lithospheric structures (sutures and lithospheric faults), suggesting that part of the anisotropy may lie in the sublithospheric mantle. The present-day absolute velocity of Eurasia being small, the passive asthenosphere deformation induced by the plate drag could be also of small intensity, suggesting that a model of“Simple Asthenospheric Flow” (SAF) (Silver, 1996) is likely not enough to explain the large delay times observed in this region, and that a stronger, active asthenospheric flow not visible in the surface geodetic measurements is likely present at sublithospheric depth.
3.2. Looking for two anisotropic layers beneath Mongolia
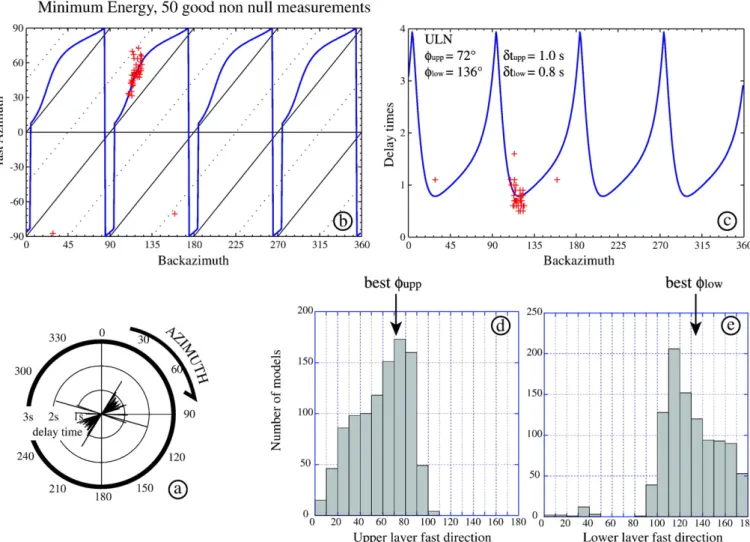
Twelve years of data recorded at the GSN permanent station ULN in Ulaanbaatar have been processed and provided 57 nulls and 82 non
null splitting measurements. The 50 good-quality non-null measure-ments (Fig. 5a) are characterized by a rather strong dispersion inϕ that range between N20°E and N100°E and inδt that range between 0.5 to 2.0 s. Those variations are clearly not randomly organized but display a smooth back-azimuthal variation in the splitting parameters fromϕ oriented N030°E associated with large δt, to ϕ trending N080°E with small δt (Fig. 5b). We therefore tested the presence of two anisotropic layers beneath this station using the scheme proposed by
Silver and Savage (1994). As described in details by Walker et al. (2005)and byFontaine et al. (2007), we applied a forward approach by calculating the apparent back-azimuthalϕ and δt variations for two anisotropic layer models, by varyingϕ in each layer in steps of 2° (from 0 to 180°) andδt in steps of 0.2 s (from 0.2 to 2.6 s), providing more than 1.3 million models to test. Each model is compared with the observations and sorted as a function of the misfit. The best model we found is characterized byϕupp= N72°E,δtupp= 1.0 s andϕlow= N136°E,
δtlow= 0.8 s. This model, presented inFig. 5b and c is representative for
the population of best-fitting models since the distribution of the best-fitting thousand models clearly displays that ϕ in the upper layer (Fig. 5d) and in the lower layer (Fig. 5e) are likely to be oriented in the range N040–90°E and N100–140°E, respectively. Delay times are less well-constrained since the best-fitting thousand models show that δt in each layer has to be in the range 0.8–1.4 s. Interestingly, these two directions were already observed by Gao et al. (1994b) at some temporary stations installed during the 1992 Baikal Rift Zone experiment and they may have geodynamic significance: the aniso-tropy in the lower layer trends close to the Eurasian absolute plate motion vectors calculated from HS3-Nuvel1A (Gripp and Gordon, 2002) but also close to the direction we observe further west in central Mongolia and also on the Siberian platform. The anisotropy in the upper layer trends NE–SW, i.e., parallel to the trend of the Baikal rift but also to the general trend of the lithospheric structures (foliations, sutures) in this area.
Since the results deduced from the six-month MOBAL temporary deployment appear to be significantly different from the results obtained at ULN from more than 10 years of data, a key question is to know whether this difference could just be a sampling artifact or whether the upper mantle structure is actually different beneath both areas, at ~ 400 km from each other. By analyzing results obtained at
Table 1
Station locations and mean anisotropic parametersϕ and δt, together with their 1σ uncertainties
Station name Lat (°N) Long (°E) Φ (°) Error_ϕ (°) δt (s) Error_δt (s) Number_of_good_measurements
KAIT 52.8070 103.1920 – – – – 0 OKTB 52.4083 102.9830 94. 5. 0.90 0.20 1 ARSH 51.9185 102.4230 – – – – 0 KIRN 51.8202 102.1350 – – – – 0 TORI 51.8110 103.0780 – – – – 0 DLY2 50.9111 102.8950 – – – – 0 DALY 50.9580 102.9100 – – – – 0 SHA2 50.5056 103.0170 126. 5. 1.69 0.36 3 HURE 50.1123 101.5730 129. 2. 1.55 0.12 6 BADR 49.6086 102.0050 118. 3. 1.92 0.16 4 SHAR 49.1322 101.4240 – – – – 0 BAYN 48.4356 101.2940 122. 3. 2.86 0.24 4 BUGA 47.9143 101.2880 122. 21. 0.90 0.73 1 TSET 47.4823 101.4470 170. 6. 1.03 0.20 2 TUSG 47.0692 100.9530 129. 4. 1.67 0.21 3 OVGO 46.6034 100.9350 115. 10. 1.27 0.05 2 BUMB 46.1343 100.8070 119. 5. 2.30 0.35 1 UULA 45.7126 100.7270 134. 12. 0.75 0.20 1 DALA 45.0094 100.4700 150. 3. 1.29 0.05 10 ALTA 44.7019 100.3330 145. 3. 1.34 0.07 6 TLY 51.6807 103.6438 – – – – 19⁎ ULN 47.8652 107.0528 51. 2. 0.79 0.03 50⁎⁎
The number of high quality measurements from which the mean values are calculated is also reported on the last column.⁎For station TLY, 19 good non null splitting measurements were obtained meaning that this station cannot be considered as isotropic. The large and apparently inconsistent dispersion inϕ at TLY implies that any kind of averaging would be meaningless and suggest a complex structure beneath this area.⁎⁎At station ULN, the mean splitting parameters are reported but we show in this work that the presence of two anisotropic layers beneath the station is likely withϕupp= N72°E,δtupp= 1.0 s andϕlow= N136°E,δtlow= 0.8 s.
stations on the Hangay dome and at station ULN, we propose that the structures are different: At station BAYN for instance, the 4 events that provided good non-null splitting measurements with ϕ trending N115–128°E arrive with backazimuths of 104, 119, 108, and 110°. At station DALA further south, from the 10 events providing good non-nulls, 9 also arrive with backazimuths in the range 102–118° and one with a backazimuth of 338°. At this station, all the fast split directions are trending between N159°E to N138°E. At station ULN, all the events arriving with backazimuths between 100 and 130° provided well-defined fast split directions in the range N40–60°E. In summary, analyzing 6 months of data at ULN is not likely to allow us to constrain a two-layered structure, but it should give primarily a NE–SW dominant fast direction. Our measurements along the MOBAL profile show a clear NW–SE fast direction, from which we conclude that the upper mantle pervasive structure beneath the Hangay dome and Ulaanbaatar four hundred km to the east is effectively different. As discussed below, a possible geometry is that two anisotropic layers are present beneath Mongolia, but their fast directions are close to each other beneath central and western Mongolia and significantly different beneath eastern Mongolia.
Analysis of 16 years of data recorded at the permanent station TLY located at the southwestern edge of the Baikal rift provided 190 null measurements and only 19 non null measurements of good quality. These good splitting measurements display a more complex pattern (Fig. 3) than at ULN, and are characterized by a strong scatter of the fast split directions, with two dominant NS and EW fast directions
observed in a very narrow backazimuthal range (N110–130°E), which cannot be explained by the only presence of two anisotropic layers. Although the overall pattern may resemble to the pattern obtained at ULN, they are in fact notably different and a simple two-layer model does not explain the observations at TLY better than a single anisotropic layer, suggesting instead the presence of complex and heterogeneous mantle structures beneath this area, which was already proposed byGao et al. (1994b, 1997)and byVauchez et al. (1999).
4. Discussion
Interpretation of shear wave splitting is not straightforward since it depends on our knowledge of processes of the anisotropy development and on its lateral and vertical location. We discuss in the following sections three possible sources of anisotropy: i) deformation may be“frozen” in the lithosphere and related to its build-up since Paleozoic times; ii) anisotropy may be located in the sublithospheric mantle and induced by the conjugate effects of present-day plate drag and deeper active convection; iii)finally, upper mantle anisotropy may be related to the present-day deformation of this part of the continent induced by the collision of India with Eurasia. We take the opportunity of the dense geodetic measurements available in Mongolia to refine this discussion. An interesting conclusion is that the three origins of anisotropy are likely and may add their effects together.
Fig. 5. Analysis of splitting measurements obtained at ULN (Ulaanbaatar, Mongolia). a: anisotropic parameters of the 50 good splitting measurements in a polar diagram. b and c: apparent variations of the splitting parameters (respectively the fast direction and the delay time) as a function of the backazimuth of the incoming wave, together with the best-fitting two-layer model found (blue line). d and e: histograms showing the statistical distribution of the upper and lower fast directions of the 1000 best two-layers models.
4.1. Seismic anisotropy and role of the fossil lithospheric deformation The present-day structure of the Mongolian lithosphere likely results from a long-lasting accretion of micro-continents and island-arcs that wrapped around the Siberian craton (the paleo-Angara plate) during Caledonian and Hercynian times (e.g.,Zorin, 1999). From late Cambrian to Devonian times, an active margin extended along the present-day southwestern side of the Siberian craton. This Caledonian event closed the paleo-ocean, and accreted several micro-continents south to it, such as the Tuva–Mongolia block (Delvaux et al., 1995) and developed the Sayan–Baikal fold belt. This Caledonian orogeny that affected western Mongolia produced NW–SE trending crustal folia-tions and fault-related structures.
From Devonian to Triassic times, another active margin was present on the southeastern side of the craton, parallel to its border and trending NE–SW along the Mongol–Okhotsk ocean (Delvaux et al., 1995). This area underwent strong deformation, bloc accretion and granitic intrusion and formed a major part of the Hercynian Mongolian basement. During Devonian to Carboniferous times, another NW–SE trending subduction (along the Paleo–Tethys) was active at roughly the present-day location of the Gobi–Altay range. This tectonic feature was accompanied by back-arc rifting, volcanism, magmatism, accretions, and by transpressional, right-lateral shearing that may have affected the whole lithosphere and that may have oriented the olivine a-axes parallel to the trend of the belt (e.g.,Tikoff et al., 2004).
The tectonic evolution of Mongolia during Mesozoic times is primarily marked by thefinal closure of the Mongol–Okhotsk ocean
that occurred at the end of the Trias. At that time, the Mongol and Baikal lithospheres were formed. They did not suffer strong deforma-tion until Cenozoic times, when the India–Asia collision started and induced a large-scale block reorganization. The present-day deforma-tion of Mongolia started at the end of the Oligocene and appears to have accelerated during the Pliocene (Schlupp, 1996). It is dominated by transpressional tectonics that built elongated ranges on large-scale strike-slip faults (Bayasgalan et al., 2005) that accommodate most of the displacements, shortening accommodated by thrust faults being rather limited, e.g., only 20–30 km across the Mongolian Altay (Cunningham, 2005).
Large-scale structural analyses and plate-tectonics reconstructions therefore suggest that during all Paleozoic and early Mesozoic times, Mongolia was a place of continuous accretion and transpressive deformation around the Angara Craton, with penetrative structures trending NW–SE on the southwestern side of the Siberian platform (i.e., in the present-day western and central Mongolia) and trending NE–SW on its southeastern side (i.e., in the trans-Baikal ranges, in eastern Mongolia). Such deformations are expected to involve the whole lithosphere and to orient olivine a-axes parallel to the lithospheric structures and hence to induce belt-parallel shear wave splitting (e.g.,Tommasi et al., 1999; Tikoff et al., 2004). Interestingly, reactivation of preexisting structures such as large-scale deformation zones have been described in several places, suggesting an important role of heterogeneities and inherited structures at lithospheric scale. The Gobi–Altay range is thought for instance to represent a boundary between Caledonian and Hercynian terranes (Delvaux et al., 1995),
Fig. 6. Topographic map of Mongolia and surrounding areas showing the mean SKS splitting measurements available in the region, together with the GPS vectors and their ellipsoid of uncertainty fromCalais et al. (2003)as well as the absolute plate motion vectors calculated from HS3-Nuvel1A (Gripp and Gordon, 2002). Note that the vector scales are the same for the GPS and APM. The splitting observations are characterized by their azimuths and the delay time (length of the segment). Black lines represent the data obtained in the present study whereas the blue lines represent splitting measurements previously published bySilver and Chan (1991),Vinnik et al. (1992),Gao et al. (1994b, 1997), andDricker et al. (2002).
suggesting that pre-existing lithospheric sutures have preferentially controlled Cenozoic faulting (Cunningham, 2005). The Bolnay fault is also described to reactivate a Silurian major crustal structure (Schlupp, 1996) and the Baikal pre-rift basement structure is clearly aligned with Paleozoic crustal structures (Delvaux et al., 1995). The NE–SW trending fast anisotropic directions in eastern Mongolia interpreted as lithospheric frozen structures also suggest that the opening of the Baikal rift could have been controlled by the rheological heterogene-ities induced by the adjacent Siberian craton, by the inherited structures, and also by the lithospheric-scale mechanical anisotropy as proposed byVauchez et al. (1997, 1998).
This schematic summary of the Mongolian lithosphere evolution shows that the various active margins that developed since Paleozoic times allow the accretion of micro-continents and the development of deformation belts that wrapped around the Siberian craton that itself acted as an undeformable core of this continent. Interestingly, the fast split directions we observe also appear to wrap around the craton: in central Mongoliaϕ trends NW–SE, i.e., parallel to the southwestern boundary of the Siberian platform (Fig. 6) and to the regional Caledonian penetrative structures and in eastern Mongolia,ϕ trends NE–SW as observed by Gao et al. (1994b) at their southernmost stations but also in the upper anisotropic layer we describe at ULN.
The orientations ofϕ observed at the two southernmost stations ALTA and DALA close to the active Bogd fault remain largely unexplained by this hypothesis. The absence of parallelism between ϕ and the fault suggests that the deformation at depth is either not large enough or too localized to be felt by teleseismic shear waves. The short-scale variations inϕ at these stations relative to the northern stations (Fig. 4) argue for shallow variations in the lithospheric fabric. Such variations may result either from recent complex microblock rotations and/or by the presence of a preexisting lithospheric structure beneath this area, at crustal or mantle depth. The latter hypothesis is favored by recent upper mantle tomography coupled with the inversion of gravimetric data that shows that the mantle beneath the Gobi–Altai range has different characteristics than beneath the Hangay dome (Tiberi et al., submitted for publication). More investigation across and along the Gobi–Altay range could bring useful insights on the origin of this anisotropy pattern.
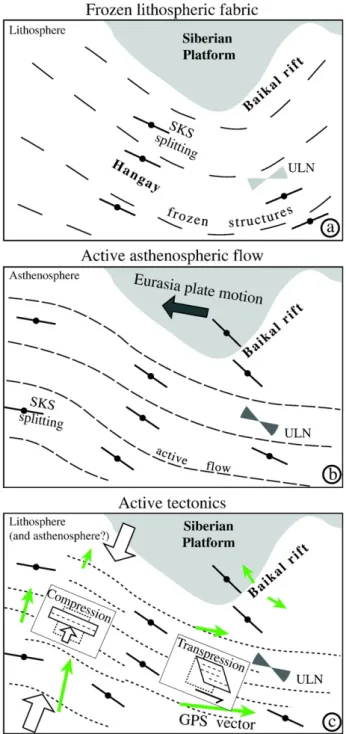
As sketched inFig. 7a, the fast direction of anisotropy is parallel to the strike direction of the lithospheric units, of the ancient accretionary belts and of the suture zones that wrap around the craton; we therefore suggest that part of the observed anisotropy results from the lithosphere formation and deformation and remained frozen since the Paleozoic and Mesozoic times and is still visible. As shown below, a sublithospheric anisotropy is however required since the lithosphere is likely not thick enough (less than 100 km) to carry the whole anisotropy signal (more than 2.0 s).
4.2. Seismic anisotropy, asthenosphericflow and Eurasia plate motion If part of the deformation may reside within the Mongolian lithosphere, shear wave splitting may also originate in the sublitho-spheric mantle where deformation is expected to accommodate the present-day absolute and relative motion of the plate, including the deep accommodation of the India–Asia collision. The drag-induced mantle deformation is clearly imaged beneath ocean basins by Rayleigh-wave tomography (e.g., Montagner and Tanimoto, 1991; Maggi et al., 2006) but also by SKS waves (e.g.,Wolfe and Solomon, 1998; Fontaine et al., 2007). Such an asthenospheric anisotropy signature beneath continental areas has been debated over the last decades, mostly because the anisotropy in the overlying continental lithosphere can be preserved for billions of years and can notably affect the signal picked up by the vertically-traveling SKS waves.
Due to its low velocity, the direction and velocity pattern of the Eurasian plate motion has been strongly debated and is still subject to rather large error bars. In central Mongolia, the recent HS3-Nuvel1A
Fig. 7. Schematic presentation of the various possible origins of upper mantle seismic anisotropy in Mongolia. a: At lithospheric depth (e.g., 70 km), the terranes and their sutures wrapped around the Siberian craton. The anisotropic upper layer at ULN trends NE–SWand the anisotropic fast-propagation directions beneath central Mongolia trend NW–SE. b: At asthenospheric depth (e.g., 150 km for Mongolia), the active mantleflow (dotted lines) beneath central Mongolia is slightly deflected by the thick Siberian cratonic root. The absolute plate motion (APM) calculated from HS3-Nuvel1A model (Gripp and Gordon, 2002) for the Siberian platform is indicated by the black arrow. The lower anisotropic layer at ULN but also beneath the Hangay dome trends NW–SE. Such structure may explain the NW–SE trending anisotropy and the large δt across the Hangay dome and the two layers of anisotropy beneath Ulaanbaatar, with an upper layer trending NE–SW and a lower layer trending NW–SE. c: Present-day tectonic situation in Mongolia. The large arrows indicate the regional compression direction induced by the India–Asia collision and the small arrows schematize the GPS vectors in the Eurasia-fixed reference frame fromCalais et al. (2003). The GPS vectors trend close to NS in western Mongolia, i.e., parallel to the regional compression direction, and close to EW in central and eastern Mongolia. This suggests a tectonic regime of compression in western Mongolia and of transpression in central and eastern Mongolia. In both regions as explained in the text, the fast anisotropic direction induced by such compression system are expected to trend WNW–ESE (dotted lines), i.e., close to the observedϕ directions.
plate motion model relative to the hotspot reference frame (Gripp and Gordon, 2002) indicates that the Eurasian plate moves towards an azimuth of 280° at a velocity of 2 cm/yr (Fig. 6). The SKS splitting directions we observe across the Hangay dome but also those in western Mongolia (Dricker et al., 2002) are relatively close to this azimuth but display a systematic clockwise rotation of 20 to 30°. Such difference could be considered to be within the uncertainty of Eurasia plate motion direction but may also reflect a true differential motion between the Earth surface and the convective mantle, such as for instance a deflection of the asthenospheric flow by the thick root of the Siberian platform. Further east, the anisotropy pattern across and south of the Baikal rift system displays a fast azimuth trending N140– 150°E, i.e., at high angle to the APM; however, in the southern part of theGao et al. (1994b)profile, ϕ trends NE–SW to E–W, i.e., closer to the APM trend (Fig. 6). At station ULN, the lower anisotropic layer evidenced in the present work is characterized byϕ trending roughly N130°E, i.e., parallel to the dominant fast direction beneath the Hangay region and also at 30° from the APM vector. In summary, the absolute plate motion can explain most of the MOBAL observations within 20 to 30°, but some large angular differences observed in several areas suggest that more complex anisotropic structures such as a vertical partition of the deformation, as evidenced at ULN, is probably involved.
The topography of the lithosphere–asthenosphere boundary may obviously influence the asthenospheric flow induced by the APM and/or the India–Asia collision and may locally or regionally explain angular differences between SKS and APM directions (Bormann et al., 1996). At long wavelength, Rayleigh-wave tomography (Priestley et al., 2006) shows that the thermal base of the cratonic root of the Siberian platform extends down to more than 200 km depth, whereas the lithosphere beneath central Mongolia is likely less than 100 km thick. The joint seismic and gravity inversion performed with the MOBAL data (Tiberi et al., submitted for publication) also exhibits a cold root beneath the Siberian craton, down to about 200 km depth, whereas the mantle beneath the Hangay dome is characterized by low velocities and densities between 80 and 200 km, suggesting the presence of buoyant material in the mantle sustaining the Hangay lithosphere. The primary effect that the thick Siberian cratonic keel may have on the astheno-sphericflow is to deviate it clockwise from the APM direction in central and Western Mongolia. These rotations are indeed observed, suggesting that at least part of our observations could have an asthenospheric origin related to the plate motion.Fig. 7b sketches the resulting regional trend of the asthenosphericflow that may explain these rotations. Our SKS splitting measurements can therefore be explained partially by the frozen lithospheric structure and by a present-day asthenosphericflow deflected by the Siberian cratonic root.
4.3. Seismic anisotropy and present-day tectonics
Interpretation of upper mantle seismic anisotropy in such a tectonically active area requires us to discuss the large-scale signal observed from shear wave splitting measurements that provides information on the deep Earth deformation with respect to the present-day tectonic processes observed at the surface. In this section, we take the opportunity to discuss our SKS splitting measurements that result from the time and space integration of mantle strain, in view of the dense geodetic measurements that provide the instanta-neous observable of Earth's surface deformation.
The tectonics of central Mongolia, Hangay and Hövsgöl domains (Fig. 1) is dominated by large senestral strike-slip faults striking E–W, probably of lithospheric scale, such as, from north to south, the Sayan, Mondy Bolnay and Bogd faults (Baljinnyam, 1993; Ritz et al., 1995; Delouis et al., 2002; Ritz et al., 2003; Schlupp and Cisternas, 2007, and references therein). Contrastingly, large dextral strike-slip faults striking NW–SE characterize active tectonics in western Mongolia (e.g., Bayasgalan et al., 2005; Cunningham, 2005, and references
therein). At the plate-scale, geodetical observations show that the India–Eurasia collision is accommodated by intracontinental defor-mation, dominated tofirst order by block motions along major strike-slip faults and at second order by internal strain within lithospheric blocks, except in high-elevation areas (Calais et al., 2006; Thatcher, 2007). Compilation of the geodetic measurements performed in Asia by Calais et al. (2006) and the velocity field modeled from GPS velocities and Quaternary fault slip rates (Flesch et al., 2001) both clearly evidence that the accommodation of the 4 cm/yr convergence of India relative to Eurasia is gradually absorbed northward and tends towards zero on the Siberian platform. The GPS velocities are, relative to stable Eurasia, on the order of 30 mm/yr in southern and central Tibet, less than 10 mm/yr in the North China and Tien Shan area, and less than 6 mm/yr in Mongolia (Calais et al., 2003).
The absence of overall correlation between GPS velocities that vary gradually between Himalaya and Mongolia and the observed splitting delay times suggests that an important source of anisotropy likely resides in the sublithospheric mantle. We show, however, that part of anisotropy may be related to the present-day tectonic compression induced by India through two complementary processes:
1) The anisotropy may be generated by the active strike-slip faults that may have a lithospheric extension (e.g.,Teyssier and Tikoff, 1998): The maximum splitting delay time (δt=2.86 s) is observed at BAYN which is located at the eastern termination of the EW-trending Bolnay fault on which occurred the 1905 Mw 8.3 earthquake that accommodated about 10 m of displacement along the 375 km long left-lateral strike-slip fault (Schlupp and Cisternas, 2007). Such highδt could indicate strong anisotropy related to the present-day deformation associated to this strike-slip fault. Along the MOBAL profile, the azimuth ϕ of the fast split shear waves we observe is homogeneously trending NW–SE, i.e., relatively close to the overall trend of the active faults (EW and N100°E for the Bolnay and Bogd faults, respectively) compatible with pervasive strain at depth related to these faults. Such interpretation seems to be, however, unlikely for the two south-ernmost stations of the MOBAL profile (ALTA and DALA) that show large obliquities ofϕ with the trend of the fault, suggesting either a too discrete deformation associated to the fault itself or the presence of different lithospheric block south of the fault. 2) The observed anisotropy can be induced by the ongoing India–Asia
collision that produce the NNE–SSE to NE–SW maximum com-pression direction (e.g., Petit et al., 1996) and may generate pervasive deformation at depth, in a similar way to the vertical coherent deformation proposed bySilver (1996). Although GPS velocities are small in Mongolia, and therefore subject to rather large uncertainties, GPS vectors relative to fixed Eurasia (Fig. 6) define several contrasted domains (Calais et al., 2003): i) Western Mongolia is characterized by roughly NS-trending vectors (2 to 6 mm/yr) corresponding to a NS shortening, consistent with a dominating dextral displacement on the NW–SE trending Mon-golia–Altay strike-slip faults (Schlupp, 1996; Bayasgalan et al., 2005; Cunningham, 2005) and with a rather limited crustal shortening (20 to 30 km (Cunningham, 2005)) accommodated by the E–W trending thrust-faults. ii) Central and eastern Mongolia are dominated by eastward to southeastward trending GPS vectors and velocities ranging from 1 to 4 mm/yr, likely accommodated by the Bogd and Bolnay E–W trending senestral strike-slip faults. iii) In the North, the Baikal area is subject to a NW–SE trending extension, normal to the rift long axis and of about 3 to 4 mm/yr. The trend ofϕ close to the GPS velocity vectors in central Mongolia (Fig. 6) suggests a relation between mantle flow and the surface crustal block motions in this central part of the profile that can be summarized in a model of crustal blocks escaping consistently with the mantle deformation. Such regime of transpressive deformation may orient olivine a-axes parallel to the block escape but cannot be
extrapolated to western Mongolia since GPS and anisotropy observa-tions are clearly oriented at high angle from each other (Fig. 6). In this area,ϕ is indeed oriented WNW–ESE to E–W and measurements display several large delay times (δt up to 2.3 s at station ERN for instance) (Dricker et al., 2002) whereas the GPS vectors in the Eurasia reference frame trend NS to N20°E (Calais et al., 2003), i.e., close to the regional compression direction (e.g.,Petit et al., 1996). GPS vectors and fast anisotropic directions are therefore normal to each other in western Mongolia, arguing for a mode of large-scale pure shear deformation or axial shortening deformation (Tommasi et al., 1999) (Fig. 7c) that implies a consistent crust and mantle deformation. Interestingly, such crust–mantle mechanical coupling has been recently proposed byWang et al. (2008)for central Asia by combining GPS and SKS splitting analysis.Dricker et al. (2002)already evidenced that the regional maximum stress compression (oriented NNE–SSW to NE–SW in Mongolia) deduced from the fault mechanisms (Petit et al., 1996; Flesch et al., 2001; Delouis et al., 2002) and from the GPS vectors (Calais et al., 2006) is normal to the trend of the fast split shear waves in western Mongolia and they proposed that the mantle anisotropy reflects this present-day compression. Although there is no clear natural evidence from seismic anisotropy observation of mantle deformation under pure shear or axial shortening conditions, numerical modeling of olivine fabrics and seismic properties ( Tom-masi et al., 1999) suggests that these modes of deformation may potentially generate strong SKS splitting above the deformed mantle if the strain is large enough, by developing vertical foliation planes trending normal to the compression axis and by orienting olivine a-axes in girdle within this foliation. Interestingly, the two modes of deformation that we propose to be active in Mongolia may induce consistent fast split shear waves at high angle to the compression direction and therefore close to the observations.
The difference in the present-day tectonic regime between central and western Mongolia is also constrained by numerical modeling. The studies of plate deformation initially performed byLesne (1999)and further developed byVergnolle et al. (2007), using thefinite element code SHELLS (Kong and Bird, 1995) at the Asian scale and taking into account realistic absolute plate motion and GPS vectors, topography, faults geometries, heatflow, and lithosphere rheologies confirms the different behavior between western and eastern Mongolia, compa-tible with the present-day GPS observations. In the Eurasian reference frame, western Mongolia appears in this model to be characterized by a roughly northward motion and by a NS shortening that could induce a roughly EW trending fast direction of anisotropy in a pure shear mode of deformation in the upper mantle, whereas central and eastern Mongolia are characterized by an eastward lithospheric block escape which could be accommodated at depth by the orientation of olivine a-axes parallel to the block escape direction.Lesne (1999)
interprets this complex behavior as the result of the Siberian platform which acts as an undeformable block on the north, and she also concludes that the Baikal rift has a passive origin, resulting from the effect of the regional stressfield, on the eastward Mongolia “escape” and from the rheological contrast between the Archean craton and the folded belt. Similar conclusions were reached by Chemenda et al. (2002)based on an experimental modeling.
A rough quantification of the large-scale deformation shows, however, that the present-day and recent deformation as source of anisotropy is likely not large enough to dominate the overall SKS splitting in this region: If one extrapolates the 1 cm/year of present-day NS convergence across western Mongolia (Calais et al., 2003) during 8 Ma of collision (Vassallo et al., 2007) and accommodated over about 1000 km (the width of Mongolia between the Siberian craton and the Gobi–Altay belts,Fig. 1), this suggests a roughly 80 km of shortening, which means a cumulative strain of about 0.08. From experimental deformation and numerical modeling, such deformation is expected to develop weak fabrics characterized by a J index lower than 2 and hence shear waves anisotropy smaller than 2% (e.g.,Silver
et al., 1999). Such magnitude of anisotropy can explainδt of about 0.5 s over a 100 km thick anisotropic layer. This simple calculation suggests that the observed shear wave splitting cannot be explained by the present-day and recent deformations alone and therefore argues for other sources of anisotropy, favoring the presence of fossil lithospheric deformations and of active sublithosphericflow, as proposed in the previous sections.
4.4. SKS splitting and the deep mantle structures beneath Mongolia As shown above, the homogeneous pattern of SKS splitting extending from western to central Mongolia is likely related to several processes, the effects of which may add together: the frozen lithospheric deformation inherited from its Paleozoic built-up (Fig. 7a), a sublitho-spheric mantleflow induced by the plate motion (Fig. 7b), and the pervasive deformation induced by the present-day compression and the deep accommodation of the India–Asia collision (Fig. 7c). We show in this section that these hypotheses are compatible with the lithosphere thicknesses derived from tomographic observations but also with the petrological and petrophysical data.
If the short-scale lithospheric structures beneath Mongolia are poorly known, long wavelength structures evidenced by surface wave tomography (Priestley and Debayle, 2003; Priestley et al., 2006), by the regional body wave tomography using the MOBAL data ( Mordvi-nova et al., 2007; Tiberi et al., submitted for publication), or by thermal modeling (Artemieva and Mooney, 2001) show that the Mongolian lithosphere is probably less than 100 km thick, whereas the Siberian craton is likely more than 200 km thick.
In the Baikal rift area, tomographic inversion of the teleseismic P-wave arrival times initially favored a very shallow asthenospheric upwelling, up to the bottom of the crust (Gao et al., 1994a, 2003), but joint inversion of the gravity signal and teleseismic data suggest a much deeper lithosphere–asthenosphere boundary, since the low-velocity upper mantle is evidenced between 70 and 170 km depth (Tiberi et al., 2003). Modeling of the Bouguer gravity anomalies (Petit and Déverch-ère, 2006) also argues for a lithosphere thickness between 120 to 180 km beneath the Siberian platform to the north and 60 to 80 km south of the Baikal rift.
Love–Rayleigh wave dispersion curves measured between stations ULN and TLY (Lebedev et al., 2006) also evidence a thin lithosphere (60–70 km thick) underlain by a low-velocity layer that could represent the low-viscosity asthenosphere. The presence of radial anisotropy (VshNVsv) in the uppermost 100 km between these stations, together with the NW–SE trending ϕ (Gao et al., 1997) led
Lebedev et al. (2006)to propose a model of mantleflow rising from beneath the Siberian craton and perpendicular to the Baikal rift that explains not only the observed SKS splitting pattern but also the episodic volcanism occurring by decompression melting on the southern side of the craton. Such a model is consistent with the conclusions reached byMordvinova et al. (2007)in central Mongolia where SV velocity analysis along the MOBAL profile suggests the presence of low velocities in the subcrustal upper mantle, compatible with a thinned lithosphere and that could also explain the presence of pervasive recent volcanism in this area.
Petro-geochemical analyses of Mongolian basalts (Barry et al., 2002) suggest a partial melt origin at a depth larger than 120 km. As proposed by the authors, the thermal anomaly that may have caused this partial melting is apparently not a deep rising plume since there is no geophysical evidence for such a structure. They propose that this thermal anomaly could be induced by an effect of thermal blanketing induced by the adjacent Eurasian lithosphere or, as proposed by
Lebedev et al. (2006), by decompression melting of a mantleflow rising from beneath the Siberian craton.
Analyses of mantle xenoliths brought up at the surface by the recent volcanism in the Tariat area, south of the Bolnay fault in central Mongolia, show garnet-bearing peridotites, with coarse-grained
textures and some evidence of metasomatism that could be produced by interactions between the lithospheric mantle and the uprising fluids (Ionov, 2002). The P–T data deduced from these garnet peridotites suggest that the xenoliths were equilibrated at 60–80 km depth range and at temperature of 1000–1100 °C, i.e. at a temperature 400–500 °C higher than the mantle xenoliths sampled in the Siberian craton at similar depths. The thermal structure of the lithosphere determined byEmmerson et al. (2006)suggests similarfindings, with a Moho temperature of 860 °C beneath the Tariat region and in the range 550–580 °C beneath the Siberian platform. The thermal lithospheric thickness they determine is around 90 km beneath Tariat and 225 km beneath the Siberian platform. These geophysical and geochemical observations suggest that olivine crystals at 80–100 km depth beneath Central Mongolia, and perhaps at smaller depth locally, likely lie in the dislocation creepfield and could therefore deform plastically with the dominant (010)[100] slip system. In such a situation, both the plate motion and the regional compression should develop strong fabrics in the upper mantle, by aligning the olivine a-axes along NW–SE directions coherent between the lithosphere and the asthenosphere. Such fabrics being close to the large-scale trend of the structures within the lithosphere, the different anisotropic sources may add their own effects together and may explain the highδt of more than 2.0 s observed at some sites. Petrophysical analyses of upper mantle rocks (Mainprice et al., 2000, Ben Ismail et al., 2001) show indeed that such delay times require 200–250 km of anisotropic mantle with typical intrinsic S-wave anisotropy ranging between 4 to 5%. Since tomographic and petrological data demonstrate that the lithosphere is clearly not thick enough to carry all the splitting signal and since the present-day and recent deformation is not large enough to generate strong anisotropies, this suggests that a large part of the splitting delay time has to be explained by asthenosphericflow.
In central Mongolia, the origin of the large-scale, high topography of the Hangay dome has been strongly debated, but the constraints imposed by the gravity anomaly (Petit et al., 2002) and more recently by seismic tomography and receiver function analysis (Mordvinova et al., 2007) strongly favor an anomalous upper mantle beneath this area as a primary cause of this topographic uplift: interpretation of both the topography anomaly and the large scale (200–300 km) Bouguer gravity anomaly (50 mGal) ledPetit et al. (2002)to propose the presence of both a small-scale, low-density material in the subcrustal uppermost mantle and a longer wavelength, low-density material at asthenospheric depth, which is compatible with the low shear wave velocities observed beneath central Mongolia (Mordvinova et al., 2007). Recent joint inversion of seismic and gravity data (Tiberi et al., submitted for publication) along the MOBAL profile confirms the origin of the Hangay doming in the presence of low density/velocity mantle in the astheno-spheric upper mantle. The Bouguer gravity anomaly in particular is characterized by a large, negative (−300 mGal) and long-wavelength anomaly centered on the Hangay dome (Tiberi et al., submitted for publication) arguing for a large-scale lithospheric thinning. Such observations are in contradiction with the proposition that the Hangay dome could behave as a craton or rigid microblock within Mongolia (Cunningham, 2001), and that its thickened crust and thinned litho-sphere could deflect the asthenospheric flow and consequently generate the upwelling, the doming and the Cenozoic volcanism. The upper mantle velocities beneath the MOBAL profile (Mordvinova et al., 2007; Tiberi et al., submitted for publication) show no sign of any high-velocity root beneath this area; low velocities dominate instead from the Moho to at least 250 km depth and therefore indicate a thinned lithosphere that cannot be qualified as cratonic. Our new splitting measurements show a very homogeneous anisotropy pattern trending NW–SE across central and western Mongolia, inconsistent with the SW–NE mantle flow proposed byCunningham (2001). We do not observe any particular signature associated with the Hangay dome itself that could be interpreted as asthenospheric and lithospheric inflow beneath the Hangay dome.
Together with the tomographic images, our SKS splitting measure-ments evidence the major influence of the deep root of the Siberian craton on the large-scale behavior and deformation of the lithosphere and asthenosphere: The craton likely influences the pattern of astheno-spheric flow deflected by its deep root. It also controlled the structuration of the lithosphere during Paleozoic times and still influences the present-day large-scale compression tectonics by indu-cing compressive and transpressive tectonic stress regimes in western and eastern Mongolia, respectively. A recent numerical modeling of the strength of the lithosphere in the Baikal region (Petit et al., 2008) from gravity data, Moho and lithosphere-asthenosphere geometries evi-dences that the cratonic crust and lithospheric mantle of the Siberian platform are strongly coupled whereas the Paleozoic–Mesozoic Mon-golian lithosphere appears to be much weaker and is likely subject to decoupling between its upper crust and upper mantle. Such result is of importance since it may explain why the rather discrete deformation visible in the upper crust from active faulting may coexist with the apparently more pervasive deformation inferred from anisotropy at mantle depth beneath Mongolia.
5. Conclusion
Temporary deployment of seismic stations across central Mongolia allowed us to characterize upper mantle anisotropy beneath most stations of the MOBAL profile. Though the northernmost stations on the Siberian platform and at the southwestern end of the Baikal rift did not provide enough data and splitting measurements to allow for a clear interpretation, the anisotropy pattern is well defined at the other stations, particularly across the Hangay dome, with a dominating NW– SE trending ϕ and relatively large δt. Geophysical and geochemical arguments favor a lithosphere thinner than 90 km beneath central Mongolia, contrasting with a thick (at least 200 km) Siberian platform. This suggests that the splitting across the Hangay dome cannot be explained by a lithospheric deformation alone. Beneath Ulaanbaatar in eastern Mongolia, we image a two-layered structure compatible with lithospheric fast anisotropic direction trending NE–SW over an astheno-sphericflow trending NW–SE. The parallelism of ϕ observed on the Siberian craton and in central Mongolia suggests also a common origin, that could be an asthenosphericflow resulting from the interaction of the APM, the deeper mantleflow and the shape of the craton's keel. These observations led us to propose that the observed pattern of SKS splitting in Mongolia originates from both lithospheric and astheno-spheric deformation. The lithoastheno-spheric anisotropy likely results from the long-lasting geological evolution along active margins but also from the recent and present-day deformation of the Mongolian lithosphere along the large-scale strike-slip faults and under the regional NNE–SSW compression regime. The deeper anisotropy is likely related to the asthenosphericflow induced by the relative motion of the present-day Eurasian plate and the deep mantle circulation. The present study also confirms a strong control of the root of the Siberian craton on the anisotropy pattern by two complementary ways:(1) it acted as a rigid body during the early stages of lithospheric block accretions, or during the more recent deformation induced by the India–Asia collision, and (2) it may deflect a present-day asthenospheric flow beneath Mongolia. Acknowledgments
This work was performed with funding from the French CNRS (Centre National de la Recherche Scientifique) PICS (International program for scientific collaboration) program 1251, and DYETI CNRS contract and Lithoscope French mobile instrumentation. We also thank the Institute of the Earth's Crust RSA, Irkutsk, RCAG, Ulan Bator and DASE/CEA, France for their support. We thank everybody involved in instrumentation preparation, field work and data processing in France, Siberia and Mongolia. The data are available at the sitehttp://bdsis.obs.ujf-grenoble. fr/maintained by C. Pequegnat (Université de Grenoble/CNRS).