HAL Id: hal-03135849
https://hal.archives-ouvertes.fr/hal-03135849
Submitted on 9 Feb 2021
HAL is a multi-disciplinary open access
archive for the deposit and dissemination of
sci-entific research documents, whether they are
pub-lished or not. The documents may come from
teaching and research institutions in France or
abroad, or from public or private research centers.
L’archive ouverte pluridisciplinaire HAL, est
destinée au dépôt et à la diffusion de documents
scientifiques de niveau recherche, publiés ou non,
émanant des établissements d’enseignement et de
recherche français ou étrangers, des laboratoires
publics ou privés.
tectonically active segment of the Main Boundary
thrust: The Dhauladhar Range in the northwestern
Himalaya
Rasmus Thiede, Xavier Robert, Konstanze Stübner, Saptarshi Dey, Johannes
Faruhn
To cite this version:
Rasmus Thiede, Xavier Robert, Konstanze Stübner, Saptarshi Dey, Johannes Faruhn. Sustained
out-of-sequence shortening along a tectonically active segment of the Main Boundary thrust: The
Dhauladhar Range in the northwestern Himalaya. Lithosphere, Geological Society of America, 2017,
9 (5), pp.715 - 725. �10.1130/l630.1�. �hal-03135849�
Thiede_L630
1st
pages
/
1
of
11
Sustained out-of-sequence shortening along a
tectonically active segment of the Main Boundary thrust:
The Dhauladhar Range in the northwestern Himalaya
Rasmus Thiede1, Xavier Robert2, Konstanze Stübner3, Saptarshi Dey1, and Johannes Faruhn1
1INSTITUT FÜR ERD UND UMWELTWISSENSCHAFTEN, UNIVERSITÄT POTSDAM, KARL-LIEBKNECHT-STRASSE 25, HAUS- 27, POTSDAM-14476, GERMANY 2UNIVERSITÉ GRENOBLE ALPES, CNRS (CENTRE NATIONAL DE LA RECHERCHE SCIENTIFIQUE), IRD (INSTITUT DE RECHERCHE POUR LE DÉVELOPPEMENT),
ISTERRE (INSTITUT DES SCIENCES DE LA TERRE), F38000 GRENOBLE, FRANCE
3INSTITUT FÜR GEOWISSENSCHAFTEN, EBERHARD KARLS UNIVERSITÄT TÜBINGEN, TÜBINGEN, GERMANY
ABSTRACT
Competing hypotheses suggest that Himalayan topography is sustained and the plate convergence is accommodated either solely along the basal décollement, the Main Himalayan thrust (MHT), or more broadly, across multiple thrust faults. In the past, structural, geomorphic, and geodetic data of the Nepalese Himalaya have been used to constrain the geometry of the MHT and its shallow frontal thrust fault, known as Main Frontal thrust (MFT). The MHT flattens at depth and connects to a hinterland mid-crustal, steeper thrust ramp, located ~100 km north of the deformation front. There, the present-day convergence across the Himalaya is mostly accommodated by slip along the MFT. Despite a general agreement that in Nepal most of the shortening is accommodated along the MHT, some researchers have suggested the occurrence of persistent out-of-sequence shortening on interior faults near the Main Central thrust (MCT).
Along the northwest Himalaya, in contrast, some of these characteristics of central Nepal are missing, suggesting along-strike variation of wedge deformation and MHT fault geometry. Here we present new field observations and seven zircon (U-Th)/He (ZHe) cooling ages combined with existing low-temperature data sets. In agreement with our previous findings, we suggest that the transect of cooling age pat-terns across the frontal Dhauladhar Range reveals that the Main Boundary thrust (MBT) is a primary fault, which has uplifted and sustained this spectacular mountain front since at least the late Miocene. Our results suggest that the MBT forms an ~40-km-long fault ramp before it soles into the MHT, and motion along it has exhumed rocks from depth of ~8–10 km. New three-dimensional thermokinematic modeling (using Pecube finite-element code) reveals that the observed ZHe and apatite fission track cooling ages can only be explained by sustained mean MBT slip rates between ~2.6 and 3.5 mm a–1 since at least 8 Ma, which corresponds to a horizontal shortening rate of ~1.7–2.4 mm a–1.
We propose that the MBT is active today, despite a lack of definitive field or seismogenic evidence, and continues to accommodate crustal shorting by out-of-sequence faulting. Assuming that present-day geodetic shorting rates (~14 ± 2 mm a–1) across the northwest Himalaya
have been sustained over geologic time scales, this implies that the MBT accommodated ~15% of the total Himalayan convergence since its onset. Furthermore, our modeling results imply that the MHT is missing a hinterland mid-crustal ramp further north.
LITHOSPHERE GSA Data Repository Item 2017241 https://doi.org/10.1130/L630.1
INTRODUCTION
Various orogenic growth models have been proposed to explain the evolution of the central Himalayan tectonic system, spanning more than 1000 km from the Sutlej-Beas region of north-west India into central Nepal, since the Miocene. In general this model of central Himalaya has been used to explain how the Himalaya deform; it is characterized by the exposure of the Hima-layan high-grade metamorphic core, which has been extruded along subparallel shear zones, the Main Central thrust (MCT) and South Tibetan
detachment, active between the early and middle Miocene. This unit terminates in the northwest Himalaya (e.g., DiPietro and Pogue, 2004; Van-nay et al., 2004; Yin, 2006; Webb et al., 2011, and references therein). The central Himalaya (Fig. 1A, inset) is topographically character-ized by a sharp physiographic transition (PT2) (e.g., Hodges et al., 2001; Wobus et al., 2003) between the Lesser Himalayan foothills to the south, having moderate relief and topographic peaks mostly ≤3000 m, and the steeply rising High Himalaya to the north, having high relief and peaks exceeding 6000 m (Lave and Avouac, 2001). Structural, petrologic, and thermochro-nologic studies indicate that above the PT2, exposed high-grade metamorphic rocks have
been rapidly exhumed from mid-crustal depth since the middle-late Miocene. The PT2 corre-lates with major knick zones in orogen-crossing longitudinal river profiles (e.g., Seeber and Gor-nitz, 1983; Duncan et al., 2003), high fluvial inci-sion rates (Lave and Avouac, 2001) and a long-standing (106 yr) erosional gradient (Finlayson and Montgomery, 2003; Olen et al., 2015). This is supported by the fact that the PT2 corresponds to the transition from relatively old mineral cool-ing ages [zircon (U-Th)/He (ZHe) older than 10 Ma, apatite fission track (AFT) older than 5 Ma] in the foothills to young (ZHe younger than 10 Ma, AFT younger than 5 Ma) ages in the High Himalaya (e.g., Blythe et al., 2007; Robert et al., 2009; Herman et al., 2010; Thiede
Rasmus Thiede http://orcid.org /0000 -0003 -1740 -7547
Thiede_L630
1st
pages
/
2
of
11
and Ehlers, 2013). Based on these characteris-tics of the central Himalaya, a debate continues regarding how the wedge is deforming. One of key questions is why the steep and rapidly erod-ing front of the High Himalaya is located ~100 km north from the southern tip of the wedge, defined by the Main Frontal thrust (MFT). This ~30–50-km-wide zone of deep exhumation along High Himalayan front correlates with a belt of clustered microseismicity at depths of 15–25 km (Pandey et al., 1995; Mahesh et al., 2015; Elliott et al., 2016). Some have attributed rapid exhumation to a mid-crustal ramp along the main plate boundary fault, the Main Himala-yan thrust (MHT) (Pandey et al., 1995; Lavé and Avouac, 2001), or underplating and duplex for-mation in the Lesser Himalaya (Bollinger et al., 2004; Herman et al., 2010). Conversely, others have argued for active out-of-sequence thrust-ing along steep splay faults maintainthrust-ing the PT2
front of the High Himalaya (Wobus et al., 2003, 2005; Bai et al., 2016; Whipple et al., 2016). In the central Himalaya, the foothills south of PT2 compose a ~50-km-wide belt of openly folded Lesser Himalayan rocks in the hanging wall of the Main Boundary thrust (MBT), where tec-tonic klippes of High Himalayan crystalline complex (HHC) or Greater Himalayan sequence are preserved locally (e.g., Shimla or Kath-mandu klippe). Between the MBT and active fault systems bounding the Himalayan wedge to the south, the MFT, deformed and uplifted foreland sediments of the Sub-Himalaya are limited to a narrow (~20 km) band. Compet-ing hypotheses suggest that plate convergence is accommodated either predominantly on the MHT-MFT or more broadly across multiple out-of-sequence faults within the Sub-Himalaya, or MBT thrust fault arrays within the wedge in this portion of the orogen.
Domains that structurally deviate from this central Himalayan geometry call into question the application of these models to the entire mountain belt. The northwest Himalaya west from 77°E differ structurally and physiographi-cally from the central Himalaya (DiPietro and Pogue, 2004; Yin, 2006; Deeken et al., 2011; Webb et al., 2011; Webb, 2013). Here the wedge is characterized by a strongly undulating (in map view) topographic front forming large reentrant structures bounded by the MBT, such as the Kangra and Dehradun reentrants (see Fig. 1). In the reentrants, the Sub-Himalayan domain is broadly exposed and as much as 100 km wide, whereas the exposure of Lesser Himalayan rock is limited to a width of less than 10 km. In con-trast to the MBT, the MFT trace is more regular and remains arc parallel. Recent studies indicate that (1) significant crustal shortening is accom-modated by out-of-sequence deformation within
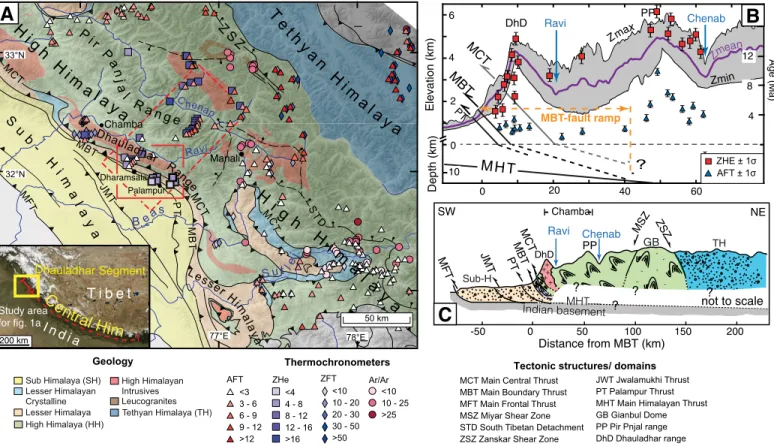
S TD PT MFT M B T MBT JM T MCT M CT M CT Z SZ Ravi C henap B eas S u t le j ! ! ! ! ! ! ! ! ! ! ! ! !! ! ! ! ! ! ! ! !! ! !!! ! ! ! ! ! ! ! ! ! ! ! ! ! !! ! ! ! X X X X X X X X X X XX X X X XX X X X X X X XXX XX X X X X X X X X X X XX X X X X X X X X XXX X XXXXX XXXXXXXXXX " " " " " " " " " " " " " "" " " " " " " "" "" " " " " " " " " # # # # ## # # # # # # # # # # # # # # # # # ## # # # # # # ####### # ## # # ## # ### # ## # # ## ## ## ## # # # # # # # # # # # # # # # # # # # # # ## ## # # ### # # # # # # # # # # # # # # # ## # ## # # # # # # # # # # # # # # # # # # # # # # # # # # # # # # # # # # # # # # # # # # # ####### # # # # # # ## 33°N 78°E 77°E 76°E 32°N 31°N 76°E 76°E 76°E 76°E 76°E 76°E 76°E 76° 76°E666°E 76° 76°E 76°E6°EEEEEEE 7 76°E 76° 7666°E6°EEEEE 7 76°E 7 76°E6°EE 76°EE 7 7 7 76°E 7 7 76°E 76°E 76°EEEEEEE 7 7 76° 76 76°E 76°E 76 76°E 76 76°E6°E 7 7 7 7 7 7 7 766 7 76°E 76°E 76°E 7 7 76 76°E6°E66 7 7 76°E 7 76°E 76 76°E666 76°E 76 7 76 E 7 76666 76 E 76 EE 76 EEE 76 E 76 E 76 76 7 766 76 E 76 E 766E 76 76 7 7666666E 76 EEEE 76 7666 E66666666EEEEEEEEEEEEE 76 E6666666EEEEEEEE 766 E666666EEEEEEEEEE 7 76 76 76EEEE 7666666EEEEEE 31°N 3 31 3 3 3 3 31 31°N 3 3 31°N 31°N 311°N11°N1°N1°N1°N°°N° 31°N°N°N°N 31°N1°NNN 31 3 3 3 3 3 3 3 31 3 311111 311°N1°N°N°NNNNNNNNNN 3 3 3 31°N 3 31°11111 31°N1°N°N° 31°N1°NN 31°N°NNN 3 3 3 3 3 3 31111°N1°N° 31°N°NNN 31 3 3 3 3 31 3 3 3 3 311°1111° 31°N 31°N°NNN 31°N 3 31°N1°N 31°N°°NNN 3 31°N11°NNNNNNNNNNNNNNNNNNNNNNNN 3 NNNNNNNNN 3 3 31NNNNNN 3 NNN 31 NN 31N 3 ++ + + + + + + -- -? ? ? ? MHT MB T MFT MCT DhD PP Ravi Chenab GB 0 50 100 150 200 -50 Distance from MBT (km) SW NE JM T not to scale PT ZS Z Elevation (km) Age (Ma) ZHE ± 1σ AFT ± 1σ ? MHT MCT Ravi PP DhD MBT-fault ramp Zmean Zmin Z max 12 8 4 " # " " " " " " " " " " " " "" " " " " " " # # # # # # # # # # # # # # # # ### Chenab 0 20 40 60 TH Chamba Sub-H 0 10 2 4 6 Depth (km) X X X X X <10 10 - 20 20 - 30 30 - 50 >50 ZFT <3 3 - 6 6 - 9 9 - 12 >12 AFT ! ! ! <10 10 - 25 >25 Ar/Ar " " " " " <4 4 - 8 8 - 12 12 - 16 >16 ZHe # # # # # 50 km Tethyan Himalaya (TH) Lesser Himalayan Crystalline High Himalaya (HH) Lesser Himalaya High Himalayan Intrusives Leucogranites Sub Himalaya (SH) Geology
MCT Main Central Thrust MBT Main Boundary Thrust MFT Main Frontal Thrust MSZ Miyar Shear Zone STD South Tibetan Detachment ZSZ Zanskar Shear Zone
Thermochronometers Tectonic structures/ domains
C
B
A
! ! ! Manali Chamba Dharamsala I n d ia T i b e t Study area for fig. 1a 200 km JWT Jwalamukhi Thrust PT Palampur Thrust MHT Main Himalayan Thrust GB Gianbul Dome PP Pir Pnjal range DhD Dhauladhar rangeCen
tral Him
Dhauladhar Segment " "" "T e
t h
y a
n H
i m
a la
y a
! Palampur MSZ MBT PT S ub - H i m a l a y a Dhaula dhar Ra nge Less er Him ala yaH ig
h H
i m
a la
y a
P ir P an ja l R a n g eH
i g
h H
i m
a l
a y
a
Figure 1. Geology of the northwest Himalaya with a compilation of low-temperature cooling ages. (A) Generalized geologic map modified from Steck (2003) draped over a SRTM (Shuttle Radar Topography Mission) 90 m digital elevation model with new and compiled zircon U-Th)/He (ZHe), apatite and zircon fission track (AFT, ZFT), and white mica 40Ar/39Ar (Ar/Ar) ages. ZHe symbols with black thick frames inside the red rectangle (location of new data) indicate new ZHe data. (For precise sample location of individual ZHe ages see Table 1.) Published low-temperature data (Kumar et al., 1995; Lal et al., 1999; Jain et al., 2000; Schlup et al., 2003, 2011; Thiede et al., 2004, 2005, 2009; Vannay et al., 2004; Deeken et al., 2011). Red dashed rectangle outlines the swath profile (B) and simplified geologic cross section across Chamba (C). (B) Topographic swath profile across Chamba and in the hang-ing wall of the MBT, cutthang-ing perpendicular to the major morphotectonic units. AFT and ZHe data are projected onto the transect (plotted with respect to their age and not their sample elevation). Bold blue line (Z mean) denotes mean elevation, whereas black lines (Z min/Z max) are minimum and maximum elevations. Note the scale change of the depth below sea level and elevation. Orange dashed line indicates the breadth of the MBT fault ramp based on the extent of young AFT ages despite large elevation changes. JMT—Jwalamukhi Thrust. (C) Simplified geologic cross section parallel to swath profile in B, modified after Steck (2003). The detailed geometry of the geologic units and structures at deeper crustal levels is not well known.
Thiede_L630
1st
pages
/
3
of
11
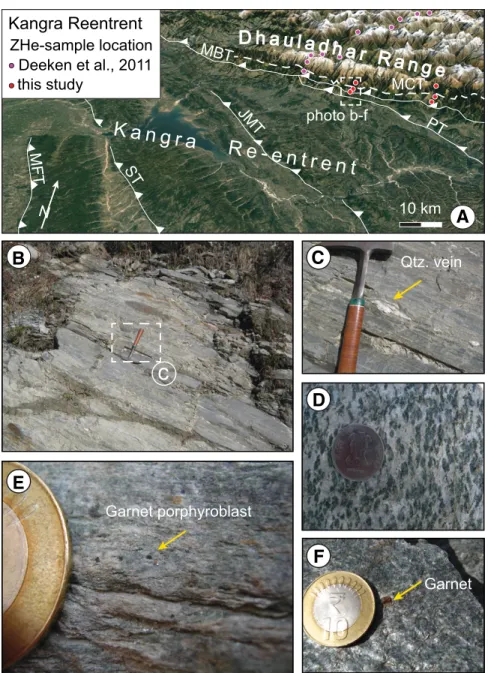
the Sub-Himalaya (Powers et al., 1998; Thakur et al., 2014; Dey et al., 2016), and (2) ongoing exhumation occurs in the hanging wall of the MBT (Deeken et al., 2011). Improved knowl-edge of the main fault geometries and activity of the wedge is essential to understand the lateral variation in growth of the Himalayan orogenic belt and where crustal shortening is accommo-dated within the wedge other than along the MFT. In this study we focus on a transect across the northwestern Himalaya, 100 km northwest of the Sutlej River, the western termination of central Himalayan tectonic regime (Figs. 1B and 2; DiPietro and Pogue, 2004; Vannay et al., 2004). Specifically, we focus on the Kangra reentrant, the Dhauladhar Range, located in the MBT hanging wall, and the Chamba region in the western Himachal Pradesh, India (Fig. 1). We report seven new ZHe ages that
comple-ment previously published ZHe and AFT ages (Deeken et al., 2011) to better constrain the tem-poral and spatial evolution of the 100-km-long segment within the wedge. By combining phys-iographic analyses, new and available thermo-chronologic data, and three-dimensional (3D) thermokinematic modeling, we test the applica-bility of varying fault geometries to explain the obtained cooling age pattern. More specifically, we constrain the geometry and depth and length of the MBT fault ramp and the MHT. Using Pecube (finite-element code) thermokinematic modeling (Braun, 2002b; Robert et al., 2011; Braun et al., 2012), we obtain better control on estimates of average MBT fault displacement rates, indicating Quaternary faulting. We con-strain the spatial distribution of crustal shorting across the northwest Himalaya since the late Miocene, which differs significantly from short-ening patterns in the central Himalaya. GEOLOGIC SETTING OF THE
NORTHWEST AND CENTRAL HIMALAYA The Himalaya range is an orogenic wedge formed by stacking thrust sheets scraped off the Indian crust as it was driven beneath the Tibetan Plateau to the north. All thrust faults within the wedge are assumed to sole into the plate bound-ing main basal décollement, the MHT (e.g., Hauck et al., 1998; Stevens and Avouac, 2015; Gao et al., 2016). Approximately 20 mm a–1 of Indian-Eurasian convergence is accommodated across the central Himalayan wedge and ~14 mm a–1 across the northwestern Himalaya (Kundu et al., 2014; Stevens and Avouac, 2015). The central Himalayan wedge is divided into fault-bound tectonostratigraphic units exposed from south to north. The MFT delineates the southern-most front of the wedge (Fig. 1C), forming the present-day surface-rupturing ramp of the MHT,
and has accommodated the majority of crustal shortening over the past ~2 m.y. (e.g., Powers et al., 1998; Lavé and Avouac, 2000; Jouanne et al., 2004). In its hanging wall, the Sub-Himalayan fold-thrust belt is bounded to the north by the MBT. The Lesser Himalayan rocks in the MBT hanging wall are unmetamorphosed to moder-ately metamorphosed Proterozoic to Eocene
sedimentary cover of the Indian basement (e.g., Gansser, 1964; Hodges, 2000; Webb et al., 2011). Further to the north, the MCT separates the high-grade metamorphic HHC complex. In the central Himalaya, a 20–30-km-wide transition zone of microseismic activity has been recorded ~100 km north of the surface trace of the MFT and beneath the location where the MCT is exposed
c
Qtz. vein
Garnet
Garnet porphyroblast
10 km
N
this study
Deeken et al., 2011
ZHe-sample location
Kangra Reentrent
MCT
photo b-f
K a n g r a Re
- e n t r e n t
D h a u l a d h ar R
a n g e
A
C
B
E
D
F
Figure 2. Google-Earth images showing the Sub-Himalaya of the Kangra reentrant and south-ern Dhauladhar Range front and field photos exhibiting typical rocks observed across the Main Boundary thrust (MBT) hanging wall. (A) Dhauladhar Range to the north and Kangra Basin as part of the Sub-Himalaya to the south (looking north-northwest); white lines denote approximate positions of the range-bounding faults. Note the proximity of the MBT and Main Central thrust (MCT). See Figure 1 legend for the name of the other structures and domains. (B–C) Strongly deformed and sheared quartz veins in schists exposed in near the MBT. C is magnification of B. (D) Knotenschiefer (i.e., contact metamorphic slate containing subspheri-cal clots of minerals) close to the inactive MCT fault zone. (E–F) Garnet porphyroblasts in phyllitic schists of the MCT hanging wall.
Thiede_L630
1st
pages
/
4
of
11
at the surface (Pandey et al., 1995; Mahesh et al., 2015). In the past this has been interpreted to be located between the seismically active segment to the south and the aseismic segment to the north, and has been determined to be a ~20° dipping hinterland mid-crustal ramp in the MHT (Cattin and Avouac, 2000; Grandin et al., 2015; Elliott et al., 2016). North of the HHC, the Sangla and Zanskar shear zones represent regional segments of the South Tibetan detach-ment, juxtaposing the low-grade metamorphic basal section of the Tethyan Himalayan strata, the Haimantas, over the high-grade HHC (e.g., Dezes et al., 1999).
LOCAL GEOLOGY AND FIELD OBSERVATIONS
Himalayan seismotectonic studies (Seeber et al., 1981; Rajendra Prasad et al., 2011) and balanced cross sections across the northwest-ern Sub-Himalaya (Yeats et al., 1992) account for what is known about the MHT fault geom-etry in the northwest Himalaya. The MHT fault includes several flat and ramp segments. The southernmost segment of the MHT, referred to as MFT, dips ~15° northeast until a depth of ~4 km, where it bends into a 3°–5° north-dipping basal décollement (Powers et al., 1998). The surface trace of the MBT at the base of the Dhauladhar Range intersects the MHT at a depth of ~8 km below the surface. Further north, the MHT is assumed to form a flat décollement that contin-ues 50–100 km north beneath the High Hima-laya and Tethyan HimaHima-laya (Rajendra Prasad et al., 2011). A notable scatter in microseismic activity spreads over an 80-km-wide region north of the MBT trace and may be related to the north-dipping MBT fault ramp or the MHT flat (Rajendra Prasad et al., 2011; Gahalaut and Kundu, 2012). In the Kangra sector, the Hima-layan mountains rise abruptly from the Sub-Himalaya with elevations <1000 m above sea level (asl) to a series of peaks exceeding 5000 m asl forming the crest lines of Dhauladhar and Pir Panjal Ranges (Figs. 1A, 1B). Here, whereas the Sub-Himalaya is a 100-km-wide belt in the Kangra reentrant, the Lesser Himalaya units form a narrow (4–5 km) belt between the MBT and the MCT along the topographic front of the mountain range. Weakly to moderately meta-morphosed sedimentary rocks of the Haimantas Group crop out in the hanging wall of the MCT in the Chamba syncline. The Haimantas Group consists of an ~8-km-thick, continuous turbidite sequence of late Precambrian to early Paleozoic age and is correlated with the Phe Formation at the base of the Tethyan Himalaya in Zans-kar (Frank et al., 1995; Fuchs and Linner, 1995, and references therein). The Haimantas Group is
folded into large, open anticlines and synclines with amplitudes of several kilometers and forms the High Himalayan nappe in the MCT hanging wall (Frank et al., 1995). Exposure of high-grade metamorphic crystalline units is limited to the Kishtwar and Kullu-Rampur tectonic windows, located toward the northwest and east of our study area, respectively (Figs. 1B and 2). In contrast to the high-grade metamorphic HHC in the central Himalaya, at the Kangra reen-trant the MCT juxtaposes intermediate-grade metamorphic Haimantas Group onto low-grade Lesser Himalayan sediments (Frank et al., 1995; Yin, 2006). This could be related to a lateral ramp within the MCT, such that the MCT cuts upsection from the central Hima-laya to Chamba (Steck, 2003). Alternatively, the HHC in Chamba could form a southward-thinning wedge between the Tethyan Himalaya at the top and the Lesser Himalaya at the base, in which case the MCT would simply represent the original flat-over-flat relationship between the Tethyan and Lesser Himalaya when the HHC was thrust over the Lesser Himalaya (Yin, 2006). In the Lesser Himalayan rocks exposed above the MBT (southern flanks of the Dhauladhar Range both located north of Dharamsala and Palampur; Fig. 1), we observe strongly sheared quartz veins in phyllites and prominently developed layer-parallel schistosity suggesting strongly sheared rocks at lower and moderate greenschist facies conditions (see Figs. 2B, 2C). Brittle fault planes and regional schistosity dip ~33°–38°NE. In addition, we observed millime-ter-sized garnet porphyroblasts in mica schists further up the sections and at the base of the MCT hanging wall (just a few kilometers stratigraphi-cally upsection from the MBT; Fig. 2D), which we relate to Barrovian metamorphism prior to early Miocene MCT activity. These observations indicate an inverse metamorphic gradient across the MBT that suggests that the MBT has accom-modated significant displacement.
Previous Work on Cooling History of the Dhauladhar Range and Motivation
Previous publications (Deeken et al., 2011; Adlakha et al., 2013) provide key information about the cooling history of the Dhauladhar Range; however, the sparse sampling along the base of the Dhauladhar Range front, did not allow them to constrain exhumation depth. It could not be ascertained if the Pliocene ZHe ages were fully reset and if they were exhumed from below the ZHe partial retention zone, or whether they were within the ZHe partial reten-tion zone for a prolonged period of time; the answer to this provides key information on the MBT fault geometry (length and depth) and
constrains the amount of exhumation accom-modated by the MBT.
METHODS Thermochronology
We analyzed seven samples from Lesser Himalayan units, the Haimantas metasediments, and Paleozoic intrusive rocks from the MCT hanging wall along the Dhauladhar Range front (Figs. 1 and 3). Sample preparation and analytic details are provided in the Data Repository1. 3D Thermokinematic Modeling: Pecube
We have used Pecube thermokinematic mod-eling (Braun, 2003; Braun et al., 2012) to inves-tigate probable time-temperature paths of the MBT hanging-wall rocks, constrain the onset of faulting, estimate mean MBT fault displace-ment rates, and test different geometries of the frontal segments of the MBT.
Time-temperature paths reflect the rock exhumation histories, which are controlled by the particle pathways within the orogenic wedge, i.e., they record the interaction between tectonic transport and erosion (Stuwe et al., 1994; Manck-telow and Grasemann, 1997; Braun, 2002b; Ehlers, 2005; Braun et al., 2012). For example, when rocks move over a ramp within a thrust fault, the transport vectors attain a significant vertical component, which results in rock uplift, builds topography, and drives erosion (Stuwe et al., 1994; Mancktelow and Grasemann, 1997; Braun, 2002b). The thermal field of the upper crust is therefore strongly disturbed resulting in both vertical and lateral heat transport (Hunting-ton et al., 2007) and can be quantified with a 3D thermokinematic model such as Pecube (Braun, 2003; Braun et al., 2012).
For Pecube modeling, we developed a series of different possible MHT-MBT-MFT geom-etries that satisfy the constraints of studies from Powers et al. (1998), Frank et al. (1995), Steck et al. (1993), Steck (2003), and Rajendra Prasad et al. (2011). However, especially north of the MBT trace, the MHT geometry is poorly con-strained due to lack of available seismic data. Model Setup
We used the 2012 modified version of Pecube (Braun, 2003; Braun et al., 2012), a finite element
1 GSA Data Repository Item 2017241, which contains
Supplemental figures S1–S6 and one supplemental table providing the analytic details about ZHe dating and about the Pecube modelling and data applied, is available at http://www.geosociety.org /datarepository /2017, or on request from editing@geosociety.org.
Thiede_L630
1st
pages
/
5
of
11
code that solves the three-dimensional heat trans-port equation in a crustal block affected by verti-cal and/or horizontal material transport. In its for-ward mode, Pecube predicts thermochronologic age distributions [e.g., apatite (U-Th-Sm)/He, ZHe, AFT] that result from a prescribed velocity field defined by fault geometries and slip veloci-ties and a stable or evolving topography. Inverse modeling explores a parameter such as a range of slip velocities or fault dip angles. For each combination of parameters, the misfit between the model predictions and a cooling ages data set is computed using a chi-squared approach, which indicates the best-fitting parameter set.
The dimensions of our Pecube model are 320 × 50 × 25 km (length, width, depth); the model is oriented 25° north-northeast and includes the MBT, the MFT, and their common north-north-east–dipping low-angle sole thrust, the MHT (Fig. S1). The faults trend perpendicular to the long axis of the model, and all horizontal particle motion is parallel to the model swath.
Fault-slip rates were derived from present-day global positioning system–based conver-gence rates (Schiffman et al., 2013; Kundu et al., 2014; Stevens and Avouac, 2015) corresponding to 14 mm a–1 in the direction of model transport. We assume that present day convergence rates have not changed significantly since ca. 10 Ma (Molnar and Stock, 2009; Copley et al., 2010). Following previous thermokinematic modeling approaches (Bollinger et al., 2004; Robert et al., 2009; Herman et al., 2010), we split the total convergence rate of 14 mm a–1 into underthrust-ing of the Indian plate below the MHT and over-thrusting of MBT and the MFT. In particular, we set the underthrusting rate to a constant value
of 5 mm a–1 for the duration of the model runs, while the remaining 9 mm a–1 are along the MFT minus a fraction accommodated by the MBT.
We assume that the rock uplift resulting from overthrusting is compensated by denuda-tion such that the topography remains constant throughout the model runs (Robert et al., 2009; Herman et al., 2010) and evaluate this in the model sensitivity section below. We imposed the following constraints on fault activity: (1) ZHe ages obtained from high elevations (>3000 m) across the studied range yield old ages (18– 12 Ma; Figs. 1 and 3); (2) activity along the MBT was established between ca. 8 and 10 Ma (Meigs et al., 1995; Brozovic and Burbank, 2000; DeCelles et al., 2001). We assumed 10 Ma as a minimum onset time for the MBT. Model runs start at 18 Ma and are subdivided into three peri-ods. During period 1 (18–12 Ma), the MBT is not active; all shortening is accommodated along the MFT (velocity, VMFT = 9 mm a–1). Particles that are not thermally reset during subsequent steps can yield 18 Ma cooling ages. During period 2 (12–8 Ma), the MBT starts at a velocity of VMBT = 1 mm a–1 and most overthrusting is accommo-dated along the MFT (VMFT = 8 mm a–1). During period 3 (8–0 Ma), the MBT full fault activity occurs at variable rates (VMBT = 1–5 mm a–1). Present-day topography was determined from the 90 m Shuttle Radar Topography Mission digital elevation model version 4.1 (Jarvis et al., 2008). We used rock thermal diffusivity mea-surements of Thiede et al. (2009) and inferred values for all other physical parameters of the rocks within geologically meaningful ranges (see Data Repository Table 1). The thermal dif-fusivity ranges between 28 and 60 km2/m.y. The
mean surface temperature at elevation, Z = 0 m, was set to 20 °C, and the atmospheric lapse rate was set to 6 °C/km. (For further details, see Data Repository Figs. S2–S6).
RESULTS
Thermochonology
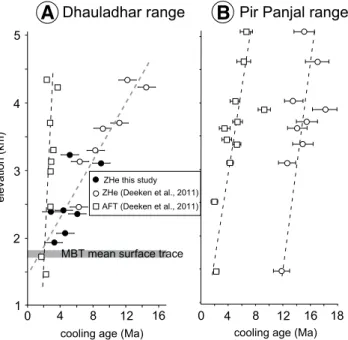
The new ZHe ages are obtained from eleva-tions of 1.9–3.1 km asl and range between 3.0 ± 0.2 and 6.7 ± 1.2 Ma (Table 1). In combination with previously published ZHe and AFT cooling ages (Deeken et al., 2011), these data compose a densely sampled 80-km-long range-perpendicu-lar transect across the hanging wall of the MBT (Fig. 1). Deeken et al. (2011) found out that AFT and ZHe cooling ages reveal marked variations in long-term exhumation rates between the humid frontal range, with very young (younger than 4 Ma), elevation-invariant AFT ages obtained in a ~40-km-wide zone, and the semiarid orogen inte-rior, where AFT and ZHe ages are older (11.8 ± 1.2 and 18.1 ± 1.8 Ma) and increase with sample elevation (Fig. 3). The previously published ZHe ages confirm southward-younging cooling age trends (15 ± 3 Ma in the interior to 8 ± 6 Ma in the frontal ranges). These differences have been attributed to lateral heat advection resulting from southward thrusting on the MHT and MBT faults (Deeken et al., 2011). We interpret the elevated ZHe ages (older than 10 Ma, >3.7 km asl) in the Dhauladhar and Pir Panjal Ranges (Fig. 3A) as related to exhumation and cooling due to the ter-minal MCT fault activity in the middle Miocene and to having stayed in the partial retention zone and above closure temperature since then. The ZHe ages, obtained from high elevation, date the end of MCT thrusting by ca. 15 Ma and record the final stage of exhumation and cooling of MCT termination. All deformation since then is accom-modated by the MHT-MBT-MFT fault system. If correct, this implies that the rocks yielding ZHe ages younger than 10 Ma are at least partially or fully reset since the onset of the MBT activity and document the onset of MBT faulting along Hima-layan range front in this domain. Previous work showed that across the Pir Panjal Range both thermo chrono meters have similar age-elevation relationships (Fig. 3). Exhumation rates do not change significantly within the confines of the data resolution. Exhumation is slower, with lower cooling rates in the range interior. Furthermore, this longer transition through the ZHe partial retention and AFT annealing zone may explain some of the observed scatter (Fig. 1C). Deeken et al. (2011) suggested that this exhumation variability within Chamba was best explained as the result of continuous thrusting along a major basal décollement, with a flat beneath the
0 4 8 12 16
1 2 3 4
ZHe (Deeken et al., 2011) ZHe this study AFT (Deeken et al., 2011)
cooling age (Ma)
elevation (km)
5
0 4 8 12 16 18
A
Dhauladhar range
B
Pir Panjal range
MBT mean surface trace
cooling age (Ma)
Figure 3. Updated age-elevation plot from the Dhauladhar Range and Pir Panjal Range modified after Deeken et al. (2011). Green dots show new ZHe [zir-con U-Th)/He] ages. Note the difference of the age elevation trends. (A) Apa-tite fission track (AFT) and ZHe data from the Dhaulad-har Range, where AFT data yield approximately the same age, despite large elevation difference, while the ZHe data show a clear elevation dependence. MBT—Main Boundary thrust. (B) Age-elevation trends of Pir Panjal Range are approximately parallel, indicating moderate and constant exhumation rates.
Thiede_L630
1st
pages
/
6
of
11
slowly exhuming internal compartments and a steep frontal ramp below the rapidly exhuming frontal range. Their 1D thermal modeling sug-gests Pliocene–Pleistocene mean erosion and exhumation rates of 0.8–1.9 mm a–1 across the frontal Dhauladhar Range and 0.3–0.9 mm a–1 for the orogen interior Pir Panjal Range over the past ~15 m.y. Deeken et al. (2011) concluded that the frontal Dhauladhar Range was sufficiently high during this time to build an orographic barrier, focusing climatically enhanced erosional pro-cesses and tectonic deformation there. All these results imply a subhorizontal flat northward-dipping MHT below the Pir Panjal Range and no hinterland mid-crustal ramp. However, due to their sparse sampling resolution as well as the strong thermal disturbance caused by rapid lateral and vertical material transport, Deeken et al. (2011) were not able to recognize the main fault accommodating exhumation, ascertain the precise depth of exhumation, or estimate well-constrained exhumation rates.
Pecube-Forward Model Runs
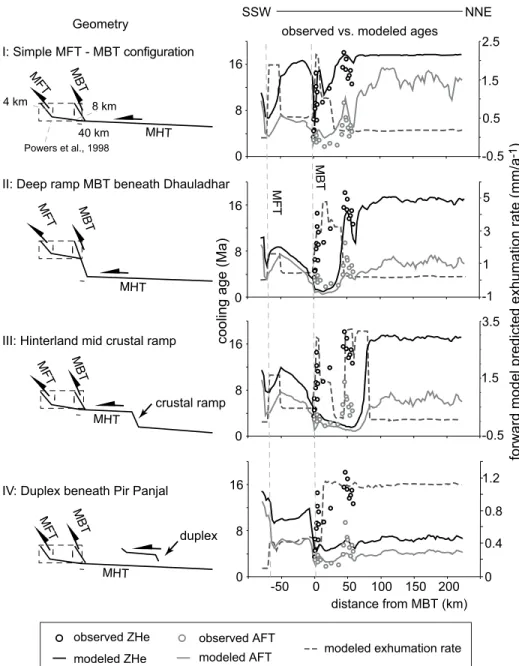
Within the first series of forward model runs, we evaluated four different fault geometry mod-els of the Himalayan wedge for their plausibility (Fig. 4). We compared the model-predicted age
patterns with the observed data (Fig. 4). Models III (hinterland ramp in MHT) and IV (duplex) produce a distinct and broad zone of high exhu-mation rates above the ramp or duplex, result-ing in a broad zone of young coolresult-ing ages, in contradiction to available age data. For example, models III and IV do not predict mid-Miocene ZHe ages across the Dhauladhar Range and Pir Panjal Range at higher elevations; therefore, these models were not explored further. Model II, with the MHT ramp below the Dhauladhar Range, predicts Quaternary ZHe ages across the entire Dhauladhar Range that are younger than observed, and therefore this model is also dismissed. Only model I, in which the MBT branches off the flat MHT herein, referred to as simple MFT-MBT configuration, predicts cool-ing age patterns similar to the observations.
For simple MFT-MBT configuration, we explore various geometric and kinematic param-eters: (1) variable MBT fault slip rate during period 3 (1–5 mm a–1); (2) variable dip angle of the MBT fault ramp (20°–60°); and (3) variable basal temperature (600–1000 °C) (Fig. S4). We find that 2–4 mm a–1 slip rates along the MBT ramp, 40°–45° dip of the MBT ramp, and basal temperatures of 750–800 °C (Fig. S4c) yield the lowest mismatch between predicted and observed
ages using the forward modeling approach. In summary, the forward models suggest that the MBT fault must sole into the MHT to obtain Pliocene reset ZHe ages at the base of southern Dhauladhar Range front. The junction between MBT and MHT must be located ~30–40 km to the north of the fault trace to reproduce AFT cooling of <3 m.y. invariant with the elevation across the entire Dhauladhar Range (Fig. 1B).
Inverse Modeling
The forward models reveal the primary geom-etry of the MHT, MBT, and MFT. In order to further constrain the fault slip rates and explore the sensitivity of the model to the assumed ther-mal parameters, we performed inverse model-ing usmodel-ing the Neighborhood algorithm by Sam-bridge (1999), following the methods presented by Robert et al. (2011), Braun et al. (2012), and Carrapa et al. (2016) to explore the parameter space with lowest misfits. We explored the fol-lowing four parameters with boundaries cho-sen to keep a geologically consistent model: (1) the MBT overthrusting rate (1–4 mm a–1); (2) the basal temperature (600–1200 °C); (3) the internal heat production (0–45 °C/m.y.); and (4) the thermal diffusivity (25–60 km2/m.y.). We compare thermochronologic data (αi,dat)
TABLE 1. U, Th, AND He DATA FROM SINGLE-GRAIN ZIRCONS FROM THE SOUTHERN FLANKS OF THE DHAULADHAR RANGE, NORTHWEST INDIA, HIMALAYA Sample Grain Rock type Lat Long Altitude
(m) 238U (ppm)
232Th
(ppm) eU Th/U (mol)4He Blank (%) He age (Ma) correctionFt Corrected He age (Ma) Average Age (Ma) SD 1σ RT13-33 5 Metagranite 32.16261 76.55833 2430 1565.0 205.3 1613.3 0.13 2.16E-13 0.139 2.3 0.8 2.7 6 1989.4 430.5 2090.6 0.22 5.96E-13 0.050 2.8 0.9 3.3 9 1842.5 349.6 1924.6 0.19 2.21E-13 0.179 2.3 0.8 2.9 3.0 0.3 0.2 RT13-27 5 Metagranite 32.18478 76.55933 1955 1002.7 162.0 1040.8 0.17 2.67E-13 0.110 3.4 0.8 4.1 6 883.1 291.0 951.5 0.34 1.56E-13 0.187 3.5 0.8 4.4 7 1000.5 86.0 1020.7 0.09 1.54E-13 0.237 3.0 0.8 3.7 9 756.3 1291.7 1059.8 1.75 1.08E-13 0.367 3.1 0.8 3.9 4.0 0.3 0.1 RT12-37 4 Metagranite 32.17687 76.54966 1930 2564.6 205.1 2612.8 0.08 1.78E-12 0.022 3.0 0.9 3.4 6 1127.8 492.4 1243.5 0.45 2.65E-13 0.138 2.3 0.8 2.7 7 1462.4 180.0 1504.7 0.13 2.15E-13 0.133 2.7 0.8 3.4 8 1268.5 488.4 1383.3 0.39 3.94E-13 0.074 2.8 0.9 3.2 10 1124.7 373.4 1212.5 0.34 2.69E-13 0.109 3.4 0.8 4.1 3.4 0.5 0.2
AD09-35 3 Garnet mica
schist 32.18047 76.68947 3110 388.7 102.6 412.8 0.27 8.81E-14 0.324 6.8 0.8 9.0 4 838.3 221.8 890.4 0.27 1.15E-13 0.254 4.0 0.8 5.2
5 1024.4 274.5 1088.9 0.27 2.99E-14 0.968 4.2 0.7 5.8 6.7 2.0 1.2
AD09-38a 23 Metagranite 32.12808 76.67400 1920 1292.0769.6 356.5231.1 1346.3853.3 0.480.18 8.80E-141.39E-13 0.2850.449 2.24.6 0.80.8 6.12.7 4 719.2 231.9 773.7 0.33 4.07E-14 0.715 2.8 0.8 3.7 6 1370.0 191.4 1415.0 0.14 2.70E-13 0.108 2.6 0.8 3.1 8 732.7 166.6 771.8 0.23 1.29E-13 0.222 3.9 0.8 4.8 4.1 1.4 0.6 RT12-38 1 Gneiss 32.16161 76.54948 1930 473.3 167.2 512.6 0.36 1.85E-13 0.215 6.5 0.8 8.0 3 2195.2 438.8 2298.3 0.21 1.24E-13 0.320 3.2 0.8 4.2 2 2693.6 315.9 2767.8 0.12 1.45E-13 0.274 2.5 0.8 3.2 5.1 2.5 1.5
AD09-37 1 Metagranite 32.16124 76.69226 2411 974.1 187.9 1018.2 0.20 2.04E-13 0.195 3.5 0.8 4.4 2 1034.0 213.6 1084.2 0.21 6.80E-13 0.058 6.9 0.8 8.2
3 1952.4 438.3 2055.4 0.23 5.73E-13 0.069 4.5 0.8 5.7 6.1 1.9 1.1 Note: Ft—fission track; SD—standard deviation. Bold indicates averages of all measurements for each sample.
Thiede_L630
1st
pages
/
7
of
11
and predictions (αi,mod) with a misfit function defined by: Φ =
(
−)
=∑
1 2 2 1 N i i dat i i N α α σ ,mod , , (1)where N is the number of data points and σi is the uncertainty of the data. For each inversion, we ran 106–312 models.
The best-fit solutions are insensitive to ther-mal parameters kept in geologically meaningful ranges (Fig. S6). Predicted cooling ages are con-trolled mostly by the kinematic field imposed by the MBT slip velocity. For the given MBT geometry (40° dip to a depth of 10 km; 5° dip-ping MHT), an MBT slip rate of 2.6–3.6 mm a–1 yields the lowest misfit (Fig. 5).
Evaluation of Model Sensitivity
Using best-fit parameters obtained from the numerical inversions (Table 2), we investigate the effect of denudation-induced topographic amplification on the isotherms within the crust. Pecube models allow exploration of the effects of an evolving topography through time through two controls: (1) the topography can be shifted by a vertical offset between two model steps allowing simulation of surface lowering or uplift; and (2) the present-day topography can be multiplied by an amplification factor such that for a factor >1 the relief is amplified, and for a factor <1, the relief is reduced (see Braun, 2003, Carrapa et al., 2016, for detailed explana-tions). We explored the effects of variable onset time of MBT activity and of variable evolution
16 8 0 -50 0 50 100 150 200 distance from MBT (km) 16 8 0 16 8 0 16 8 0
Geometry observed vs. modeled ages
1.2 0.8 0.4 0 -0.5 1.5 3.5 -1 1 3 5 -0.5 0.5 1.5 2.5 I: Simple MFT - MBT configuration
II: Deep ramp MBT beneath Dhauladhar
III: Hinterland mid crustal ramp
IV: Duplex beneath Pir Panjal
crustal ramp
duplex
cooling age (Ma
)
forward model predicted exhumation rate (mm/
a -1) SSW NNE Powers et al., 1998 8 km 4 km 40 km
observed ZHe observed AFT
modeled ZHe modeled AFT modeled exhumation rate
Figure 4. Pecube (see text) fault geometries with motions and forward modeling results along the ages transect (Fig. 1B). Right panel compares observed and model predicted cooling ages with respect to the different fault geometries described in the left panel; arrows indicate the sense of motion along the faults. Dots repre-sent projected and measured data points, and lines show the predicted mean age over the full width (50 km) at sample location. The dashed line represents the predicted mean exhumation rate with respect to the Main Boundary thrust (MBT). MHT—Main Himalayan thrust; MFT—Main Fron-tal thrust. 5 6 7 8 9 4 3 2 1 5 10 VMBT (km/m.y.) 3.6 3.2 2.8 2.4 2.0 1.6 1.2 0.8 5 4 3 2 1 4 3 2 1 0 Misfit 0 Misfit VMFT (km/m. y. )
Figure 5. Selected results of the inverse model runs. MBT—Main Boundary thrust; MFT—Main Frontal thrust. Velocity, VMBT, is function of the mis-fit value or a 2 parameter space inversion (VMFT and VMBT). In this case, the other parameters are fixed to their best values inferred from Figure S6) and discussed in the text. White star shows the location of the best-fit model reported in Table 2.
TABLE 2. OPTIMIZED PARAMETER COMBINATION
parameter
V, MBT (mm/yr) 2.6–3.6 V, MFT (mm/yr) 6.4–5.4 Basal T (°C) 600–780 Internal heat (°C/m.y.) 10–25
T diffusion (km2/m.y.) 37–47 Dip, MBT (°) 35–45
Note: V—velocity; T—temperature; MBT—Main
Thiede_L630
1st
pages
/
8
of
11
of the topography between 10 and 2 Ma using a suite of models designed to simulate different scenarios of faulting and its topographic evolu-tion (Fig. 6).
The first scenario (Fig. 6A) illustrates the effects of variable onset timing on MBT activ-ity and topographic growth during the whole models. We assume a growing topography that begins before the increase of the fault activity. For example, preexisting topography could be explained by previous (early to middle Miocene) shortening across the MCT and therefore could have been established prior to 15 Ma. In all sub-scenarios, 50% of the present-day topography has been achieved by 10 Ma. When the MBT achieves its full activity, the modern topography is already established.
In the second scenario (Fig. 6B), the growth of topography is induced by the initiation of the MBT faulting. In the different subscenarios, the MBT and topographic growth start together abruptly at different given times after a flat ini-tial topography.
Throughout the third scenario (Fig. 6C), the topographic evolution is decoupled from the onset of faulting. Here we assume that the topog-raphy remains constant and equal to the modern topography since the onset of the model.
The last scenario (Fig. 6D) comprises rapid relief growth after the onset of the MBT activ-ity. It accounts for the interior part (Pir Panjal Range) of the model, where the relief growth should decrease through time due to the effec-tive orographic shielding induced by the rising range front.
In summary, all these scenarios reveal that the MBT has to be active for at least ~8 m.y. to reproduce the observed cooling age pattern, except for the third scenario (Fig. 6C), in which it is achieved after 6 m.y. This value seems to be the response time of the MBT activity to establish the needed thermal field perturbation of the crust to produce the observed age pat-tern (Deeken et al., 2011). These models show that changes in topography have little impact on the predicted cooling ages. A time-invariant
behavior of the predicted ages is achieved after 6–8 m.y., meaning that the landscape is close to exhumational steady state (Willett and Bran-don, 2002). The third scenario (Fig. 6C) also predicts ages that are too young. The amplitude of topography needs to have been lower prior to the late Miocene. In contrast, the first and second scenarios yield ZHe ages that are too old. They thus indicate that some topography was probably established prior to the MBT activity and/or fault displacement rates of the MBT were >3 mm/yr. DISCUSSION
We combined field observations, structural information, thermochronologic data, and thermo kinematic modeling to explore ongoing faulting and rapid rock exhumation of the MBT hanging wall along the Dhauladhar Range in the northwest Himalaya. We have conducted sensitivity tests to evaluate minimum onset time of faulting, transferred fault displacement rates into related exhumation rates as well as
10
8
6
4 2
10 8 6 4 2 5 4 3 1 MFT MBT MFT MBT Pir Panjal Dhauladhar Pir Panjal DhauladharD
10
8
6
4 2
10 8 6 4 2C
10
8
6
4 2
10 8 6 4 2B
10
8
6
4 2
10 8 6 4 2 13A
16 12 8 4thermochronometric age [Ma]
0.0 0.5 1.0 2.9
V
MBT[mm/yr]
topo. amplification
0.0 0.5 0.8 1.0 MBT onsettimeline [Ma]
Apatite FT
Zircon (U-Th)/He
Figure 6. Sensitivity tests exploring different Main Boundary thrust (MBT) onsets and the effects of topographic evolution on thermal structure of upper crust. MFT—Main Frontal thrust; V—velocity; FT—fission track; topo—topographic. The plots show that with preexisting topography, it is likely to obtain model predicted ages, in agreement with the observed ones. Note that the model has to run 6–8 m.y. until the observed patterns are approxi-mately achieved.
Thiede_L630
1st
pages
/
9
of
11
estimated its contribution to the total shorten-ing across the Himalaya. This settshorten-ing and these results are strikingly different from most other transects through the MBT further east along strike of the Himalaya.
Field Observations, Horizontal Extent of MBT Fault Ramp, and Their Implications for MBT Activity
In agreement with earlier findings from neighboring sections (Frank et al., 1995), we observed greenschist metamorphic rocks in the hanging wall of the MBT versus unmetamor-phosed rocks in the footwall. In the footwall of the MBT, rocks related to the Subathu and Dharamsala Formations are exposed, and are bound to the south by the Palampur thrust (PT, Figs. 1 and 3), which trends parallel to the MBT strike (Fig. 2) (Ranga Rao, 1989; Powers et al., 1998). However, these rocks are internally only
slightly deformed, they show no metamorphic overprinting, and they are thrust over the Upper Siwaliks strata. An estimated total fault displace-ment ranges between 5 and 7 km (the thickness of the Siwalik strata in the region). This is in clear contrast to observations made by Najman et al. (2009), who described the MBT hanging wall at the eastern end of the Kangra reentrant as consisting of unmetamorphosed rocks and illustrating significant lateral variation in the mean fault displacement and exhumation of the MBT hanging wall along strike; their findings were consistent with many other MBT segments (Gansser, 1964; Valdiya, 1980a; Hodges, 2000). In summary, the observed change in metamor-phic grade across the MBT fault zone in the Dhauladhar area suggests that within this sector of the northwest Himalaya, the MBT has acted as a primary fault. Furthermore, to a distance of ~40 km north of the MBT trace, the AFT ages appear to be elevation invariant; this suggests a high vertical rock uplift component and a strong perturbation of its closure isotherms. Such a per-turbation of the thermal field likely corresponds to an ~40 km horizontal length of the MBT fault ramp that merges directly into the MHT north of the Dhauladhar Range (Fig. 1B), forcing the rocks to uplift and cool rapidly with erosion rates high enough to keep up with this. It seems that the topographic wavelength of the Dhaulad-har Range exceeds the critical wavelength of the AFT isotherm (Braun, 2002a).
Forward and Inverse Thermokinematic Modeling and Fault Geometries
We tested several fault geometries of the northwestern Himalayan wedge using forward thermal models. Only scenario I (Fig. 4), where
an imbricated MBT fault ramp roots into the MHT, could explain the observed cooling pat-tern derived from the low-temperature thermo-chronology data (geometry I, Fig. 4). Neither a hinterland MHT ramp geometry (scenario III, Fig. 4) nor a duplex beneath the Pir Panjal Range was sufficient to reproduce the observed cooling age pattern (scenario IV, Fig. 4). The exhumation rates obtained from such geom-etries are too high and they yield model ages that are too young. Therefore, we interpret the Dhauladhar Range as the result of continuous slip along the MBT ramp.
We systematically tested a range of possible values of dip angles (20°–60°) of the MBT fault ramp using forward models (S3 and S4 in the Data Repository). We found that dips of the MBT ramp between 35° and 45° yield the lowest misfit. These dips are in agreement with our own field measurements and Adlakha et al. (2013). In contrast, DeCelles et al. (2001) inferred a ~10° dip of the MBT in the central Nepal segment.
Our detailed inverse models suggest uniform slip rates of ~2.6–3.6 mm a–1 along the MBT (Fig. 5; Table 2) over at least the past 6 m.y. Together with our assumed structural and ther-mochronologic constraints on the estimated dura-tion of faulting (~10 m.y.), the minimum total fault displacement on the MBT is in the range of 26–36 km. At the position where the MBT soles into the basal décollement, the thermal gradient obtained from our numerical inversions would result in a temperature slightly >300 °C. Assum-ing a thermal gradient of ~30 °C/km, this is a depth of ~10 km and therefore agrees with the depth of the MHT (sole thrust) and the structural architecture defined in our numerical models. Other geometries would exhume material from greater depth and result in exposure of higher metamorphic facies at the surface, as observed in the field and described herein.
The observed garnet growth in the MCT hanging wall (Fig. 2), however, does not fit with our modeling. Several possibilities could explain the existence of the garnets: (1) they could have grown at higher pressure-tempera-ture conditions at deeper depths and were trans-ported first southward along the décollement before they were uplifted across the MBT ramp; or (2), the temperature conditions could have been higher due to increased heat advection along the MHT shear zones (e.g., due to fluid circulation); (3) the fact that we found these garnets so close to the MCT fault zone could also hint that Higher Himalayan material has been transported by the MCT from a far interior source during the early to mid-Miocene. In sum-mary, the inverse models are in good agreement with intense and long-lasting exhumation above a steep frontal MBT fault ramp (Fig. 1).
We tested the sensitivity of the models to dif-ferent MBT initiation ages (see Fig. 6). These models show that a minimum duration of activ-ity for the MBT of at least 6 m.y. is necessary to reproduce the observed cooling age pattern. However, our results are not strongly sensitive to changes in topography or initial topography. At least 6–8 m.y. are needed to establish a time-invariant pattern for AFT closure isotherms. Such patterns are established when exhumation is in a near thermal steady state (Willett and Brandon, 2002). Our results document that local exhumation history is strongly interconnected with the underlying fault geometry. The most realistic exhumation behavior occurs when the Dhauladhar Range reaches a threshold elevation (>3 km), where it forms an orographic barrier. Rock uplift is then balanced by rapid erosion across the entire Dhauladhar Range (Fig. 6D; Deeken et al., 2011). Overall, our model results are in good agreement with sedimentary con-straints suggesting a time of onset of MBT activ-ity by 10–8 Ma (Meigs et al., 1995; Brozovic and Burbank, 2000). Assuming that the local cli-mate pattern has been approxicli-mately consistent since the Dhauladhar Range was established, this range formed the primary orographic barrier soon after ca. 10 Ma, as the present-day pre-cipitation pattern documents (Bookhagen and Burbank, 2006). A possible climatic feedback between rapid erosion and denudation-induced unloading and rock uplift (Wobus et al., 2003; Thiede et al., 2004) would maintain the steep southern flanks of the Dhauladhar Range and explain the rapid exhumation rates and local-ization of the deformation over the past 10 m.y. Such a time frame is unusual compared to other MBT segments along the entire Hima-laya, but agrees with findings by Deeken et al. (2011). Therefore, the Dhauladhar Range may have achieved exhumational steady state for at least the last couple of million years. No seis-micity or geomorphic evidence, such as fault scarps or offset fluvial terraces, related to any present-day MBT activity have been recognized. This is probably because vigorous hillslope and fluvial erosion processes along a steep moun-tain front could rapidly erase any exposure of transient sedimentary deposits or small tectonic landforms. Nevertheless, our thermokinematic modeling indicates that the MBT is potentially still an active fault. Based on the mean fault displacement rates (2.6–3.6 mm a–1) and best-fit MBT dip, this implies that the MBT within this domain has probably accommodated ~1.7–2.4 mm a–1 of crustal shorting over the past 10 m.y. Assuming that present-day geodetic shorting rates (~14 ± 2 mm a–1) across the northwest Himalaya have been sustained over geologic time scales, this would imply that here the MBT
Thiede_L630
1st
pages
/
1
0
of
11
accommodated ~15% of the total Himalayan convergence from its onset. This has not been recognized by previous workers, neither by various geodetic studies due to insufficient data
resolution nor by field studies, which favor an accommodation of the total Himalayan crustal shortening since 2 Ma within the Sub-Himalaya (Powers et al., 1998; Thakur et al., 2014).
Overall, our data support the view that the MHT décollement dips uniformly ~3°–5° to the northeast and indicate an absence of any hinterland mid-crustal ramp along the MHT within this segment, in contrast to other Hima-layan segments further east (Valdiya, 1980b; Srivastava and Mitra, 1994; Webb, 2013). The obtained cooling pattern signifies a clear rela-tionship between morphology and underlying fault geometry and emphasizes the outstanding role of the Dhauladhar Range compared to the Himalayan front further east.
CONCLUSIONS
Our new results along the southern flanks of the Dhauladhar Range strongly suggest that within this sector of the northwest Himalaya, the MBT is a primary fault and possibly still active. This is supported by the observed change in meta-morphic grade across the MBT fault zone. Com-bining new and previously published ZHe and AFT data along with Pecube 3D-thermokinematic modeling of the Dhauladhar Range provides key information about the exhumation history of the range front. Our key findings are the following.
From our low-temperature thermochrono-logic data, we infer that the MBT, in contrast to other Himalayan segments, forms a steep fault ramp that soles into the gently dipping MHT décollement and has exhumed rock from depths of 8–10 km since the late Miocene.
Our modeling results reveal that the ZHe and AFT cooling ages can only be explained with fault slip at mean rates of ~2.6–3.6 mm a–1 since the MBT activation and along a 30–40-km-long MBT fault ramp that directly soles into the MHT. Since the late Miocene, the MBT has accom-modated ~1.7–2.4 mm a–1 horizontal shortening or nearly 15% of the total Himalayan crustal shortening across this sector.
These results imply strong along-strike structural variations in the fault geometry of the Himalayan orogenic wedge. The Chamba segment exhibits strikingly dissimilar structural pattern compared to the central Himalaya. For example, the cooling age pattern of the Chamba transect is explained by faulting along flat or gently northeast dipping MHT décollement. It excludes a hinterland mid-crustal ramp or the duplexing of the Lesser Himalayan sequence in this sector of the range.
ACKNOWLEDGMENTS
We appreciate the collaboration and logistical support pro-vided by V. Jain and his group (Indian Institute of Technol-ogy Gandhinagar, Ahmedabad). This study was funded by a Deutsche Forschungsgemeinschaft (DFG) grant to Thiede (TH 1371/5–1) and a DAAD-DST (Deutscher Akademischer Austauschdienst–India Department of Science and Technol-ogy; public-private partnership PPP-India #57035520) grant to Thiede and V. Jain. Faruhn and Dey received support from DFG-GRK (Graduiertenkollegs) grant 1364 to M. Strecker (STR 373/19–2). We thank T. Ehlers for collaboration and ZHe-dating support at the University of Tubingen, P. van der Beek for hosting Thiede at ISTerre (Institut des Sciences de la Terre), Université Grenoble Alpes, and R. Arrowsmith for comments on an early version of this manuscript. We also thank Birgit Fabian for support with figure drafting. Comments of two anonymous reviewers are greatly appreciated and helped to improve the manuscript significantly.
REFERENCES CITED
Adlakha, V., Patel, R.C., Lal, N., Mehta, Y.P., Jain, A.K., and Kumar, A., 2013, Tectonics and climate interplay: Exhu-mation patterns of the Dhauladhar Range, northwest Hi-malaya: Current Science, v. 104, p. 1551–1559. Bai, L., Liu, H., Ritsema, J., Mori, J., Zhang, T., Ishikawa, Y., and
Li, G., 2016, Faulting structure above the Main Himala-yan thrust as shown by relocated aftershocks of the 2015 Mw7.8 Gorkha, Nepal, earthquake: Geophysical Research Letters, v. 43, p. 637–642, doi: 10 .1002 /2015GL066473. Blythe, A., Burbank, D.W., Carter, A., Schmidt, K., and
Put-konen, J., 2007, Plio-Quaternary exhumation history of the central Nepalese Himalaya: 1. Apatite and zircon fis-sion track and apatite [U-Th]/He analyses: Tectonics, v. 26, TC3002, doi: 10 .1029 /2006TC001990.
Bollinger, L., Avouac, J.P., Beyssac, O., Catlos, E.J., Harrison, T.M., Grove, M., Goffe, B., and Sapkota, S., 2004, Ther-mal structure and exhumation history of the Lesser Hi-malaya in central Nepal: Tectonics, v. 23, TC5015, doi: 10 .1029 /2003TC001564.
Bookhagen, B., and Burbank, D.W., 2006, Topography, relief, and TRMM-derived rainfall variations along the Hima-laya: Geophysical Research Letters, v. 33, L08405, doi: 10 .1029 /2006GL026037.
Braun, J., 2002a, Estimating exhumation rate and relief evolu-tion by spectral analysis of age-elevaevolu-tion data sets: Terra Nova, v. 14, p. 210–214, doi: 10 .1046 /j .1365 -3121 .2002 .00409 .x.
Braun, J., 2002b, Quantifying the effect of recent relief changes on age-elevation relationships: Earth and Plane-tary Science Letters, v. 200, p. 331–343, doi: 10 .1016 /S0012 -821X (02)00638 -6.
Braun, J., 2003, Pecube: A new finite-element code to solve the 3D heat transport equation including the effects of a time-varying, finite amplitude surface topography: Computers & Geosciences, v. 29, p. 787–794, doi: 10 .1016 /S0098 -3004 (03)00052 -9.
Braun, J., van der Beek, P., Valla, P., Robert, X., Herman, F., Glotzbach, C., Pedersen, V., Perry, C., Simon-Labric, T., and Prigent, C., 2012, Quantifying rates of landscape evolution and tectonic processes by thermochronology and numerical modeling of crustal heat transport using PECUBE: Tectonophysics, v. 524–525, p. 1–28, doi: 10 .1016 /j .tecto .2011 .12 .035.
Brozovic, N., and Burbank, D.W., 2000, Dynamic fluvial sys-tems and gravel progradation in the Himalayan foreland: Geological Society of America Bulletin, v. 112, p. 394–412, doi: 10 .1130 /0016 -7606 (2000)112 <394: DFSAGP>2 .0 .CO;2. Carrapa, B., Robert, X., DeCelles, P.G., Orme, D.A., Thomson,
S.N., and Schoenbohm, L.M., 2016, Asymmetric exhu-mation of the Mount Everest region: Implications for the tectono-topographic evolution of the Himalaya: Geology, v. 44, p. 611–614, doi: 10 .1130 /G37756 .1.
Cattin, R., and Avouac, J.P., 2000, Modeling mountain build-ing and the seismic cycle in the Himalaya of Nepal: Jour-nal of Geophysical Research, v. 105, p. 13389–13407, doi: 10.1029 /2000JB900032.
Copley, A., Avouac, J.-P., and Royer, J.-Y., 2010, India-Asia collision and the Cenozoic slowdown of the Indian plate: Implications for the forces driving plate motions: Jour-nal of Geophysical Research, v. 115, B03410, doi: 10 .1029 /2009JB006634.
DeCelles, P.G., Robinson, D.M., Quade, J., Ojha, T.P., Garzione, C.N., Copeland, P., and Upreti, B.N., 2001, Stratigraphy, structure, and tectonic evolution of the Himalayan fold-thrust belt in western Nepal: Tectonics, v. 20, p. 487–509, doi: 10 .1029 /2000TC001226.
Deeken, A., Thiede, R.C., Sobel, E.R., Hourigan, J.K., and Strecker, M.R., 2011, Exhumational variability within the Himalaya of northwest India: Earth and Planetary Science Letters, v. 305, p. 103–114, doi: 10 .1016 /j .epsl .2011 .02 .045. Dey, S., Thiede, R., Schildgen, T., Wittmann, H., Bookhagen,
B., Scherler, D., and Strecker, M., 2016, Holocene internal shortening within the northwest Sub-Himalaya: Out-of-sequence faulting of the Jwalamukhi thrust, India: Tec-tonics, v. 35, p. 2677–2697, doi: 10 .1002 /2015TC004002. Dezes, P.J., Vannay, J.C., Steck, A., Bussy, F., and Cosca, M.,
1999, Synorogenic extension: Quantitative constraints on the age and displacement of the Zanskar shear zone (northwest Himalaya): Geological Society of America Bulletin, v. 111, p. 364–374, doi: 10 .1130 /0016 -7606 (1999)111 <0364: SEQCOT>2 .3 .CO;2.
DiPietro, J.A., and Pogue, K.R., 2004, Tectonostratigraphic subdivisions of the Himalaya: A view from the west: Tec-tonics, v. 23, TC5001, doi: 10 .1029 /2003TC001554. Duncan, C., Masek, J., and Fielding, E., 2003, How steep are
the Himalaya? Characteristics and implications of along-strike topographic variations: Geology, v. 31, p. 75–78, doi: 10 .1130 /0091 -7613 (2003)031 <0075: HSATHC>2 .0 .CO;2. Ehlers, T.A., 2005, Crustal Thermal Processes and the Inter-pretation of Thermochronometer Data, in Reiners, P.W., ed., Low-Temperature Thermochronology: Techniques, Interpretations, and Applications, Volume 58: Reviews in Minerology & Geochemistry, Mineralogical Society of America, p. 315–350.
Elliott, J.R., Jolivet, R., Gonzalez, P.J., Avouac, J.P., Holling-sworth, J., Searle, M.P., and Stevens, V.L., 2016, Himala-yan megathrust geometry and relation to topography revealed by the Gorkha earthquake: Nature Geoscience, v. 9, p. 174–180, doi: 10 .1038 /ngeo2623.
Finlayson, D.P., and Montgomery, D.R., 2003, Modeling large-scale fluvial erosion in geographic information systems: Geomorphology, v. 53, p. 147–164, doi: 10 .1016 /S0169 -555X (02) 00351-3.
Frank, W., Grasemann, B., Guntli, P., and Miller, C., 1995, Geo-logical map of the Kishtwar-Chamba-Kulu region (NW Himalayas, India): Jahrbuch der Geologischen Bunde-sanstalt, v. 138, p. 299–308.
Fuchs, G., and Linner, M., 1995, Geological traverse across the western Himalaya—A contribution to the geology of eastern Kadakh, Lahul, and Chamba: Jahrbuch der Ge-ologischen Bundesanstalt, v. 138, p. 655–685. Gahalaut, V.K., and Kundu, B., 2012, Possible influence of
sub-ducting ridges on the Himalayan arc and on the ruptures of great and major Himalayan earthquakes: Gondwana Research, v. 21, p. 1080–1088, doi: 10 .1016 /j .gr .2011 .07 .021. Gansser, A., 1964, Geology of the Himalayas: London,
Inter-science, 289 p.
Gao, R., Lu, Z., Klemperer, S.L., Wang, H., Dong, S., Li, W., and Li, H., 2016, Crustal-scale duplexing beneath the Yarlung Zangbo suture in the western Himalaya: Nature Geosci-ence, v. 9, p. 555–560, doi: 10 .1038 /ngeo2730. Grandin, R., Vallee, M., Satriano, C., Lacassin, R., Klinger, Y.,
Si-moes, M., and Bollinger, L., 2015, Rupture process of the Mw = 7.9 2015 Gorkha earthquake (Nepal): Insights into Hi-malayan megathrust segmentation: Geophysical Research Letters, v. 42, p. 8373–8382, doi: 10 .1002 /2015GL066044. Hauck, M.L., Nelson, K.D., Brown, L.D., Zhao, W.J., and Ross,
A.R., 1998, Crustal structure of the Himalayan orogen at similar to 90 degrees east longitude from Project IN-DEPTH deep reflection profiles: Tectonics, v. 17, p. 481– 500, doi: 10 .1029 /98TC01314.
Herman, F., et al., 2010, Exhumation, crustal deformation, and thermal structure of the Nepal Himalaya derived from the inversion of thermochronological and thermo-barometric data and modeling of the topography: Jour-nal of Geophysical Research, v. 115, B06407, doi: 10 .1029 /2008JB006126.
Hodges, K.V., 2000, Tectonics of the Himalaya and southern Ti-bet from two perspectives: Geological Society of America Bulletin, v. 112, p. 324–350, doi: 10 .1130 /0016 -7606 (2000) 112 <324: TOTHAS>2 .0 .CO;2.
Hodges, K.V., Hurtado, J.M., and Whipple, K.X., 2001, Southward extrusion of Tibetan crust and its effect on