Publisher’s version / Version de l'éditeur:
Solar Energy, 72, May 5, pp. 385-395, 2002-05-01
READ THESE TERMS AND CONDITIONS CAREFULLY BEFORE USING THIS WEBSITE.
https://nrc-publications.canada.ca/eng/copyright
Vous avez des questions? Nous pouvons vous aider. Pour communiquer directement avec un auteur, consultez la
première page de la revue dans laquelle son article a été publié afin de trouver ses coordonnées. Si vous n’arrivez pas à les repérer, communiquez avec nous à PublicationsArchive-ArchivesPublications@nrc-cnrc.gc.ca.
Questions? Contact the NRC Publications Archive team at
PublicationsArchive-ArchivesPublications@nrc-cnrc.gc.ca. If you wish to email the authors directly, please see the first page of the publication for their contact information.
NRC Publications Archive
Archives des publications du CNRC
This publication could be one of several versions: author’s original, accepted manuscript or the publisher’s version. / La version de cette publication peut être l’une des suivantes : la version prépublication de l’auteur, la version acceptée du manuscrit ou la version de l’éditeur.
For the publisher’s version, please access the DOI link below./ Pour consulter la version de l’éditeur, utilisez le lien DOI ci-dessous.
https://doi.org/10.1016/S0038-092X(02)00019-1
Access and use of this website and the material on it are subject to the Terms and Conditions set forth at
Dynamic annual daylight simulations based on hour and
one-minute means of irradiance data
Walkenhorst, O.; Luther, J.; Reinhart, C. F.; Timmer, J.
https://publications-cnrc.canada.ca/fra/droits
L’accès à ce site Web et l’utilisation de son contenu sont assujettis aux conditions présentées dans le site LISEZ CES CONDITIONS ATTENTIVEMENT AVANT D’UTILISER CE SITE WEB.
NRC Publications Record / Notice d'Archives des publications de CNRC:
https://nrc-publications.canada.ca/eng/view/object/?id=67dca037-8722-48c6-9960-cc0b4122d45f https://publications-cnrc.canada.ca/fra/voir/objet/?id=67dca037-8722-48c6-9960-cc0b4122d45fDynamic annual daylight simulations based on
one-hour and one-minute means of irradiance data
Walkenhorst, O.; Luther, J.; Reinhart, C.; Timmer,
J.
A version of this document is published in / Une version de ce document se trouve dans : Solar Energy, v. 72, no. 5, May 2002, pp. 385-395
www.nrc.ca/irc/ircpubs
Dynamic Annual Daylight Simulations based on One-hour and One-minute M eans of Irradiance Data
Oliver Walkenhorst*, Joachim Luther Fraunhofer Institute for Solar Energy Systems ISE,
Heidenhofstraße 2, 79110 Freiburg, Germany
.
Christoph ReinhartInstitute for Research in Construction, National Research Council, 1200 M ontreal Road, Ottaw a ON K1A 0R6, Canada.
Jens Timmer
Faculty of Physics, University of Freiburg, Hermann-Herder-Straße 3, 79104 Freiburg, Germany,
and
Center for Data Analysis and M odelling, University of Freiburg, Eckertstraße 1, 79104 Freiburg
Abstract
This study investigates the influence of the short-term dynamics of daylight on
simulation-based predictions of the annual daylight availability in a building. To this end annual indoor illuminance simulations are carried out for a tw o-person-office using the RADIANCE-based dynamic daylight simulation method DAYSIM . As of yet, all available daylight simulation methods are typically based on 1-hour means of irradiance data and thus tend to neglect the short-term dynamics of daylight.
In the first part of this study the dependence of the annual daylight availability on the underlying simulation time step interval is quantified. Assuming tw o different
automated daylight-dependent artificial lighting strategies, the predicted annual artificial lighting demand is systematically underestimated by up to 27% on the simulations based on 1-hour means instead of 1-min means of measured beam and diffuse irradiances. The general validity of these results is ensured by employing irradiance data from five stations w orld-w ide.
As measured 1-min means of irradiance data are generally not available for practical applications, the stochastic Skartveit-Olseth model, w hich generates 1-min means of irradiance data from hourly means, is adapted for daylight simulation purposes in the second part of this study. The utilization of modeled 1-min means of irradiance data reduces the above described systematic simulation errors to below 8% for both automated lighting strategies and all five stations. Accordingly, the modified version of the Skartveit-Olseth model is able to enhance the quality of dynamic daylight
simulations – w ithout any additional planning effort for the lighting designer. 1. Introduction
Within the present discussion dealing w ith new ideas on the construction of buildings
*
the concept of a so-called lean building plays an increasing role (Voss et al., 2000). Lean buildings harmonize w ith their given climatic boundary conditions and exploit naturally available energy sinks and sources in order to provide increased thermal and visual comfort for their inhabitants w hile reducing the energy demand.
One aspect of a lean building is the conscious use of daylight to light the interior of buildings. The benefits of a carefully planned daylighting concept encompass an enhanced visual comfort for the inhabitants providing them w ith glare-free natural daylight and visual contact to the outside as w ell as a reduced electric energy demand for artificial lighting.
To compare different daylighting concepts during the planning phase of a building one has to rely on simulation methods that allow one to predict the annual daylight
availability in the interior of a building. To this end the RADIANCE-based simulation environment DAYSIM w hich represents a reliable and easy-to-use tool to perform
dynamic indoor illuminance simulations has recently been developed and validated (Reinhart and Herkel, 2000; Reinhart and Walkenhorst, 2001). Similar to the ESP-r/RADIANCE link (Janak, 1997) and the “ Dynamic Lighting System” (Cropper et al., 1997; M ardaljevic, 2000), DAYSIM is based on a daylight coefficient approach
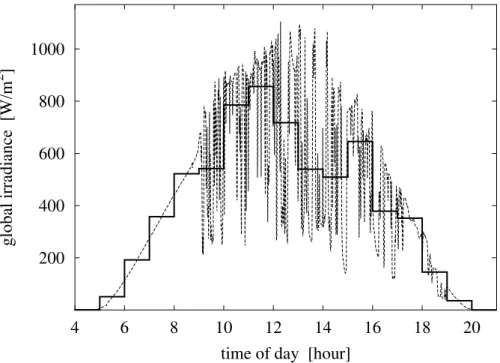
(Tregenza, 1983) and the Perez sky model (Perez et al., 1990;1993). Daylight coefficient methods are able to simulate the time development of indoor illuminances for arbitrary time step intervals based on time series of beam and diffuse irradiances. As w idely available test reference years usually provide hourly means, most dynamic daylight simulation methods are presently based on this time step, i.e. the short-term dynamics of daylight introduced by clouds intermittently hiding the sun (see Fig. 1) or a
temporarily varying cloud cover thickness is discarded. As daylight cannot be stored, the usage of 1-hour irradiance data in dynamic daylight simulations may thus lead to considerable errors in the prediction of the annual daylight availability.
200
400
600
800
1000
4
6
8
10
12
14
16
18
20
global irradiance [W/m
2]
time of day [hour]
Figure 1: M easured 1-hour (solid line) and measured 1-min (dashed) means of global irradiance on may 17th 1998 in Freiburg, Germany.
Janak suggested to use a stochastic model introduced by Skartveit and Olseth (Skartveit and Olseth, 1992) to model the intra-hour dynamics of the beam radiation and thereby reduce these errors (Janak, 1997). He implemented the Skartveit-Olseth model into ESP-r w ithout fuESP-rtheESP-r validating its applicability foESP-r dynamic daylight simulations. This papeESP-r extends Janaks original w ork by both quantifying the simulation errors introduced by using 1-hour instead of 1-min time steps for annual daylight simulations (1) and by presenting and validating a practical method to reduce these simulation errors based on the Skartveit-Olseth approach (2):
(1) Quantification of simulation errors w ith respect to time resolution: To quantify the errors in the prediction of the annual daylight availability w hich one incurs by neglecting the short-term dynamics of the daylight, dynamic annual indoor illuminance simulations are carried out for a test office w ith tw o different types of underlying irradiance data sets: measured 1-hour means and measured 1-min
means. The resulting tw o different types of annual indoor illuminance data sets are then used to predict the annual artificial lighting demand for tw o automated daylight-dependent lighting control strategies. M easured 1-min irradiance data sets are chosen as a low er threshold w ith respect to time resolution based on the assumption that they contain all information about the short-term dynamics of daylight w hich is relevant in the context of daylight simulations and as measured irradiance data w ith a higher time resolution are scarcely available.
(2) Reduction of the simulation errors w ith respect to time resolution: M easured 1-min irradiance data are generally not available for practical applications. To reduce the simulation errors, 1-min irradiance data are modeled from hourly means using a modified version of the Skartveit-Olseth model (Skartveit and Olseth, 1992). This modified version is developed for use in dynamic daylight simulations. To quantify the error in the prediction of the annual daylight availability w hich remains if one uses modeled 1-min irradiance data, dynamic annual indoor illuminance simulations are carried out w ith measured 1-min means and modeled 1-min means of
irradiance data as input. As in (1) the tw o resulting annual indoor illuminance data sets are then compared w ith respect to the predicted annual artificial lighting demand to ensure the capability of the modified Skartveit-Olseth model to reduce errors in dynamic daylight simulations.
The organization of this paper is as follow s: Section 2 describes the methodologies to investigate problems (1) and (2), simulation results are presented in Section 3 and finally Section 4 contains concluding remarks and an outlook on remaining research tasks. 2. M ethodology
2.1Dynamic Daylight Simulations w ith DAYSIM
In this study all dynamic simulations of indoor illuminances due to daylight are performed using the RADIANCE-based simulation environment DAYSIM . DAYSIM merges the backw ard raytracer RADIANCE (Ward and Shakespeare, 1998) w ith a
daylight coefficient approach and permits reliable and fast dynamic indoor illuminance simulations.
DAYSIM requires tw o essential informations for an annual indoor illuminance simulation:
(a) Description of the geometry and the materials of the building: This information is provided in the form of regular RADIANCE input files.
(b) Description of the light sources for each time step: Ambient daylight is physically described by the sky luminance distribution. As measurements of this tw o-dimensional function are usually not available for practical applications, DAYSIM makes use of the Perez sky luminous efficacy (Perez et al., 1990) and sky luminance distribution model (Perez et al., 1993) to model the sky luminance distribution using global and beam irradiance - w hich are w idely available - as input values. Therefore DAYSIM needs to be fed w ith an annual data set of global and beam irradiances. Given these tw o input files, DAYSIM allow s one to simulate an annual indoor
illuminance data set for any specified point and orientation inside of a given building. M ore details regarding the underlying simulation algorithm of DAYSIM are provided in Reinhart and Herkel (2000) and Reinhart (2001).
Figure 2: Sketch of the test office including the position of the three simulation points.
In the present study indoor illuminances are simulated for three simulation points inside and outside of a southw ard oriented 18m² test office w hich is sketched in Fig. 2. Tw o simulation points inside the office are situated at w ork plane height on the middle axis of the office 2 m and 4 m from the facade, both pointing upw ards. They represent the w ork places of the tw o-person-office. The third simulation point is situated on the facade of the test office and points southw ard. All simulations are based on this test
office. Only the underlying annual global and beam irradiance data sets are varied. 2.2 Irradiance data sets
To examine the tw o problems described in the Introduction, annual indoor illuminance simulations are carried out for three different global and beam irradiance data sets: (1) measured 1-min means
(2) measured 1-hour means (3) modeled 1-min means
Fig. 3 provides a schematic survey of the daylight simulations and the underlying irradiance data sets employed in this study.
RADIANCE
indoor illuminance data
sky luminance distribution
Perez model Perez model
Perez model
modified Skartveit-Olseth model
modeled 1-min
measured 1-min
irradiance data
(3)
irradiance data
(1)
measured 1-hour irradiance data (2)
Figure 3: Schematic survey of the simulation pathw ays in the present study. The numbers pertain to the enumeration in the text.
2.2.1 M easured 1-min means
M easured 1-min means of global and beam irradiances are the basic irradiance data set from w hich the other tw o sets, measured 1-hour means and modeled 1-min means, are derived.
To support the general validity of the simulation results, eight annual data sets of measured 1-min global and beam irradiance from five different w eather stations w orld-w ide are used. The five stations are listed in Table 1.
Station Latitude [°] Longitude [°] Height [m a.s.l.]
Albany/USA 42.70 N 73.85 W 79
Bratislava/Slovakia 48.17 N 17.08 E 195
Geneve/Sw itzerland 46.33 N 6.02 E 425
Tsukuba/Japan 36.15 N 140.05 E 43
Table 1: Latitudes, longitudes and station heights of the five w eather stations (a.s.l. = above sea level).
All five stations are affiliated to the International Daylight M easurement Programme (IDM P)* launched by the CIE in 1991.
2.2.2 M easured 1-hour means
Each of the eight annual data sets of measured 1-min global and beam irradiance described in the previous subsection yields - by averaging - an annual data set of measured 1-hour global and beam irradiance.
2.2.3 M odeled 1-min means
In this study a modified version of the stochastic Skartveit-Olseth model is used to generate 1-min global and beam irradiance data from measured hourly means. The basic structure of the original Skartveit-Olseth is sketched in the follow ing . The model consists of seven steps w hich are carried out for each hour of the year w ith non-vanishing ambient irradiances:
(1) Input: 1-hour means of global irradiance
G
and beam irradianceG
b.(2) Transformation to relative quantities using the M cM aster clear sky model (Davies and M cKay, 1982) w hich results in 1-hour means of the so-called global clearness index
K
=
G
/
G
c and beam clearness indexK
b=
G
b/
G
bc .(3) Realization of the intrahour standard deviation
å
=
−
=
60 1 2 / 1 2)
)
(
(
i i kk
K
σ
andå
=−
=
60 1 2 / 1 2 ,)
)
(
(
i b i b kbk
K
σ
of the 60 1-min global and beam clearness indicesk
iand
k
b,i (i=1,...,60) using a parametrized probability distribution.(4) Realization of 60 1-min global and beam clearness indices
k
i andk
b,iusingparametrized probability distributions.
(5) Temporal rearrangement of the 60 1-min global and beam clearness indices using realizations of a first order autoregressive process (AR(1) process, see e.g. Brockw ell and Davis, 1991).
(6) Back-transformation to absolute quantities using the M cM aster clear sky model w hich results in 1-min global irradiances
g
i=
k
i⋅
g
c,i and beam irradiancesi bc i b i b
k
g
g
,=
,⋅
, . * http://idmp.entpe.fr(7) Output: 60 1-min means of global irradiance
g
i and beam irradianceg
b,i (i=1,...,60).The output 1-min global and beam irradiances for each hour are then concatenated hour by hour. This w ay one can obtain annual data sets of modeled 1-min global and beam irradiance from data sets of hourly means. The reader should bear in mind that the Skartveit-Olseth model is stochastic, i.e. different initializations of the employed pseudo-random number generator result in different realizations of annual 1-min irradiance data sets.
While preserving the basic structure of the original Skartveit-Olseth model, the follow ing five modifications have been carried out to render the model more suitable for dynamic indoor illuminance simulations:
(1) Synchronization of global and beam irradiances: As mentioned above DAYSIM employs the Perez sky luminance distribution model w hich requires consistent global and beam irradiance as input, i.e. global and beam irradiances have to be mutually matched at each time step. In the original Skartveit-Olseth model the output 1-min global and beam irradiances are put in order according to tw o independent AR(1) processes and are thus not synchronized. Therefore it may happen that for a single time step the beam irradiance exceeds the global irradiance w hich leads to a negative diffuse irradiance. To obtain consistent 1-min global and beam irradiances, the Reindl model (Reindl et al., 1990) w hich estimates the diffuse fraction of a given global irradiance is used instead in this study. The Reindl model is used in its simplest version w hich merely requires global irradiance and solar
elevation as input parameters. In the modified Skartveit-Olseth model steps (2)-(6) are solely performed for the global irradiance and betw een step (6) and step (7) the Reindl model is utilized to determine the beam irradiance at each time step.
(2) Usage of the ESRA clear sky model: To reduce the number of required site-specific atmospheric input parameters for the clear sky model – w hich are not available for arbitrary sites – the ESRA clear sky model (Rigollier et al., 2000) is employed in step (2) and step (6) to replace the M cM aster clear sky model. The ESRA model is a broadband model w hich predicts global and beam irradiance for a given site and time under clear sky conditions. It requires the Linke turbidity factor, w hich summarizes the overall turbidity of the atmosphere, as the only atmospheric input parameter. In addition, the monthly mean Linke turbidity factors for a given site can be estimated from the input hourly means of beam irradiance*. Thus the input of site-specific atmospheric parameters becomes optional w hich makes the modified Skartveit-Olseth model easier to use for practical applications.
An investigation based on the eight annual data sets of 1-min global irradiance show ed that ESRA model and M cM aster model yield very similar global clearness
*
To estimate the monthly mean Linke turbidity factors w e have used an empirically based algorithm w hich calculates the Linke turbidity factor for the four hours of each day w ith the highest solar elevation by inverting the ESRA formula for the clear sky beam irradiance. From the about 120 calculated hourly Linke turbidity factors for each month the smallest three are then selected and the mean of these serves as an approximation for the monthly mean Linke turbidity factor for this month.
indices. As, due to modification (1), the modified Skartveit-Olseth model is solely based on global clearness indices, the replacement of the M cM aster model w ith the ESRA model scarcely influences the suitability of the original probability
distributions.
(3) New parametrization to improve the modeling of the minima of the 1-min global indices: A thorough analysis based on the eight annual data sets of measured and modeled one-minute global irradiances indicated that the original Skartveit-Olseth model generates too many very small 1-min global indices, especially outliers below
i
k
= 0.2 . Dynamic indoor illuminance simulations aiming at the prediction of the annual daylight availability are very sensitive to this type of shortcoming as too many extreme global irradiance minima result in an underestimation of the annual daylight availability and consequently in an overestimation of the annual artificial lighting demand.Therefore, a new parametrization of the three relations
σ
k*(
K
,
σ
3)
,k
min(
K
,
σ
k)
andk
max(
K
,
σ
k)
(eqns (6b), (9b) and (9c) in (Skartveit and Olseth, 1992) w hich pertain to step (3) and step (4) of the original model) w as necessary as these three quantities determine the extrema of the 1-min global clearness indices of each hour, using the average root squared deviation of the three hourly global clearness indices of the preceeding, the actual and the follow ing hour,σ
3. For the newparametrization the follow ing approach has been chosen for the three relations:
)
,
(
)
,
(
3 * 3 ) *(σ
β
σ
σ
σ
K
σ kK
new k=
⋅
(1)09
.
0
)
11
exp(
)
03
.
0
(
min 1.4 ) ( min=
−
⋅
−
⋅
⋅
k−
newK
k
β
σ
(2)5
.
1
)
9
exp(
)
5
.
1
(
max 1.3 ) ( max=
−
⋅
−
⋅
⋅
k+
newK
k
β
σ
(3)This approach originates from a careful comparison of the eight annual data sets of measured and modeled (using the original Skartveit-Olseth model) 1-min global irradiances. The three parameters
β
σ,β
min andβ
max have been determined on the basis of the eight annual data sets by minimizing a suitable objective function. For the objective function the sum of the squared relative deviations betw een the smallest measured and the smallest modeled 1-min global clearness index of each hour plus the same sum of the deviations betw een the biggest 1-min global clearness indices of each hour w as used. To allow for a more flexible adjustment of the three parameters the minimization has been carried out separately for four different clearness index classes to w hich every hour has previously been assigned to according to its hourly mean of the global clearness index. Table 2 contains the results for the three parameters for all four clearness index classes.3
.
0
≤
K
0
.
3
<
K
≤
0
.
6
0
.
6
<
K
≤
0
.
9
K
>
0
.
9
σβ
1.3 1.3 1.0 0.7 minβ
-0.03 0.20 0.47 2.00 maxβ
1.66 4.26 0.89 0.38Table 2: Results for the three new fitting parameters for each of the four clearness index classes (K is the hourly mean global clearness index).
(4) M inimization of artificial discontinuities betw een subsequent hours: In the original Skartveit-Olseth model the realizations of the AR(1) process for the temporal rearrangement of the 1-min global clearness indices (step (5)) are completely independent for subsequent hours. Therefore, artificial discontinuities usually arise at the transition betw een subsequent hours.
To minimize these artificial discontinuities, special realizations of the AR(1) process are selected. The AR(1) realization selected for each hour depends on the last 1-min global clearness index of the preceeding hour: one choses the AR(1) realization in w hich that 1-min global clearness index of the current hour w ith the smallest difference to the last 1-min global clearness index of the preceeding hour is arranged at the first position of the current hour.
(5) Input option for a horizon: The modified Skartveit-Olseth model allow s to input the horizon of the simulation site w hich may consist of mountains or surrounding buildings. If this information is available the horizon can be entered via 36 horizon heights w hich represent azimuth segments of 10° w idth. Considering the horizon can reduce artifacts in the hours w hen the sun is partly below the horizon by taking into account the absence of beam irradiance during time steps w hen the sun is hidden behind the horizon. On the one hand it becomes possible to calculate hourly global clearness indices more accurately in step (2) and on the other hand the output 1-min irradiances in step (7) become more precise.
To run the modified Skartveit-Olseth model requires no additional information besides the geographic coordinates of the simulation site. The generation of an annual 1-min irradiance data set from hourly means requires about 90 seconds on a Pentium Pro 200 M Hz Linux w orkstation.
The modified Skartveit-Olseth model can also be run at several coarser time steps ranging betw een 2 minutes and 30 minutes by averaging the originally generated 1-min data but has not explicitly been validated w ith measured data in this range. 2.3 Comparison of the resulting simulated illuminance data sets
The three different types of annual irradiance data sets described in Section 2.2 result in three different simulated annual illuminance data sets for the three simulation points inside and outside of the test office.
These three annual illuminance data sets are of different practical relevance:
(1) The simulated illuminances based on measured 1-min irradiance data are of limited relevance for practical applications due to the lack of available measured 1-min irradiance data, but they serve as reference case in the follow ing comparison. An accompanying study show ed that they are in good agreement w ith measured illuminances in the test office.
(2) The simulated illuminances based on measured 1-hour irradiance data represent the time resolution of conventional dynamic indoor illuminance simulations using test reference years.
(3) The simulated illuminances based on modeled 1-min irradiance data using the modified Skartveit-Olseth model constitute a new possibility to cope w ith the short-term dynamics of daylight. They are derived from data set (2).
The criterion w hich is chosen to compare these three different illuminance data sets is the annual electric energy demand for artificial lighting using the follow ing tw o different automated lighting control strategies:
(a) The closed loop strategy operates w ith tw o ceiling-mounted lamps w ith integrated illuminance sensors facing dow nw ard w hich are ideally calibrated and measure the simulated illuminance on the tw o w ork plane positions at 2 m and 4 m distance from the facade. As soon as one simulated w ork plane illuminance falls below a given threshold illuminance the dimmed lamp lighting this w ork plane
instantaneously provides the lacking illuminance to maintain the threshold illuminance.
(b) The facade sensor strategy operates w ith tw o ceiling-mounted lamps and one facade-mounted illuminance sensor facing southw ard w hich measures the simulated southw ard outdoor illuminance. To any given indoor threshold illuminance corresponds a much larger outdoor threshold illuminance w hich is different for the tw o w ork plane positions. As soon as the simulated southw ard outdoor illuminance falls below the outdoor threshold illuminance of either of the tw o lamps, the corresponding lighting system is fully sw itched on. M oreover, the lamp remains activated for at least 15 minutes after being activated. This inertia of the system is introduced to supress frequent and irritating sw itchings of the lamps in the presence of temporarily varying clouds.
Both control strategies do not take into account any glare protection systems or shading devices.
M ore precisely, as criterion the specific*annual electric energy demand for artificial lighting of the w hole test office is calculated for both strategies w hich is measured in kWh per net office area and year. The mean for the w hole test office is obtained by averaging the specific energy demand of the tw o seperatedly treated simulation points w ith their respective lamps. To enhance the general validity of the investigations, the annual electric energy demands are computed for a w ide range of given indoor
threshold illuminances
I
t w ithin 200 and 2000 Lux (e.g. in Germany for a small office aminimum of 500 Lux is prescribed by code (DIN, 1990)). Depending on the indoor threshold illuminance
I
t, the specific delivery rate of the lampsP
s is set tot t s
I
W
m
W
m
Lux
I
P
(
)
=
2
.
5
/
²
+
0
.
025
(
/
²)
/
⋅
(4) *follow ing the reference of the Sw iss Society of Engineers and Architects dealing w ith energy in building construction (SIA, 1995). The first term of Eqn. (4) pertains to an electronic ballast. Finally, the attendance time of the w ork places is assumed to be w eekdays betw een 8 a.m and 6 p.m. Fig. 4 illustrates the order of magnitude of the specific annual electric energy demand for the tw o strategies vs. the underlying threshold illuminance. 10 20 30 40 50 60 70 0 500 1000 1500 2000
annual artificial lighting demand [kWh/m
2 a]
indoor threshold illuminance [Lux]
facade sensor closed loop
Figure 4: Predicted specific annual electric energy demand for artificial lighting assuming the
facade sensor and closed loop strategy on the basis of measured 1-min irradiance data vs. the
indoor threshold illuminance for Freiburg (1998).
Some remarks concerning the criterions w ill conclude this section. The tw o automated lighting control strategies are chosen because they cover a w ide range of possible automated daylight-dependent artificial lighting strategies: on one side closed loop as a dimmed and instantaneously reacting strategy and on the other side facade sensor as an undimmed and inertial strategy. The authors do not imply that the investigated systems represent the most common automated lighting systems w hich are in use now adays.
In this study only automated strategies as opposed to manual control strategies are considered because validated models for manual control strategies are currently not available. The development of such models w ill be part of the new ly proposed IEA task 31, w hich w ill focuss on the influence of the occupants on the daylight availability in a building. The authors assume that 1-hour illuminance data w ill presumably be
insufficient to model manual control strategies so that short-term illuminance data – w hose generation is enabled by means of this study – w ill be required by these models. It is w orthw hile to mention that the annual electric energy demand for artificial lighting is only one possible measure for the annual daylight availability. But every other possible measure w ill supposedly depend in a similar w ay on the time resolution of the
the sensitivity of the artificial lighting demand presented in the follow ing section. 3. Results
This section presents the results of the comparison of the three different simulated illuminance data sets. In Section 3.1 simulation errors of the annual artificial lighting demand due to reduced time resolutions are quantified. Section 3.2 show s how far these prediction errors can be reduced using the modified Skartveit-Olseth model. 3.1 Quantification of simulation errors w ith respect to time resolution
In the follow ing simulated annual illuminance data sets based on measured 1-hour and
measured 1-min irradiance data are compared to each other w ith respect to predicted specific annual electric energy demand for artificial lighting for the above described office scenarios.
Fig. 5 presents results for the closed loop strategy for the five investigated sites and varying indoor illuminance thresholds. The figure show s the specific annual electric energy demand for artificial lighting based on measured 1-hour irradiance data,
measured hour
W
1− , , to measured 1-min irradiance data ,W
1−min,measured . To facilitate the comparison betw een different stations, relative deviationsmeasured measured
measured hour
rel
=
(
W
1− ,−
W
1−min,)
/
W
1−min,∆
(5)are plotted.
Fig. 6 displays the same results for the facade sensor strategy. The tw o figures reveal that for both lighting control strategies and all investigated sites the annual artificial lighting demand is systematically underestimated using 1-hour instead of 1-min irradiance data. This systematic underestimation lies for all stations and for all investigated threshold illuminances w ithin the range of 6-18% for the closed loop strategy and w ithin the range of 15-27% for the facade sensor strategy.
−15 −10 −5 0 0 500 1000 1500 2000 relative deviation [%]
indoor threshold illuminance [Lux]
Freiburg Bratislava Geneve Albany Tsukuba
Figure 5: Relative deviation according to eqn (5) for the closed loop lighting control strategy vs. the indoor illuminance threshold for one year of data from each of the stations Freiburg (1998), Bratislava (1998), Geneve (1999), Albany (1996) and Tsukuba (1994).
−25 −20 −15 −10 −5 0 5 10 0 500 1000 1500 2000 relative deviation [%]
indoor threshold illuminance [Lux]
Freiburg Bratislava Geneve Albany Tsukuba
Figure 6: Relative deviation according to eqn (5) for the facade sensor lighting control strategy vs. the indoor illuminance threshold for one year of data from each of the stations Freiburg (1998), Bratislava (1998), Geneve (1999), Albany (1996) and Tsukuba (1994).
This effect is primarily caused by the fact that during most annual w orking hours the hourly mean illuminance exceeds the considered threshold illuminances. For these hours
the simulation based on 1-hour means predicts sufficient daylight during the w hole hour w hereas 1-min illuminances may occasionally fall below the threshold illuminance thereby activating the artificial lighting system. During these hours one can only “ forfeit daylight” if one simulates w ith a time resolution of one minute compared to hourly simulations. This forfeiture has a stronger influence on the facade sensor than on the
closed loop strategy as for the former one single 1-min illuminance that lies below the threshold illuminance results in 15 minutes of activated artificial lighting due to the built in inertia of the control system.
We also analyzed the seasonal variability of the relative deviation for different indoor illuminance thresholds. We found that for low indoor illuminance thresholds (< 500 Lux) the largest part of the overall annual relative deviation stems from the w inter months. For increasing indoor illuminance thresholds the w inter share of the overall annual relative error decreases until the summer share becomes the dominant part of the overall annual relative error for high indoor illuminance thresholds (2000 Lux). This is due to the fact that w inter hours are on average darker than summer hours, i.e. intra-hour indoor illuminances tend to scatter around rather low values (< 500 Lux) in w inter and around rather high values (2000 Lux) in summer.
3.2 Reduction of simulation errors w ith respect to time resolution
In this section simulation results based on modeled 1-min and measured 1-min irradiance data are compared.
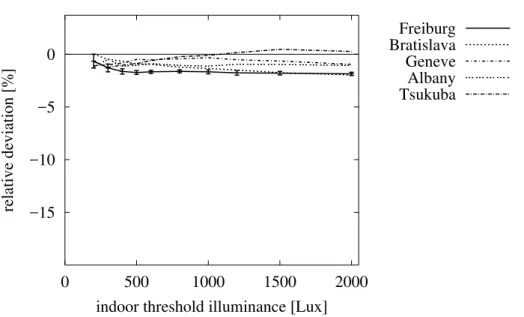
Figures 7 and 8 correspond to Figures 5 and 6 from the preceeding section.
−15 −10 −5 0 0 500 1000 1500 2000 relative deviation [%]
indoor threshold illuminance [Lux]
Freiburg Bratislava Geneve Albany Tsukuba
Figure 7: Relative deviation betw een modeled and measured one-minute irradiance data in analogy to eqn (5) for the closed loop lighting control strategy vs. the indoor illuminance threshold for one year of data from each of the stations Freiburg (1998), Bratislava (1998), Geneve (1999), Albany (1996) and Tsukuba (1994).
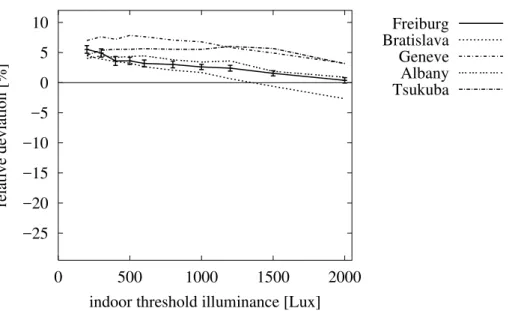
−25 −20 −15 −10 −5 0 5 10 0 500 1000 1500 2000 relative deviation [%]
indoor threshold illuminance [Lux]
Freiburg Bratislava Geneve Albany Tsukuba
Figure 8: Relative deviation betw een modeled and measured one-minute irradiance data in analogy to eqn (5) for the facade sensor lighting control system vs. the indoor illuminance threshold for one year of data from each of the stations Freiburg (1998), Bratislava (1998), Geneve (1999), Albany (1996) and Tsukuba (1994).
They reveal that for both lighting control strategies and all investigated sites the time-resolution-related simulation errors are significantly reduced using the modified Skartveit-Olseth model. The remaining errors amount to less than 2% for the closed
loop strategy and to less than 8% for the facade sensor strategy for all considered sites and all investigated illuminance thresholds.
The remaining overestimation for the facade sensor strategy originates from the
tendency of the modified Skartveit-Olseth model to still generate too many very small 1-min irradiances. Without the improved parametrization explained under 2.3.3 the overestimation for the facade sensor strategy w ould lie above 20% .
How ever, the remaining errors are small if one keeps in mind that the annual outdoor solar irradiance supply at one fixed site varies by arround
±
10% (Reise, 2001) and thus leads to natural variations of the annual daylight availability for different years.For the potential user of the model it is important to mention that different realizations of the modeled annual 1-min irradiance data, i.e. different runs of the stochastic Skartveit-Olseth model, only have a minor impact on the simulation outcome. The relative standard deviation of the specific annual electric energy demand for artificial lighting resulting from 10 different realizations never surmounts 0.7% for all stations, investigated threshold illuminances and lighting strategies. This implies that for practical purposes one single realization of the model should usually yield a sufficient simulation accuracy.
This study show s that the neglection of the short-term dynamics of natural daylight can introduce substantial errors in the simulation of the specific annual electric energy demand for automated control strategies of artificial lighting systems. These systematic errors can be significantly reduced if one simulates indoor illuminances based on modeled 1-min irradiance data using the modified Skartveit-Olseth model.
The authors’ confidence in the general applicability of the modified Skartveit-Olseth model for dynamic daylight simulations is based on the follow ing three arguments:
- The employed data stem from five stations w orldw ide w hich are situated in diverse climates w ithin densely populated regions. For all these sites a comparable quality of simulation results has been achieved.
- Further simulations have confirmed that this high quality could be maintained for other office geometries w ith smaller facade apertures, room depth up to 10 m and varying facade orientations. There is a tendency tow ards increased simulation errors w ith increasing brightness of the office, i.e. the brighter the office the bigger the relative discrepancy betw een simulations based on 1-hour and 1-min irradiance data. This is due to the fact that in brighter offices more hourly indoor illuminances lie above the threshold illuminance.
- The investigated indoor illuminance thresholds comprise the w ide range betw een 200 Lux and 2000 Lux w hich covers the complete range w hich is thought to be relevant for daylighting.
The modified Skartveit-Olseth model is easy to use as it requires only marginal user input and thus allow s a more accurate prediction of daylight-relevant planning
quantities w ithout any additional w orking effort for the lighting designer compared to conventional dynamic daylight simulations based on hourly data. The modified
Skartveit-Olseth model as w ell as the DAYSIM simulation environment can be dow nloaded from w w w .nrc.ca/irc/ie/light/daysim.html.
Finally w e give an outlook on further possible applications of modeled 1-min irradiance data:
(1) This study focusses on the differences betw een 1-hour and 1-min irradiance data concentrating on the distribution of hour minima. The distribution of intra-hour irradiance maxima presumably also depends on the time resolution of the data. For this reason modeled 1-min irradiance data could be used for enhanced predictions of the frequency of glare effects w hich might in turn lead to an enhanced performance assessment of shading devices.
(2) As mentioned in Section 2.3 the modeling of manual control strategies for both artificial lighting systems and shading devices necessitates short-term irradiance data.
(3) M ore generally, short-term irradiance data might be of use in modeling any kind of
non-linear solar-driven system, especially if it exhibits a threshold behaviour as e.g. solar thermal devices or photovoltaic pumping systems.
We w ould like to thank Arvid Skartveit and Jan Asle Olseth for making the source code of their original model available and to Guy New sham for providing valuable comments on a draft version of this paper. M any thanks to Christian Reise, Stanislav Darula and Richard Kittler, Pierre Ineichen, Tsunebumi M ikuni and Richard Perez for sharing their irradiance data w ith us.
Finally the authors are indepted to their colleagues at the Solar Building Design Group at the Fraunhofer Institute for Solar Energy Systems for valuable comments and fruitful discussions.
Nomenclature
i
g
1-min global irradiance pertaining to the i-th minute [W/m²]i b
g
, 1-min beam irradiance pertaining to the i-th minute [W/m²]i bc
g
, 1-min beam irradiance under clear sky pertaining to the i-th minute [W/m²]i c
g
, 1-min global irradiance under clear sky pertaining to the i-th minute [W/m²]G
1-hour global irradiance [W/m²]b
G
1-hour beam irradiance [W/m²]bc
G
1-hour beam irradiance under clear sky [W/m²]c
G
1-hour global irradiance under clear sky [W/m²]t
I
indoor threshold illuminance [Lux]i
k
1-min global clearness index pertaining to the i-th minute [-]i b
k
, 1-min beam clearness index pertaining to the i-th minute [-]max
k
upper threshold for 1-min global clearness indices during hour [-]) ( max
new
k
upper threshold for 1-min global clearness indices during hour (according to new parametrization) [-]min
k
low er threshold for 1-min global clearness indices during hour [-]) ( min
new
k
low er threshold for 1-min global clearness indices during hour (according to new parametrization) [-]K
1-hour global clearness index [-]b
K
1-hour beam clearness index [-]s
P
specific delivery rate of the lamps [W/m²]measured hour
W
1− , specific annual electric energy demand for artificial lighting based on measured 1-hour irradiance data [kWh/m²a]measured
W
1−min, specific annual electric energy demand for artificial lighting based on measured 1-min irradiance data [kWh/m²a]σ
β
fitting parameter [-] maxβ
fitting parameter [-] minβ
fitting parameter [-] relenergy demand for artificial lighting [-]
3
σ
average root squared deviation betw een the hourly global clearness indices of three subsequent hours [-]k
σ
standard deviation of 1-min global clearness indices during one hour [-]*
k
σ
expectation value of the standard deviation of 1-min global clearness indices during one hour [-]) *(new
k
σ
expectation value of the standard deviation of 1-min global clearness indices during one hour (according to new parametrization) [-] bk
σ
standard deviation of 1-min beam clearness indices during one hour [-] ReferencesBrockw ell P. J. and Davis R.A. (1991) Time Series: Theory and M ethods. Springer, New York.
Cropper P., Lomas K. J., Lyons A. and M ardaljevic J. (1997) A Dynamic Lighting System: Background and Prototype. LuxEuropa 97 proceedings, 480-492, Amsterdam.
Davies J. A. and M cKay D. C. (1982) Estimating solar iradiance and components. Solar
Energy29, 1, 55-64.
DIN (1990) DIN 5035, Teil 2: Beleuchtung mit künstlichem Licht, Richtw erte für Arbeitsstätten in Innenräumen und im Freien.
Janak M . (1997) Coupling Building Energy and Lighting Simulation. 5th Int. IBPSA
Conference, 8-10 September 1997, Vol. II, 313-319, Prague.
M ardaljevic J. (2000) Simulation of Annual Daylighting Profiles for Internal Illuminances.
Lighting Research and Technology32, 3, 111-118.
Perez R., Ineichen P., Seals R., M ichalsky J. and Stew art R. (1990) M odeling daylight availability and irradiance components from direct and global irradiance. Solar Energy 44, 5, 271-289.
Perez R., Seals R. and M ichalsky J. (1993) All-w eather model for sky luminance distribution – preliminary configuration and validation. Solar Energy 50, 235-245. Reindl D. T., Beckman W. A. and Duffie J. A. (1990) Diffuse fraction correlations. Solar
Energy45, 1, 1-7.
Reinhart C. F. and Herkel S. (2000) The simulation of annual daylight illuminance distributions – a state-of-the-art comparison of six RADIANCE-based methods. Energy
and Buildings32, 167-187.
Reinhart C. F. and Walkenhorst O. (2001) Validation of dynamic RADIANCE-based daylight simulations for a test office w ith external blinds. Energy and Buildings 33, 683-697.
Reinhart C. F. (2001) Daylight Availability and M anual Lighting Control in Office
Buildings – Simulation Studies and Analysis of M easurements. Ph.D. thesis, Technical University of Karlsruhe, Germany, ISBN 3-8167-6056-2.
Rigollier C., Bauer O. and Wald L. (2000) On the clear sky model of the ESRA –
European Solar Radiation Atlas – w ith respect to the heliosat method. Solar Energy 68, 33-45.
SIA (1995) Empfehlung SIA 380/4: Elektrische Energie im Hochbau. Schw eizerischer Ingenieur- und Architekten-Verein.
Skartveit A. and Olseth J. A. (1992) The probability density and autocorrelation of short-term global and beam irradiance. Solar Energy 49, 6, 477-487.
Tregenza P. R. and Waters I. M . (1983) Daylight Coefficients. Lighting Research &
Technology15, 2, 65-71.
Voss K., Reinhart C. F., Löhnert G. and Wagner A. (2000) Tow ards Lean buildings – Examples and Experience from a German demonstration program for Energy efficiency and Solar energy use in Commercial buildings. Conference Proceedings of the
EUROSUN, Kopenhagen, 19-22 June 2000, CD-ROM .
Ward G. and Shakespeare R. (1998) Rendering w ith RADIANCE. The Art and Science of