HAL Id: insu-01480934
https://hal-insu.archives-ouvertes.fr/insu-01480934
Submitted on 1 Mar 2017
HAL is a multi-disciplinary open access
archive for the deposit and dissemination of
sci-entific research documents, whether they are
pub-lished or not. The documents may come from
teaching and research institutions in France or
abroad, or from public or private research centers.
L’archive ouverte pluridisciplinaire HAL, est
destinée au dépôt et à la diffusion de documents
scientifiques de niveau recherche, publiés ou non,
émanant des établissements d’enseignement et de
recherche français ou étrangers, des laboratoires
publics ou privés.
Mapping the mesospheric CO2 clouds on Mars
Albert Leboucher, Anni Määttänen, Joachim Audouard, Brigitte Gondet,
Franck Montmessin
To cite this version:
Albert Leboucher, Anni Määttänen, Joachim Audouard, Brigitte Gondet, Franck Montmessin.
Map-ping the mesospheric CO2 clouds on Mars . Sixth International Workshop on the Mars Atmosphere:
Modelling and Observations, Jan 2017, Granada, Spain. �insu-01480934�
MAPPING THE MESOSPHERIC CO
2CLOUDS ON MARS.
A. Leboucher, A. Määttänen, J. Audouard, LATMOS (Laboratoire, ATmosph`eres, Milieux, Observations Spa-tiales)/IPSL, UVSQ Université Paris-Saclay, UPMC Univ. Paris 06, CNRS, Guyancourt, France, B. Gondet, Institut d’Astrophysique Spatiale, Orsay, France, F. Montmessin, LATMOS/IPSL, UVSQ Université Paris-Saclay, UPMC Univ. Paris 06, CNRS, Guyancourt, France.
Introduction
In the early 1990s’, the James Clerk Maxwell Telescope [1] recorded very low temperatures in the martian meso-sphere close to the CO2 condensation point at altitudes
of 50-80km. Based on this and other evidence (emission spike at 4.3µm measured by Mariner 6 and 7 [2]), scien-tists suggested that mesospheric clouds should form in this part of the atmosphere, thanks also to observations from Pathfinder [3] that revealed temperatures below CO2 condensation point in this region. As CO2 is the
major constituent of the martian atmosphere and there is very little water vapour in the mesosphere, it was the most likely candidate to condensate. Thus, the presence of mesospheric CO2ice clouds has been suggested, and
then confirmed by spectro-imaging observations com-ing from satellite data (Mars Express, Mars Global Sur-veyor...). They have been observed in the equatorial mesosphere at the northern hemisphere summer and at northern and southern midlatitudes in autumn ([4], [5]). However, these observations did not allow analysis of their composition as they could be composed of water ice crystals or CO2 ice crystals. In 2007, the presence
of mesospheric CO2clouds was confirmed thanks to the
OMEGA spectrometer on Mars Express revealing a CO2
scattering peak around 4.24µm, within the CO2gaseous
absorption band [6] during northern spring and summer at the equator and during northern autumn at northern and southern mid-latitudes. It was thought that most of the mesospheric clouds were composed of CO2 ice.
Moreover, carbon dioxide supersaturated pockets, which are atmospheric pockets colder than CO2 condensation
temperature, were observed close to detached aerosol layers [4], giving further evidence to the presence of CO2mesospheric clouds on Mars.
Several studies have been published on this topic (for instance, [4], [6], [5], [7]) and several years of observations have been then published, listing and map-ping all the mesospheric CO2clouds observed as well as
describing their internal structure ([8], [9]). Important questions remain such as what can we learn about their inter-annual variations, what is the source of the conden-sation nuclei and what are the limiting factors for CO2
cloud formation. None of the current global atmospheric models of martian atmosphere have indeed been able to predict them neither their formation nor the required temperatures. These clouds can help us to understand the martian mesosphere. Some studies have developed
methods to detect and map the clouds but there are still a lot of data that have not been analysed yet (for example, about three martian years from OMEGA/Mars Express). Moreover, the detection algorithms need to be improved to process the data more efficiently.
All these data and studies are very important in order to be able to construct a climatology of martian clouds as complete as possible. This climatology will enable us to better characterise the mesospheric structure and dynamics, as very specific conditions (especially low temperatures and a source of condensation nuclei) are required for CO2ice condensation.
Data
The main instrument used in this project is OMEGA (Observatoire pour la Min´eralogie, l’Eau, les Glaces et l’Activit´e) on Mars Express probe, which is an imaging spectrometer [10]. This instrument functions in several wavelength ranges: the visible and the near-infrared. As explained in [10], the total wavelength coverage of this instrument is between 0.38µm and 5.1µm, composed of three channels: one for the visible and the two others for the infrared wavelengths. As the CO2 ice
scatter-ing peak is found at 4.24µm, the channel recording the long-infrared is mostly used for CO2 cloud
characteri-sation. The observations are composed of cubes, cor-responding to the observational sessions (these sessions are named with the convention #orbit session, for in-stance #551 3). These cubes are 3-dimensional objects with the following coordinate system: x,λ, y (x,y are the image dimensions andλis the wavelength). The spe-cific wavelengths are called in the following ’spectels’ (for spectral element) and will be used to detect and map the clouds. About 8000 OMEGA datacubes spanning 6 full Martian years were used for this study.
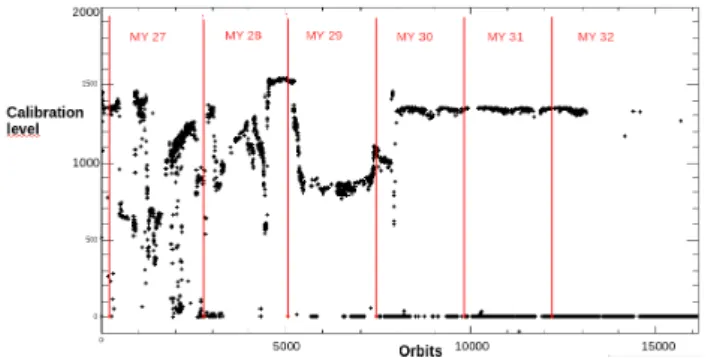
However, the instrument has to be calibrated before any observations. At the beginning of each orbit around Mars, OMEGA measures the radiometric response to a calibration light (that is a lamp inside the instrument). This measure has also been done on Earth to give a refer-ence calibration level to OMEGA. This level should not change because the flux from the lamp is constant (the lamp’s aging does not have a significant influence on this value). However, due to unknown thermo-mechanical issues, it is subject to important variations that strongly affect the measured radiance (see Figure 1). Thus, in
Figure 1: Calibration level with respect to orbits for the L-channel (long infrared).
order to use the observations from OMEGA, a transfer function has been empirically implemented to calibrate the data with respect to the reference level measured on Earth [11]. This method has been validated by analysing the temperature inside the instrument and comparing it with models [12]. In addition, we have discovered that short-circuit may occur during picture integration, which forces us to delete some pixel lines to avoid false detec-tion. The calibration analysis is thus very important in order to be sure that a given cube is suitable for scientific study.
Finally, when OMEGA has detected a cloud, we check HRSC (High-Resolution Stereo Camera also on-board Mars Express) images from the same orbit (if they are available from the Planetary Data System) to verify the detection in the visible and to put the cloud in a larger context (see Figure 2). Combination of observations by the two instruments has been also done by [8] and [9].
Detection method
The method we are using has been implemented in [8] to the observations from OMEGA to detect and map the clouds. As already explained, the CO2 ice causes
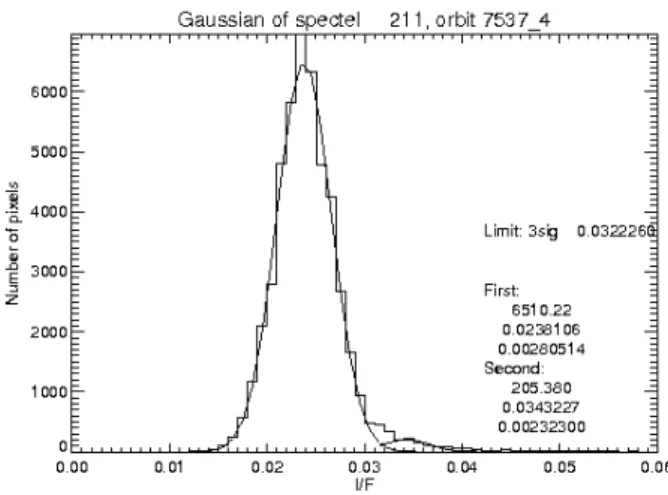
scattering peaks on the spectrum at certain wavelengths. Particularly, there are two peaks that may be observed: the first at 4.24µm or 4.26µm, which reveals the presence of a cloud, and the second at 4.32µm, which may re-veal properties (size of the crystals, optical thickness...) about the cloud itself. An example of such a spectrum is given in Figure 3. However, noise, due to fluorescence or caused by the instrument itself (dark current for in-stance), could perturb the observations and the fluxes observed. We are looking for detecting the clouds above the 3σlimit of the background noise. We assume this noise to be Gaussian and we constrain it according to the method explained in [8]. When the noise level has been calculated, we just retrieve the signal above the 3σ
noise limit. This ensures a cloud detection probable at 99.87%. To do that, the mean value and variance of
Figure 2: Image taken with HRSC corresponding to the or-bit #C635 1 (C means 12 here, which gives the oror-bit 12635) (source: pds-geosciences).
Figure 3: Spectra obtained from OMEGA with the cloud de-tection method for the orbit #7537 4: the solid line shows one spectral peak at 4.26µm and the dashed one shows two peaks, the second at 4.32µm.
noise are derived with an iterative process.
Basically, the so-called local mean value and vari-ance of each spectel in the band is computed (mlocaland
σlocal) for the whole cube. Considering that the
aver-age variance of the noise should be identical for each wavelength, a mean variance can be computed as well (σglobal). This value is then re-used in the calculation
of the new local mean value and variance of noise at 4.26µm (wavelength corresponding to the presence of a cloud) by removing all the data above 3σglobal. With an
iterative process, the ’true’ mean value and variance of the noise can be found and then removed from the obser-vations, all that is left is the signal above 3σenabling to map the clouds [8]. Nevertheless, this method has limits for instance if the cloud signal and the noise can not be statistically differentiated (i.e. if the cloud signal is too faint) or if the cloud is only present in a small number of spectels. This is the method we are going to use in this project to detect and map the CO2 ice clouds on Mars
(as in [8]). An example is given in Figure 4.
By assuming the background noise distribution in-side a cube to be Gaussian, the remaining cloud signal above 3σ can also be fitted by a Gaussian curve (see Figure 5)
Results
As already mentioned, about 8000 datacubes are being studied. For now, 67 show unambiguous CO2ice clouds
signature. Some of their properties can be found in [8]. The final results of the past 6 Martian years will be presented at the workshop.
In order to improve the detection method, we tried to correlate the results from 4.26µm with the signal in the visible band. If a cloud is present, it can be indeed seen by eye. However, none of our tentatives to find
Figure 4: Images taken by OMEGA for the orbit #7537 4: on the left is the image at 0.489µm, on the center is the image at 4.24µm in which the cloud is much more conspicuous and finally on the right is the image obtained with the detection method in which the noise has been removed. The black lines correspond to deleted pixels due to OMEGA calibration. This detection has been validated by [7].
Figure 5: Example of the reflectance distribution at the cloud wavelength for the orbit #7537 4.
REFERENCES
a correlation between the infrared and the visible band have been successful yet. The variations in albedo of the martian surface may be very different according to the considered region and its effect is difficult to account for.
Perspectives and conclusions
We will construct and present a climatology of new clouds by classifying them according to their location and season. We will analyse inter-annual variabilities and correlations with other atmospheric parameters. We also hope to find new observations of cloud shadows, which will enable to have a more precise calculation of their particle size and optical thickness ([6], [8]). Thus, this project will improve the current cloud climatology of Mars, enabling a better understanding of the meso-sphere and helping determine how the clouds could form at such high altitudes.
References
[1] Clancy, R., Sandor, B., Feb. 1998. CO2 ice clouds
in the upper atmosphere of Mars. Journal of Geo-physical Research 25, 489–492.
[2] Herr, K.C., et al., 1970. Martian topography from the Mariner 6 and 7 infrared spectra. The Astronom-ical Journal 75, 883–894.
[3] Schofield, J.T., et al., Dec.1997. The Mars Pathfinder atmospheric structure investiga-tion/meteorology (ASI/MET) experiment. Science 278(5344):1752-8.
[4] Montmessin F. et al., 2006 Subvisible CO2 ice
clouds detected in the mesosphere of Mars. Icarus 183, 403–410.
[5] Clancy, R., et al., 2007, Mars equatorial meso-spheric clouds: Global occurence and physical properties from Mars Global Surveyor Thermal
Emission Spectrometer and Mars Orbiter Camera limb observations. Journal of Geophysical Research 112, doi:10.1029/2006JE002805.
[6] Montmessin F., Gondet, B., Bibring, J.-P., Langevin, Y., Drossart, P., Forget, F., Fouchet, T., 2007, Hyper-spectral imaging of convective CO2ice clouds in the
equatorial mesosphere of Mars. Journal of Geophys-ical Research 112, doi:10.1029/2007JE002944. [7] Vincendon, M., Pilorget C., Gondet, B., Murchie,
S., Bibring, J.-P., 2011, New near-IR observations of mesospheric CO2 and H2O clouds on Mars.
Journal of Geophysical Research 116, E00J02, doi:10.1029/2011JE003827.
[8] M¨a¨att¨anen, A., Montmessin, F., Gondet, B., Hoff-mann, H., Gonz´alez-Galindo, F., Spiga, A., Forget, Hauber, E., Neukul, G., Bibring, P., Bertaux, J.-L., May 2010. Mapping the mesospheric CO2clouds
on Mars: MEx/OMEGA and MEx/HRSC observa-tions and challenges for atmospheric models. Icarus 209, 452–469.
[9] Scholten, F., Hoffmann, H., M¨a¨att¨anen, A.,
Montmessin, F., Gondet, B., Hauber, H.,
Apr. 2010, Concatenation of HRSC colour and OMEGA data for the determination and 3D-parameterization of high-altitude CO2clouds in the
Martian atmosphere. Planetary and Space Science, doi:10.1016/j.pss.2010.04.015.
[10] Bibring, J.-P., et al., 2004. OMEGA: Observatoire pour la Min´eralogie, l’Eau, les Glaces et l’Activit´e. Mars Express: The Scientific Payload, Eur. Space Agency Spec. Publ., ESA-SP 1240, 37–50. [11] Jouglet, D., et al., 2009. OMEGA long wavelength
channel: Data reduction during non-nominal stages. Planetary and Space Science 57, 1032-1042, 2009. [12] Audouard, J., et al., 2014. Mars surface thermal
inertia and heterogeneities from OMEGA/MEX. Icarus 233, 194–213.
![[PDF] Support de cours pour apprendre Word rapidement - Bureautique](data:image/gif;base64,R0lGODlhAQABAIAAAP///wAAACH5BAEAAAAALAAAAAABAAEAAAICRAEAOw==)