An analysis of how climate policies and the threat of stranded
fossil fuel assets incentivize CCS deployment
By
Victoria Clark
B.S., Mechanical Engineering Tufts University, 2008
Submitted to the Engineering Systems Division in Partial Fulfillment of the Requirements for the Degree of
Master of Science in Technology and Policy at the
MASSACHUSETTS INSTITUTE OF TECHNOLOGY June 2015
© 2015 Massachusetts Institute of Technology All Rights Reserved
Signature of Author _____________________________________________________ Technology and Policy Program
Engineering Systems Division May 8, 2015 Certified by ______________________________________________________
Howard J. Herzog Senior Research Engineer, MIT Energy Initiative Thesis Supervisor Accepted by ______________________________________________________
Dava J. Newman Professor of Aeronautics and Astronautics and Engineering Systems Director, Technology and Policy Program
An analysis of how climate policies and the threat of stranded fossil fuel assets incentivize CCS deployment
by Victoria Clark
Submitted to the Engineering Systems Division on May 8, 2015 in Partial Fulfillment of the Requirements for the Degree of
Master of Science in Technology and Policy Abstract
To be on track to stabilize climate change, scientists estimate that up to two thirds of global coal, oil, and natural gas reserves will need to remain stranded in the ground. Carbon capture and storage (CCS) is the only technology that has the potential to mitigate climate change while utilizing these potentially stranded fossil fuel assets. The
Intergovernmental Panel on Climate Change (IPCC), International Energy Agency (IEA), and other international expert organizations see CCS playing a large role in the mix of climate mitigation technologies, but deployment has been slow. In light of the expected role of CCS and current limited deployment, this thesis explores the political and financial incentives that can further drive funding and implementation of CCS projects and evaluates the role of CCS in rescuing potentially stranded fossil fuel assets.
This thesis includes three detailed analyses: (1) an evaluation of proposed command-and-control regulations from the US EPA for new and existing fossil fuel-fired power plants; (2) cases studies of how two successful CCS projects, Boundary Dam in Canada and Gorgon in Australia, were incentivized; and (3) an analysis of results from the AMPERE modeling study to estimate the global scale and value of stranded fossil fuel assets. From these analyses, five key conclusions are drawn. (1) CCS has the potential to rescue substantial coal, natural gas and oil assets and has the potential to hugely reduce global mitigation costs compared to a scenario without CCS. (2) The design of policy is crucial for CCS. Carbon pricing mechanisms must have a price high enough to incentivize CCS; command-and-control policies must not create loopholes for lower cost technologies; and financial incentives must provide sufficient funds, flexibility, and time to complete projects. (3) The role of bioenergy with CCS (BECCS) in top-down climate stabilization scenarios needs to be better understood, as these models seem to be overly optimistic regarding BECCS. (4) On an individual project level, stranded assets have the most value when there is no viable substitute available (e.g., transportation fuels) or when the fuel user also owns the asset (e.g., utility-owned lignite). (5) CCS on fuel production processes (e.g. oil refining and natural gas processing) are easier to finance than fuel utilization processes (e.g. power generation and cement production), but power plants remain the biggest potential market for CCS if it is to become a major climate mitigation technology.
Acknowledgements
It has been a real privilege to be at MIT for the last 2 years. The Technology and Policy Program has given me the tools and opportunity to think differently about the problems I want to help solve over my lifetime. Most importantly, I want to thank TPP for creating a network of truly incredible people I didn’t know could exist all in one place.
I want to extend a sincere appreciation to Howard Herzog for taking the time to help me refine my ideas, analysis, and writing. Your ability to translate complex concepts into understandable language and frameworks has helped me learn more completely and to become a better communicator.
Thank you to the Carbon Sequestration Initiative for your support of my research over the last two years.
Thank you to Mary Gallagher, for your support and encouragement. Thank you to Holly Javedan for being a pleasure to work with and Monica Lupión for helping me get up to speed on CCS. Thank you to the staff of the MIT Energy Initiative who have created a fast-paced and exciting work environment full of smiling faces.
Thank you to Barb DeLaBarre, for always being available to answer questions, shell out resources, provide emotional support, and to laugh over a weekly dose of chocolate. Thank you to Ed Ballo, for being such a gentle powerhouse of greatness.
Thank you to my lab mate and cubicle buddy, Josh Wolff - without you it wouldn’t have been nearly as fun to learn the ins and outs of carbon capture and storage. A special thanks to Josh Mueller, Nora Xu, Corey Tucker, Chris Saulnier, Dave Perlman, Henry Fingerhut, and other TPPers who have helped me manage endless problem sets, reading groups, caffeine fixes, and thesis drafts.
And finally, a huge thank you to family for your endless support. To my mom and dad, for making me feel like anything is possible. To Banks, for always encouraging my artistic and philosophical side. And to Adam, for motivating me with your unmatched passion for life and giving me great adventures to look forward to.
Acronyms
AR5 IPCC Fifth Assessment Report
ARRA American Recovery and Reinvestment Act BECCS Bioenergy with CCS
BSER Best System of Emission Reduction CAA Clean Air Act
CATF Clean Air Task Force CCPI Clean Coal Power Initiative CCS Carbon Capture and Storage COE Cost of Electricity
CPP Clean Power Plan DOE Department of Energy EGU Electricity Generating Unit
EIA Energy Information Administration
EJ ExaJoule
EOR Enhanced Oil Recovery
EPA Environmental Protection Agency ETS Emissions Trading Scheme GHG Greenhouse Gas
GW GigaWatt
GWh GigaWatt hour
HECA Hydrogen Energy California ICCS Industrial CCS
IEA International Energy Agency
IGCC Integrated Gasification Combined Cycle IPCC Intergovernmental Panel on Climate Change LCOE Levelized Cost of Electricity
LNG Liquefied Natural Gas MEA Monoethanolamine
MHI Mitsubishi Heavy Industries MWh MegaWatt hour
NGCC Natural Gas Combined Cycle NGCT Natural Gas Combustion Turbine NSPS New Source Performance Standards O&M Operations and Maintenance
PC Pulverized Coal
RIA Regulatory Impact Assessment SCC Social Cost of Carbon
SCPC Supercritical pulverized coal TCEP Texas Clean Energy Project TWh TeraWatt hour
Table of Contents
ABSTRACT ... 3 ACKNOWLEDGEMENTS ... 4 ACRONYMS ... 5 LIST OF FIGURES ... 9 LIST OF TABLES ... 11 CHAPTER 1: OVERVIEW ... 13 1.1 Background ... 13 1.2 Motivation ... 161.3 Objective and approach... 17
CHAPTER 2: CURRENT STATE OF AFFAIRS FOR CCS ... 20
2.1 CCS technology ... 20
2.2 Projects operating with CCS ... 24
2.3 Assessment of current policies for CCS ... 26
2.3.1 US: EPA Clean Air Act rules ...26
2.3.2 Canada: EPA technology requirements ...27
2.3.3 UK ...28
2.3.4 EU...28
2.3.5 Australia ...29
CHAPTER 3: ASSESSMENT OF EPA’S NEW POWER PLANT PERFORMANCE STANDARDS ... 30
3.1 Background ... 30
3.1.1 EPA and GHGs in United States courts ...30
3.1.2 Presidential memorandum ...32
3.1.3 NSPS and CPP ...32
3.2 New source performance standards ... 33
3.2.1 Introduction ...33 3.2.2 Demonstration ...34 3.2.3 Technology ...39 3.2.4 Costs ...41 3.2.5 Cycling ...46 3.2.6 Technological development ...49
3.3 Clean Power Plan ... 51
3.3.2 Reactions ...52
3.3.3 CPP and CCS ...53
3.4 Discussion ... 55
CHAPTER 4: COST ANALYSIS OF SUCCESSFUL CCS PROJECTS ... 57
4.1 Gorgon ... 57
4.2 Boundary Dam ... 59
4.3 Bottom-up metrics ... 62
CHAPTER 5: INTEGRATED ASSESSMENT MODELS: SCENARIOS OF CCS RESCUING STRANDED ASSETS... 67
5.1 IPCC ... 67
5.2 AMPERE ... 67
5.2.1 Participating models ...68
5.2.2 Amount of CCS on coal and natural gas ...69
5.2.3 Modeling assumptions ...72
5.2.4 Global stranded assets ...74
5.2.5 Embedded emissions...76
5.2.6 Value of stranded assets ...78
CHAPTER 6: POLICY DISCUSSION AND IMPLICATIONS ... 81
6.1 Type of policy to incentivize CCS ... 81
6.2 The role of stranded assets ... 84
6.3 Fuel use vs. fuel production ... 86
6.4 Role of BECCS ... 88
6.5 Geographic distribution of CCS... 89
6.6 Possibilities for future work ... 92
CHAPTER 7: CONCLUSIONS ... 94
CHAPTER 8: REFERENCES ... 96
APPENDIX A. BOUNDARY DAM ECONOMICS ... 107
A.1. Given data ... 107
A.2. Updated analysis ... 107
A.1.1. Capital costs ...109
A.1.2. Fuel costs ...111
A.1.3. O&M costs ...112
List of Figures
Figure 1: Carbon dioxide emissions already released and embedded in carbon stocks ... 14 Figure 2: Global carbon stocks and reserves compared to the allowable emissions for a 2- and 3-degree Celsius emissions target ... 16 Figure 3: An ultra-supercritical pulverized coal unit with post-combustion CO2 capture,
reproduced from MIT’s Future of Coal study... 21 Figure 4: An IGCC unit with pre-combustion CO2 capture, reproduced from MIT’s
Future of Coal study... 21 Figure 5: A supercritical pulverized coal power plant with oxy-combustion CO2 capture,
reproduced from MIT’s Future of Coal study... 22 Figure 6: Relevant CCS power plant project by year it became operational and amount of CO2 captured ... 39 Figure 7: Estimated marginal operating costs from pulverized coal and natural gas
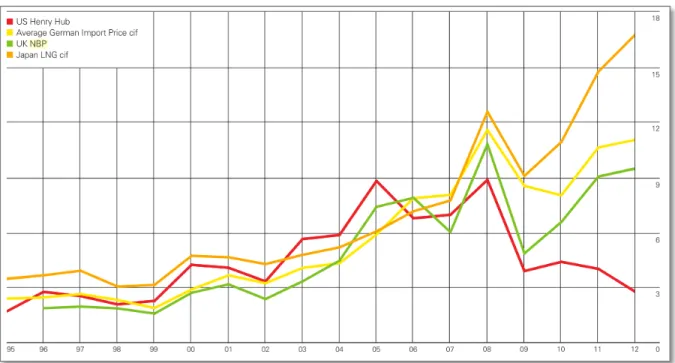
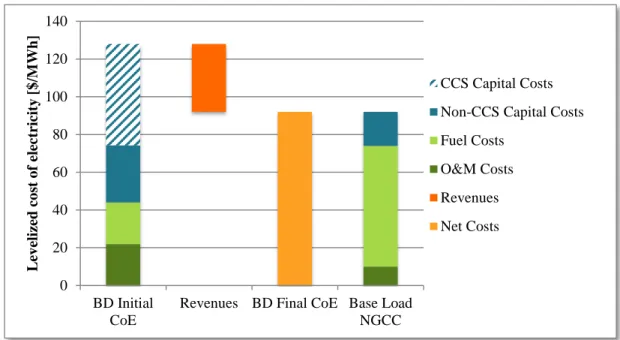
combined cycle power plants in the United States ... 48 Figure 8: Natural gas prices by regional market and year in US$/MMBtu ... 59 Figure 9: Levelized cost of electricity estimates of the Boundary Dam retrofit by cost
category compared to a base load NGCC plant ... 60 Figure 10: Levelized cost of electricity estimates of the Boundary Dam retrofit by cost
category compared to a base load NGCC plant ... 61 Figure 11: CO2 Normalized Fuel Price of lignite coal and natural gas at different market
fuel prices ... 64 Figure 12: CO2 Normalized Electricity Price generated by pulverized lignite coal and
NGCC power plants at a $90/MWh LCOE ... 65 Figure 13: Annual primary energy of coal and natural gas consumed in scenarios where
(a) policy prohibits the use of CCS on power plants and (b) where a full portfolio of supply side technologies including CCS is available to reach a 2°C climate target . 71 Figure 14: Primary energy with CCS by fuel source in four AMPERE models in a
450ppm scenario ... 73 Figure 15: Total primary energy use from 2010-2100 from fossil fuels in all sectors for
plants (left) and where CCS is included in a full portfolio of supply side
technologies (right) to reach a 2°C climate target ... 75
Figure 16: Stranded assets with 1000 Gt rescued assets compared to estimates of reserves and stocks of fossil fuels ... 78
Figure 17: Cumulative value of rescued assets in trillion $2005 over the period 2010-2100 by AMPERE model ... 79
Figure 18: Regional primary energy installed with CCS over 2010-2100 by model ... 90
Figure A1: SaskPower scale estimate of Boundary Dam cost of electricity by category [$/MWh] ... 107
Figure A2: Recreation of original SaskPower graph with additional analysis from this appendix ... 109
Figure A3: Levelized capital cost estimates from Boundary Dam ... 111
Figure A4: Levelized fuel cost estimates from Boundary Dam ... 112
Figure A5: Levelized O&M cost estimates from Boundary Dam ... 113
List of Tables
Table 1: Key characteristics of independently financed CCS projects ... 24
Table 2: Key characteristics of major government-supported CCS projects ... 25
Table 3: Relevant projects demonstrating CCS at coal-fired power plants ... 37
Table 4: Relevant projects demonstrating CCS at natural gas-fired power plants ... 38
Table 5: Relative cost comparison of project output and CCS addition costs for Boundary Dam and Gorgon ... 63
Table 6: Emission factors and heat rates used in bottom-up analysis... 63
Table 7: Relevant results in 2100 from full technology portfolio scenario in AMPERE models ... 74
Table 8: Rescued fossil fuel assets through the availability of CCS in top-down models 76 Table 9: Increased carbon budget for fossil fuel assets [Gt CO2] ... 77
Table 10: Policy costs by methodology for all AMPERE models in trillion $2005 over the period of 2010-2100 ... 79
Table 11: Value of rescued assets compared to total decreased mitigation costs enabled by deployment of CCS in trillion $2005 over the period of 2010-2100 ... 80
Table A1: Quantitative estimates of Boundary Dam cost of electricity ... 108
Table A2: Estimates for capacity factor and capital charge rate for the Boundary Dam project ... 110
Table A3: Assumptions and calculations for lignite coal and natural gas for Boundary Dam and a baseline NGCC plant ... 111
Table A4: Comparison of SaskPower and DOE estimates for O&M costs of electricity ... 113
Chapter 1: Overview
1.1 BackgroundScience has never been clearer that humans are changing the climate through increased greenhouse gas emissions. The latest Intergovernmental Panel on Climate Change (IPCC) report on the physical science behind climate change highlights increases in global mean surface and ocean temperatures, rising sea level, irreversible melting of ice in the Arctic, Antarctic, and Greenland, and increased intensity and frequency of extreme weather events that have been linked to anthropogenic (i.e. human-caused) emissions of greenhouse gases since the industrial revolution (IPCC 2013).
According to the IPCC, these global changes are expected to impact ecosystem resilience, coastal settlements, and human health. As average mean temperatures increase faster than ecosystems can naturally adapt and as extreme weather events become more prevalent, the IPCC estimates that 20-30% of plant and animal species will be at
increased risk of extinction if global average temperatures exceed 1.5 degrees Celsius. By the 2080s, the IPCC warns that millions of coastal residents will experience effects of floods, sea level rise and coastal erosion due to climate change. Finally, climate change will cause indirect human health effects though increases in malnutrition, diarrheal diseases, and cardio-respiratory diseases (IPCC 2007).
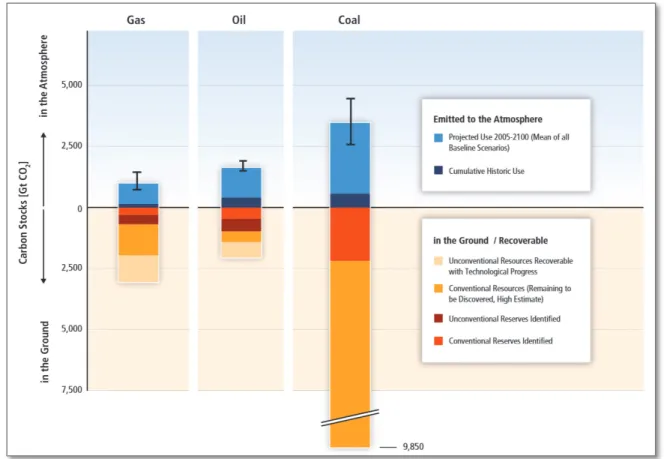
The amount of fossil fuels remaining in the world can be defined in different ways. Estimates are broken down into groups by what has already been discovered and what will be discovered based on geologic surveys and past experiences, what type of technology is necessary to recover reserves, and how financially viable it will be to access the resources, as illustrated in Figure 1 (Intergovernmental Panel on Climate
Change, 2011). The IPCC defines “reserves” as the amount of fossil fuels that can be extracted economically with current technology. “Resources,” on the other hand, are fossil fuels that can be extracted with improvements in technology or that are anticipated to be discovered in the future. The sum of reserves and resources are carbon stocks in the ground. This terminology is used throughout this thesis.
Figure 1: Carbon dioxide emissions already released and embedded in carbon stocks
Burning all fossil fuels (reserves, resources, and previously released emissions) visualized in Figure 1 is estimated to raise global temperatures by 9 degrees Celsius, or 16 degrees Fahrenheit, which far exceeds the allowable emissions for any currently proposed global climate target (Greenstone, 2015; Matthews, Gillett, Stott, & Zickfeld, 2009). Recent studies have evaluated the amount of the world’s coal, oil, and natural gas
(Caldecott, Tilbury, & Ma, 2013; Carbon Tracker Initiative, 2013). To meet an ambitious two degree Celsius climate target, the International Energy Agency (IEA) estimates that no more than 884 Gt CO2 can be emitted globally between 2012 and 2050, equivalent to only burning approximately one third of global carbon reserves (International Energy Agency, 2013b). The Carbon Tracker Initiative estimates that only 975 Gt CO2 can be emitted by 2100 to reach the same goal of two degrees Celsius of warming above average pre-industrial temperatures (consistent with a 450 ppm stabilization scenario) (Carbon Tracker Initiative, 2013). The two-degree goal is admittedly among the most ambitious, but even less stringent targets will require leaving large amounts of coal, oil and natural gas in the ground and unutilized.
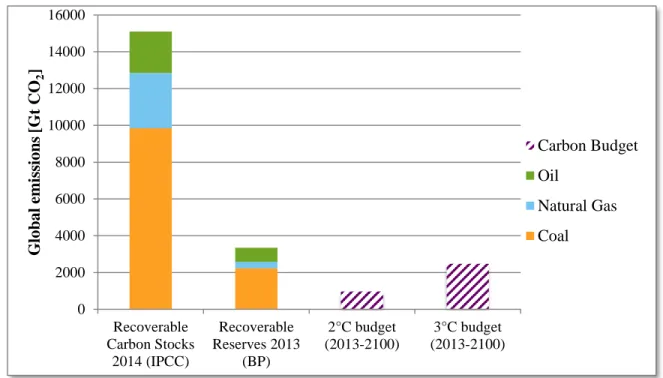
Figure 2 compares two estimates of fossil fuel assets to carbon dioxide budgets. Fossil fuel stocks are defined as “recoverable carbon from fossil fuels in the ground,” and includes fossil fuels recoverable with technological progress, as well as and those fossil fuels expected to be discovered (see Figure 1) (Intergovernmental Panel on Climate Change, 2011). Proved fossil fuel reserves are defined by BP as “those quantities that geological and engineering information indicates with reasonable certainty can be recovered in the future from known reservoirs under existing economic and operating conditions” (2013). Carbon dioxide budgets for 2°C and 3°C were taken from the Carbon Tracker Initiative, and are assumed to have an 80% probability of not exceeding the temperature threshold (2013).
Figure 2: Global carbon stocks and reserves compared to the allowable emissions for a 2- and 3-degree Celsius emissions target
Any reserve surplus greater than a given carbon dioxide budget has been referred to as “stranded” or “unburnable” carbon, because external constraints may render these assets unable to be utilized for energy end uses. As with many buzzwords, stranded assets have been previously analyzed with different objectives in mind. IEA and others focus on the environmental risk of burning more than an environmentally healthy amount of greenhouse gas emissions, as illustrated in Figure 2 (International Energy Agency, 2013b). Groups like the Carbon Tracker Initiative have focused on the economic value of fossil fuel assets and financial risk asset holders will face (Carbon Tracker Initiative, 2013).
1.2 Motivation
There is only one technology that has the ability to utilize potentially stranded fossil fuel assets while mitigating climate change: carbon dioxide capture and storage
0 2000 4000 6000 8000 10000 12000 14000 16000 Recoverable Carbon Stocks 2014 (IPCC) Recoverable Reserves 2013 (BP) 2°C budget (2013-2100) 3°C budget (2013-2100) G lo b a l em issi o n s [ G t C O2 ] Carbon Budget Oil Natural Gas Coal
(CCS). CCS involves capture (i.e., separation and compression), transportation, and long-term geologic storage of carbon dioxide from large point sources. Despite the potential for CCS to rescue stranded assets, deployment has been slow. While several commercial-scale CCS projects have been implemented in the past two decades, only one was at a power plant. A major barrier to CCS in the power industry is the high capital costs and parasitic load (termed “energy penalty”) of CCS compared with conventional fossil fuel-fired generation.
Without policies that effectively limit carbon dioxide emissions to the atmosphere, the added costs of CCS are hard to justify. These policies would put an effective price on carbon dioxide emissions, either directly (e.g., a tax or cap-and-trade system) or indirectly (e.g., emissions standards). Agreements that would require significant CO2 emissions reductions in the near-term are not being reached on either a national or global level. Where a price is established, as in the European Emissions Trading System, it is much lower than the cost needed to justify CCS. Australia did establish a carbon tax in 2012, but it was repealed in July of 2014 (Taylor & Hoyle, 2014). In the United States, the Environmental Protection Agency has proposed CO2 emissions standards from new and existing power plants, but these will not incentivize CCS deployment (U.S. Environmental Protection Agency, 2013a, 2014a).
1.3 Objective and approach
The objective of this thesis is to explore how climate policies can help incentivize CCS and whether the specter of stranded fossil assets can help drive CCS deployment.
Chapter 2 provides a background on CCS technology, projects, and policy, to inform
later chapters.
Chapter 3 focuses on the EPA’s assessment of CCS as a technology included in the New
Source Performance Standards (NSPS) on new coal and natural gas power plants and the Clean Power Plan (CPP) for existing power plants. The NSPS identified CCS as a Best System of Emission Reduction (BSER) for coal-fired plants but not for natural gas-fired plants. The CPP includes CCS less directly. These proposed power plant rules raised two key questions: (1) why was CCS on a coal-fired power plant considered a BSER for the NSPS, but not CCS on a natural gas-fired power plant? And (2) will the NSPS or CPP incentivize CCS?
Chapter 4 provides a bottom-up economic analysis of successful CCS projects. For each
of the two selected projects, Boundary Dam and Gorgon, two questions are addressed: (1) what role did stranded assets play? and (2) what can be generalized from the analysis?
In Chapter 5, a global view of stranded assets is taken by comparing global energy-economic models that participated in the AMPERE collaborative modeling project. All of these models were run to meet specific climate targets with scenarios that both included and excluded CCS. Models and scenarios are compared to answer three questions: (1) what is the quantity of stranded coal, oil, and natural gas assets under stringent climate targets? (2) what is the value of these assets? and (3) what potential is there for CCS to rescue stranded assets?
In Chapter 6 and Chapter 7 the policy implications and conclusions, respectively, are discussed.
Chapter 2: Current state of affairs for CCS
This section serves as a brief overview of the state of CCS technology, projects, and the policies that incentivize climate action and CCS deployment.
Carbon dioxide capture from industrial processes for commercial operations is over 90 years old. However, the idea of using this technology to capture and store the CO2 started in the 1980s when awareness of climate change started to become prominent (Intergovernmental Panel on Climate Change, 2005).
The first large-scale demonstration of CCS was Statoil’s Sleipner Project, which captured CO2 from natural gas processing operations. It began operation in 1996 off the coast of Norway. Since then there has been a move from relatively low cost CCS installations on fuel processing and industrial operations to more expensive ones on power plants. While many small demonstration and pilot projects have operated on power plants, it wasn’t until 18 years after Sleipner that the first commercial CCS power plant began operation at SaskPower’s Boundary Dam plant in Saskatchewan, Canada.
2.1 CCS technology
CO2 capture
CO2 capture processes on power plants or industrial processes are characterized as post-combustion, pre-combustion, or oxy-combustion.
Post-combustion is the most proven of capture technologies on power plants and
was recently implemented on the first utility scale power plant at Boundary Dam (Ball, 2014; Massachusetts Institute of Technology, 2015; SaskPower, 2012). The
absorption techniques utilizing amines, most notably monoethanolamine (MEA), are the most common and commercialized (Massachusetts Institute of Technology, 2007).
Figure 3: An ultra-supercritical pulverized coal unit with post-combustion CO2 capture, reproduced from MIT’s Future of Coal study
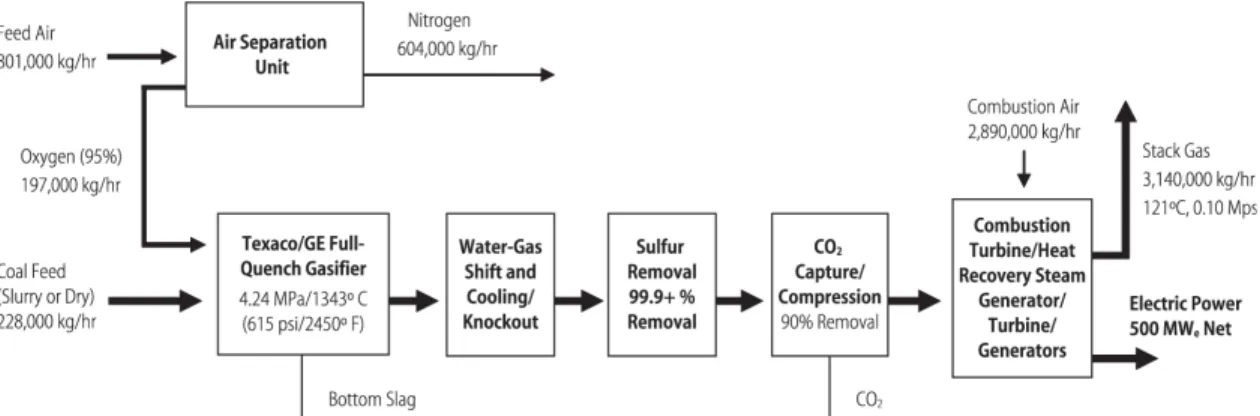
Pre-combustion capture at power plants is associated with integrated gasification
combined cycle (IGCC) systems, which utilize a gasifier to produce a synthesis gas (syngas). The CO2 is captured from the syngas before it is combusted in a gas turbine. The relatively high CO2 concentration and pressure in the syngas allows for less
expensive capture than post-combustion. However, because IGCC power plants are more expensive than conventional coal plants, it is unclear whether the total costs are higher or lower than the post-combustion process (Massachusetts Institute of Technology, 2007).
Figure 4: An IGCC unit with pre-combustion CO2 capture, reproduced from MIT’s Future of Coal study
Oxygen-blown, or oxy-combustion, involves burning feedstock fuel in almost pure oxygen rather than regular air, producing a flue gas consisting mainly of CO2 and water vapor. While this greatly simplifies the flue gas clean up, it does require an air separation unit (ASU) to generate the oxygen. Oxy-combustion capture allows for higher boiler efficiencies than traditional post-combustion capture but has an additional energy penalty from the ASU, as shown in Figure 5 (Massachusetts Institute of Technology, 2007). Initial cost estimates for oxy-combustion capture show comparable overnight capital costs and levelized costs of electricity to post-combustion capture systems (International Energy Agency, 2013b).
Figure 5: A supercritical pulverized coal power plant with oxy-combustion CO2 capture, reproduced from MIT’s Future of Coal study
The technology needed for carbon capture from industrial processes depends on the specific industry. Industrial applications that are appropriate for CCS include natural gas sweetening, iron and steel production, cement production, and ammonia production. Natural gas sweetening reduces CO2 in natural gas to about 2% by volume before
pipeline transportation and can utilize chemical or physical solvents or membranes, with MEA being the most common. The iron and steel industry has the ability to capture CO2 from blast furnace gas using oxy-combustion and pre-combustion capture from direct reduction of iron. Cement plants produce high concentrations of CO2 in flue gas, making post-combustion and oxy-combustion capture promising technologies. Ammonia
production removes CO2 from a syngas prior to ammonia synthesis, which is very similar to pre-combustion capture in a power plant (Intergovernmental Panel on Climate Change, 2005).
Storage
Decades of research and geologic study have found promising possibilities for successful injection of CO2 for permanent storage in spent oil and gas wells, saline formations, and coal seams. Studies evaluating the global CO2 storage capacity vary widely, with potential of at least 675 Gt CO2 storage from oil and gas wells, 1000 Gt CO2 storage from saline formations, and 3 Gt CO2 from coal seams being conservatively estimated, with other sources reporting potentials that are a couple orders of magnitude higher (Intergovernmental Panel on Climate Change, 2005). Enhanced oil recovery (EOR) is the most promising form of storage in the near term, happening in active oil fields, due to the opportunity for additional revenue from the sale of CO2. As of 2015, 10 projects are currently injecting anthropogenic CO2 for EOR storage, some operating since the 1970s and 80s, and located in the US, Canada, and Brazil (Global CCS Institute, 2014a).
In the longer term, projects will need to move to more geologic storage. Large potential exists for CO2 storage, but concerns remain related to the amount of viable EOR
term storage, and public acceptance. Though storage of CO2 presents potential barriers to deployment, this thesis focuses on financial incentives and barriers for carbon capture.
2.2 Projects operating with CCS
This section divides large-scale CCS projects (>$100 million) into two categories: those projects that have received little to no government financial support, and those projects that are receiving some substantial amount of government money.
There are six projects that are either completed or under construction that were built with limited government support. Of these, five were on industrial processes and one is at a power plant, highlighted further in Table 1.
Table 1: Key characteristics of independently financed CCS projects1 Name CO2 Source Started
operation
Project Driver Weyburn Synfuels plant 2000 EOR revenue
Schwarze Pumpe PC power plant 2008 Private investment from Vattenfall for RD&D
Sleipner Natural gas processing
1996 Norwegian CO2 tax
In Salah 2004 Private investment from
BP for RD&D
Snøvit 2008 Norwegian CO2 tax
Gorgon 2015
(expected)
High NG price in Asia, voluntary inclusion
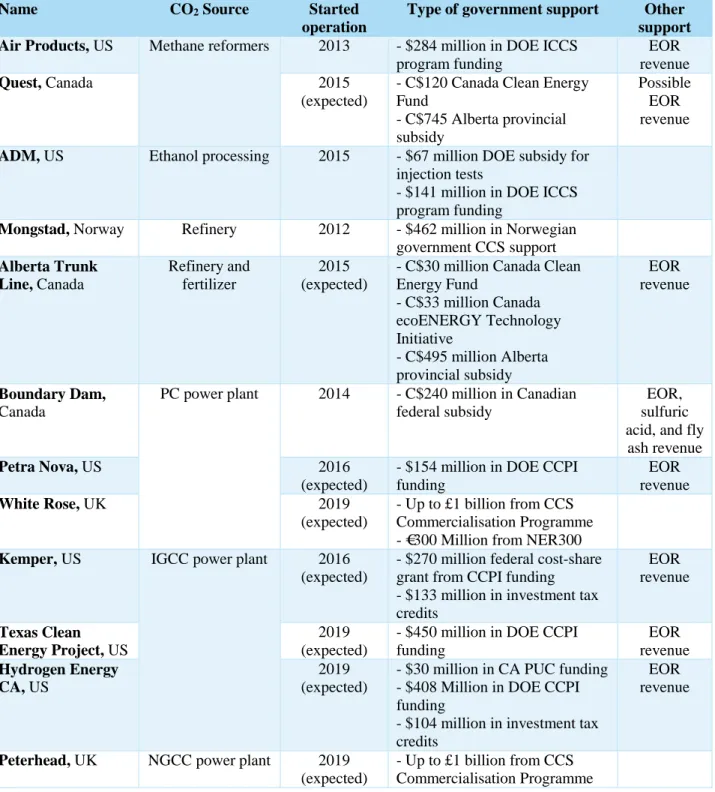
Of government-supported projects, seven are at power plants (one operating, two under construction, four in planning) and five are at industrial facilities (three operating, two under construction) and are shown in Table 2.
1 More information on all projects listed here can be found on the MIT project database (Massachusetts
Institute of Technology, 2015)
Table 2: Key characteristics of major government-supported CCS projects2
Name CO2 Source Started
operation
Type of government support Other
support
Air Products, US Methane reformers 2013 - $284 million in DOE ICCS
program funding
EOR revenue
Quest, Canada 2015
(expected)
- C$120 Canada Clean Energy Fund - C$745 Alberta provincial subsidy Possible EOR revenue
ADM, US Ethanol processing 2015 - $67 million DOE subsidy for
injection tests
- $141 million in DOE ICCS program funding
Mongstad, Norway Refinery 2012 - $462 million in Norwegian
government CCS support Alberta Trunk Line, Canada Refinery and fertilizer 2015 (expected)
- C$30 million Canada Clean Energy Fund - C$33 million Canada ecoENERGY Technology Initiative - C$495 million Alberta provincial subsidy EOR revenue Boundary Dam, Canada
PC power plant 2014 - C$240 million in Canadian federal subsidy
EOR, sulfuric acid, and fly
ash revenue
Petra Nova, US 2016
(expected)
- $154 million in DOE CCPI funding EOR revenue White Rose, UK 2019 (expected) - Up to £1 billion from CCS Commercialisation Programme - €300 Million from NER300
Kemper, US IGCC power plant 2016
(expected)
- $270 million federal cost-share grant from CCPI funding - $133 million in investment tax credits EOR revenue Texas Clean Energy Project, US 2019 (expected)
- $450 million in DOE CCPI funding EOR revenue Hydrogen Energy CA, US 2019 (expected)
- $30 million in CA PUC funding - $408 Million in DOE CCPI funding
- $104 million in investment tax credits
EOR revenue
Peterhead, UK NGCC power plant 2019
(expected)
- Up to £1 billion from CCS Commercialisation Programme
2 More information on all projects listed here can be found on the GCCSI and MIT project databases
(Global CCS Institute, 2014a; Massachusetts Institute of Technology, 2015)
Over the past few years, there has been a reduction in the number of CCS projects under development. The Global CCS Institute (GCCSI) actively tracks projects at all stages of development and investment, from project identification to the full-scale operation. GCCSI annual reports show a net loss of 10 projects between 2013 and 2014, and an additional loss of 10 projects the year before, amounting to a loss of 27% in the last two years across all stages of development (Global CCS Institute, 2013, 2014c).
2.3 Assessment of current policies for CCS
Considering the increasing push for climate mitigation technologies and the extent to which CCS has been demonstrated, one would expect to see more utility-scale CCS projects. Like many other low-carbon technologies, CCS shares in political barriers and high capital costs. Unlike other low-carbon technologies, CCS needs a policy driver because it will always be cheaper to emit CO2 from power plants and industrial operations and CCS has no benefits other than CO2 reduction. Both comprehensive climate policy and CCS-specific mechanisms can drive CCS deployment, but implementation of both kinds of policies has varied in regional implementation.
2.3.1 US: EPA Clean Air Act rules
Comprehensive climate policy:
Legislative approaches to comprehensive climate change policy have been widely shot down in the United States, so it took a Supreme Court case in 2007 to get the US to start regulating GHGs at a national level (U.S., 2007). The relevant outcomes for CCS are the two recently proposed rules on new and existing power plants. The new power plant rule, NSPS, sets technology-specific standards for coal and natural gas power plants. For coal-fired plants only, it recommends partial CCS capture as a best system of emission
reduction (BSER) to meet an emissions limit of 1100 lb CO2/MWh (U.S. Environmental Protection Agency, 2013a). The existing power plant rule, CPP, lets individual states determine the best way to achieve long term rate-based goals, but says that CCS is not considered a BSER for existing systems (U.S. Environmental Protection Agency, 2014b). CCS-specific mechanisms:
In addition to climate policy, CCS-specific mechanisms have incentivized
deployment, such as $3.4 billion in federal stimulus money from the American Recovery and Reinvestment Act (ARRA) (Wald, 2009). Stimulus money was a significant driver for Petra Nova, TCEP, and HECA projects included in Table 2 through the Clean Coal Power Initiative (CCPI). The Industrial Carbon Capture and Sequestration program (ICCS) was funded by ARRA and supported the Air Products and ADM projects.
Two additional mechanisms for CCS were proposed in President Obama’s 2016 budget. First, refundable investment tax credits of up to $2 billion will be available to new and retrofitted power plants with CCS. The second mechanism focuses on carbon sequestration – a tax credit of $10/tonne stored CO2 through EOR and $50/tonne for all other geologic storage (US Office of Management and Budget, 2015).
2.3.2 Canada: EPA technology requirements
Comprehensive climate policy:
The Canadian government revised their Environmental Protection Act in 2012 to include an emissions limit for coal power plants similar to the US EPA rule for new power plants. The rule sets a limit of 420 tonne CO2/GWh (approximately 940 lb/MWh), for all new coal power plants and units greater than 40 years old (Canadian Ministry of Environment, 2012).
CCS-specific mechanisms:
Much like the US, federal and provincial subsidies are incentivizing deployment of CCS, such as for the Quest, Alberta Truck Line, and Boundary Dam projects.
2.3.3 UK
Comprehensive climate policy:
The UK has an informal carbon tax, called the climate change levy, which is a tax on non-domestic energy used in industry, commerce, agriculture, and public services. The larger incentive to CCS is the contract for differences, which provides protection against variable electricity prices for renewable, nuclear, and CCS-equipped electricity generation, thereby lowering investment risk (Canadian Department of Energy & Climate Change, 2013, 2014).
CCS-specific mechanisms:
A major driver of CCS deployment is a technology-specific mechanism, the CCS Commercialisation competition, which accepts project bids and awards up to £1 billion total in capital funding. The White Rose and Peterhead projects are moving forward in the UK after the second round of funding (U.K. Department of Energy & Climate Change, 2013). White Rose has also received additional backing from EU financial mechanisms.
2.3.4 EU
Comprehensive climate policy:
In Europe, the comprehensive climate policy is the Emissions Trading Scheme (ETS), but a recessed economy and excessive allowances have dropped the carbon price
to be about €7/tonne in early 2015, far lower than what would be necessary to incentivize CCS (Neslen, 2015).
CCS-specific mechanisms:
The New Entrants Reserve of the EU Emissions Trading System (NER300) included allowances for commercial-scale CCS projects in addition to renewable
demonstration projects. This 2009 program sought to be a financial mechanism for “full chain” (i.e. capture, transport, and storage) projects of at least 250 MW of power
generation or 500 kt/y storage for industrial applications. However, no projects were funded in the first round due to a combination of insufficient funding, a lack of flexibility in terms, shifting political circumstances, and a low ETS carbon price (Lupion & Herzog, 2013).
2.3.5 Australia
Comprehensive climate policy:
Australia enacted a carbon tax in 2012, but political pressures led to its repeal in the summer of 2014 (Taylor & Hoyle, 2014). There has been no indication that the carbon tax in Australia encouraged CCS deployment during that time.
CCS-specific mechanisms:
Chapter 3: Assessment of EPA’s new power plant performance
standards
3.1 Background
3.1.1 EPA and GHGs in United States courts
There has long been a consensus in the scientific community on the reality of human-caused climate change linked to emissions of greenhouse gases (GHGs) including carbon dioxide (CO2), methane, and nitrous oxide (IPCC 2013). After decades of political debates, only recently has the United States government started to create regulation in response. The turning point was Massachusetts vs. EPA in 2007, where the US Supreme Court ruled in favor of a group of concerned states petitioning against the EPA to regulate GHGs, specifically related to transportation emissions. At the core of the legal debate was the issue of whether greenhouse gases can be considered “air pollutants” under the definitions of the Clean Air Act (CAA).
The Supreme Court held that GHGs are air pollutants and therefore the EPA must scientifically determine whether these gases “cause, or contribute to, air pollution which may reasonably be anticipated to endanger public health or welfare,” and if so, “the Clean Air Act requires the agency to regulate emissions of the deleterious pollutant from new motor vehicles,” (U.S., 2007).
In 2009, the EPA announced what has become known as the endangerment finding that six greenhouse gases: carbon dioxide, methane, nitrous oxide,
hydrofluorocarbons, perfluorocarbons, and sulfur hexafluoride “taken in combination endanger both the public health and the public welfare of current and future,” (U.S. Environmental Protection Agency, 2009). This finding set in motion the necessity for
GHG emissions standards for light-duty vehicles in 2010 and heavy-duty vehicles in 2011, collectively referred to as the tailpipe rule (U.S. Environmental Protection Agency, 2010a, 2011).
In 2010, the EPA also released the tailoring rule, which set GHG thresholds for regulation of new and existing industrial facilities (U.S. Environmental Protection Agency, 2010b). In the same year, the EPA confirmed it would treat any new pollutants the same way it has treated currently identified GHGs (U.S. Environmental Protection Agency, 2010c). In 2014, the US Supreme Court held that only industrial plants that emit conventional pollutants may be required by the EPA to adopt GHG regulation and
industrial sources that only emit GHGs would not trigger the same permit requirements (Coleman, 2014; U.S., 2014).
The regulation of transport and industrial sectors targeted the “low-hanging fruit,” especially from the automotive industry where improving fuel economy of cars and trucks would increase sales in a time of high gasoline prices (McCarthy, 2013). Reducing emissions from power plants will have greater tradeoffs to industries and consumers. Perhaps for this reason, the EPA did not voluntarily introduce performance standards for GHGs from electric generating units (EGUs); it took two lawsuits against the EPA in 2010 to push the EPA to agree to propose a new source performance standard (NSPS) for power plants by mid-2011 (and finalize by mid-2012) and similarly propose a NSPS for petroleum refineries by late-2011 (and finalize by late-2012). The NSPS for new fossil-fuel-fired EGUs was proposed in April of 2012 (later than anticipated), and due to a high volume of comments on the public record was not finalized as scheduled. A NSPS for oil refineries has yet to be proposed (Meltz, 2014).
3.1.2 Presidential memorandum
In June of 2013, Barack Obama signed a presidential memorandum that directed the EPA to consider the 2.5 million comments received and to revise and re-propose the NSPS by September of 2013. The memorandum directed the EPA to additionally propose carbon pollution standards for modified, reconstructed, and existing power plants under CAA 111(b) and 111(d) by June 1, 2014 and to finalize both rules by June 1, 2015 (Meltz, 2014; White House, 2013). Both rules were proposed by the deadline, and time will tell if the rules will be finalized by the summer of 2015.
3.1.3 NSPS and CPP
On September 20, 2013, the US Environmental Protection Agency (EPA) updated its proposed rule for “Standards of Performance for Greenhouse Gas Emissions from New Stationary Sources: Electric Utility Generating Units,”replacing the original released on April 13, 2012 (Office of the Federal Register, 2014; U.S. Environmental Protection Agency, 2013a). These performance standards set limits on the amount of CO2 that can be emitted per megawatt-hour (MWh) of gross electricity generated from new coal-fired and natural gas-fired (also referred to as gas-fired) power plants built in the US. The rules governing CO2 emissions from existing power plants, known as the Clean Power Plan (CPP) were released June 2, 2014 and both rules (for existing and new builds) are scheduled to be finalized by June 1, 2015 (U.S. Environmental Protection Agency, 2014a; White House, 2013).
3.2 New source performance standards
3.2.1 Introduction
The CO2 limits for the New Source Performance Standards (NSPS) were based on determinations of the “best system of emission reduction (BSER) … adequately
demonstrated,” (U.S. Environmental Protection Agency, 2013a). Considerations for a BSER include feasibility, cost, size of emission reductions and future technology development (U.S. Environmental Protection Agency, 2013a). The proposed rule includes analysis by the EPA that finds partial carbon capture and storage is the BSER for coal-fired power plants, while the BSER for natural gas-fired power plants is high efficiency without CCS.
The proposed rule would require CCS for new coal-fired power plants in order to achieve a standard of 1100 lb CO2/MWh, requiring about 40% capture of CO2 from a conventional supercritical pulverized coal plant.(U.S. Environmental Protection Agency, 2013a) The standard for new natural gas power plants of 1000 lb CO2/MWh can be reached with commercial high efficiency natural gas systems without CCS (U.S. Environmental Protection Agency, 2013a).
Specifically, coal power plants have the option of meeting an 1100 lb CO2/MWh standard on a 12-operating-month rolling average or a lower standard of between 1000 and 1050 lb CO2/MWh on an 84-operating-month rolling average (U.S. Environmental Protection Agency, 2013a). Note that the emissions standard of 1100 lb CO2/MWh is low enough to exclude the possibility of co-firing with natural gas to meet the standard (U.S. Environmental Protection Agency, 2013a). Large natural gas power plants (>250 MWth) must meet a standard of 1000 lb CO2/MWh and smaller natural gas power plants (73-250
MWth) must meet a standard of 1100 lb CO2/MWh both on a 12-operating-month rolling average (U.S. Environmental Protection Agency, 2013a).
This section assesses the EPA’s analysis that resulted in determining CCS as the BSER on coal-fired power plants but not on gas-fired plants. The goal of this assessment is to understand whether there is justification in mandating CCS for new coal plants, but not for new natural gas plants. Note that the absolute criteria for CCS as a BSER are not being judged, only the relative differences as related to coal vs. gas. Therefore, since storage issues are essentially the same for both, this section focuses on an assessment how carbon capture was treated within this rule. Five critical areas have been identified that led to the EPA’s determination: demonstration, technology, costs, power plant cycling, and future technological development. The following sections examine each of these issues.
3.2.2 Demonstration
3.2.2.1 Coal-fired power plants
The EPA found that CCS is feasible for coal “because each step in the process has been demonstrated to be feasible through an extensive literature record, fossil fuel-fired industrial plants currently in commercial operation and pilot-scale fossil fuel-fired EGUs currently in operation, and the progress towards completion of construction of fossil fuel-fired EGUs implementing CCS at commercial scale,” (U.S. Environmental Protection Agency, 2013a).
In the Executive Summary, the EPA rule highlights four installations that they believe demonstrate the feasibility of CCS on coal power systems (U.S. Environmental Protection Agency, 2013a). Note that in the main body of the report, they do mention
additional plants, including Shady Point and Warrior Run (see Table 3). The four plants highlighted are:
1. The Kemper County Energy Facility in Mississippi is an integrated coal gasification combined cycle (IGCC) system under construction.
2. The Texas Clean Energy Project (TCEP) is an IGCC system under development by the Summit Power Group in Odessa, Texas.
3. The Hydrogen Energy California (HECA) project is an IGCC system under development in Kern County, California.
4. The Boundary Dam Project in Saskatchewan, Canada is a retrofit of a current pulverized coal (PC) unit and started operation in October, 2014
Three of the four power plants highlighted by the EPA are IGCC power plants and the fourth is a PC unit. Due to their high capital costs, there are only a handful of IGCC units operating today. MIT’s Future of Coal study states that though more efficient and easier to adapt for CO2 capture than conventional PC units, “the projected capital cost … and operational availability of today’s IGCC technology make it difficult to compete with conventional PC units at this time,” (Massachusetts Institute of Technology, 2007). As more information is gained from development of IGCC projects, capital cost estimates are only increasing. The U.S. Energy Information Administration (EIA) published 2013 estimates of overnight capital costs of IGCC units at $3700-$4400/kW, a 19% increase from 2010 estimates and significantly higher than PC units with costs of
$2900-$3200/kW (U.S. Energy Information Administration, 2013e).
Kemper, HECA and TCEP are all unique installations. The Southern Company Kemper County IGCC power plant plans to start operating in 2016 using Mississippi lignite coal and will inject the CO2 for enhanced oil recovery. It uses a first-of-a-kind gasification technology, TRIG. Southern Company objected to its use as an example for
the rest of the country in a public statement after the EPA proposal, saying, “Because the unique characteristics that make the project the right choice for Mississippi cannot be consistently replicated on a national level, the Kemper County Energy Facility should not serve as a primary basis for new emissions standards impacting all new coal-fired power plants,” (Hallerman, 2013). Furthermore, both the HECA and TCEP projects are not pure power plants, but also produce chemicals. As with Kemper, they would be hard to
replicate on a national level.
In summary, IGCC is currently too expensive to be a viable alternative to PC power plants. The instances where IGCC plants are being pursued are very unique
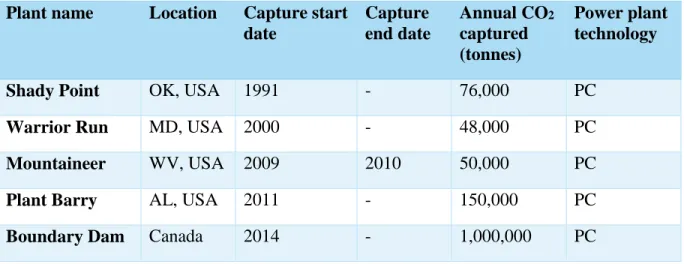
circumstances and should not be generalized. Therefore, relevant demonstrations of CCS on coal-fired power plants for the purposes of these new source performance standards should be confined to PC technology. Table 3 shows the relevant assessment of
demonstrated pulverized coal units with CCS (Massachusetts Institute of Technology, 2015). Only installations on the scale of approximately 50,000 t CO2 captured per year and larger are included because they can be considered either demonstration or
commercial units. Smaller units are used primarily for research purposes. All installations continue to operate today with the exception of the Mountaineer installation, managed by AEP, that is no longer operating due to lack of clear climate policy in the US
Table 3: Relevant projects demonstrating CCS at coal-fired power plants Plant name Location Capture start
date Capture end date Annual CO2 captured (tonnes) Power plant technology
Shady Point OK, USA 1991 - 76,000 PC
Warrior Run MD, USA 2000 - 48,000 PC
Mountaineer WV, USA 2009 2010 50,000 PC
Plant Barry AL, USA 2011 - 150,000 PC
Boundary Dam Canada 2014 - 1,000,000 PC
3.2.2.2 Natural gas-fired power plants
The EPA states that “CCS has not been implemented for NGCC units and we believe there is insufficient information to make a determination regarding the technical feasibility of implementing CCS at these types of units,” and that they are “not aware of any demonstrations of NGCC units implementing CCS technology that would justify setting a national standard,” (U.S. Environmental Protection Agency, 2013a).
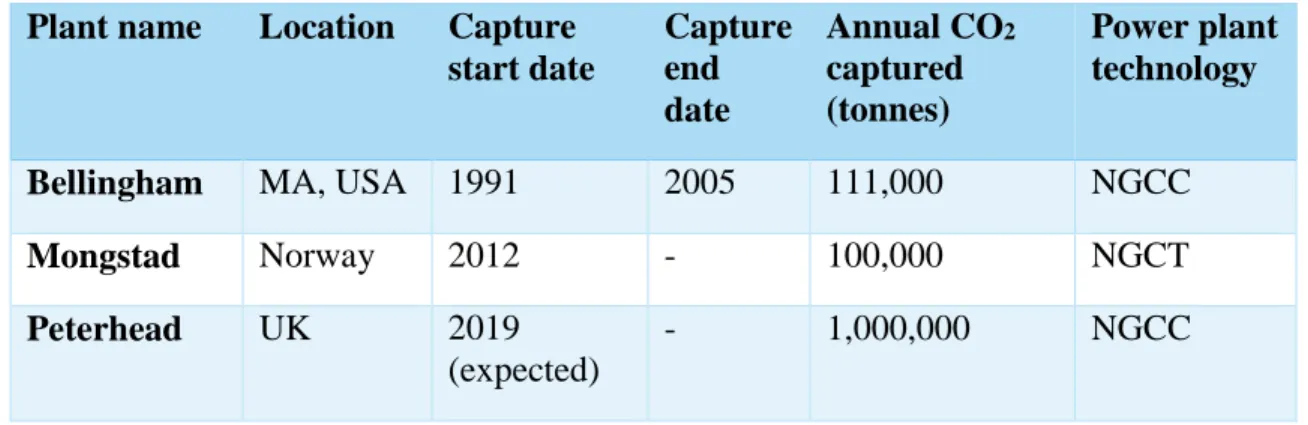
When talking about carbon capture on natural gas power plants, two technologies are considered here: natural gas boilers and natural gas combustion turbines. Though CCS has been demonstrated on many natural gas boilers on a scale of hundreds of tons of CO2 per day, exhaust gases of combustion turbines provide a more appropriate focus because combustion turbines will be the primary technology used in future base load natural gas-fired power plants. Turbines can be categorized as simple cycle (NGCT) or combined cycle (NGCC) systems. The exhaust gases from NGCT and NGCC have essentially the same composition, so the same CO2 capture plant can handle either exhaust. Therefore both single-cycle and combined-cycle systems are considered as relevant technologies for demonstration of CCS on natural gas power plants. Table 4
summarizes the relevant assessment of carbon capture on natural gas combustion turbine power plants (Massachusetts Institute of Technology, 2015). The Bellingham operation was halted after an increase in natural gas prices and a need for the power plant to operate as a peak load power plant instead of a base load power plant, but successfully
demonstrated the technology during its tenure (Fluor, 2013).
Table 4: Relevant projects demonstrating CCS at natural gas-fired power plants Plant name Location Capture
start date Capture end date Annual CO2 captured (tonnes) Power plant technology
Bellingham MA, USA 1991 2005 111,000 NGCC
Mongstad Norway 2012 - 100,000 NGCT
Peterhead UK 2019
(expected)
- 1,000,000 NGCC
3.2.2.3 Summary
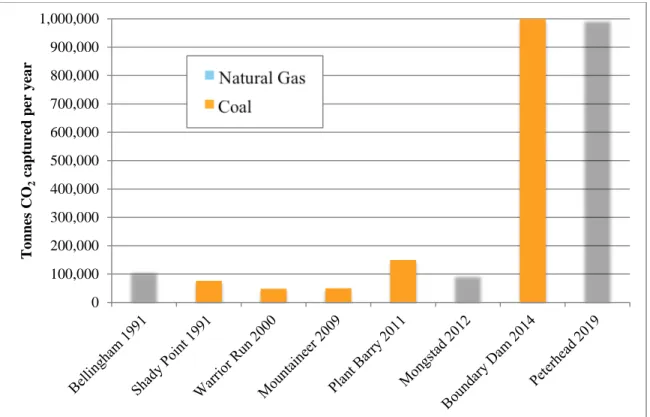
Figure 6 summarizes the assessment of where CCS has been demonstrated on power plants using pulverized boilers or natural gas turbines and producing
approximately 50,000 t CO2 per year or more. On the 100,000 ton per year scale, CCS has been demonstrated equally well on both coal-fired and natural gas-fired power plants. On the million ton per year scale, there is one coal unit that began operation in 2014 and a gas unit projected to go on-line in 2019. It is therefore hard to understand the distinction being made in the proposed rule as to the technological readiness of coal-fired vs. natural gas-fired CO2 capture.
Figure 6: Relevant CCS power plant project by year it became operational and amount of CO2 captured
3.2.3 Technology
On applying CCS technology to exhaust gases from NGCC units compared to PC units, the proposed rule states that “the EPA does not have sufficient information on the prospects of transferring the coal-based experience with CCS to NGCC units. …The concentration of CO2 in the flue gas stream of a coal combustion unit is normally about four times higher than the concentration of CO2 in a natural gas-fired unit,” (U.S. Environmental Protection Agency, 2013a). Two issues need to be raised related to this statement:
1. While CO2 concentrations in the flue gas are important in determining
feasibility and costs, other characteristics of the flue gas are also important in making these determinations (Intergovernmental Panel on Climate Change, 2005). 0 100,000 200,000 300,000 400,000 500,000 600,000 700,000 800,000 900,000 1,000,000 To n n es C O2 ca p tu red p er y ea r
2. Historically, CO2 capture technology has been applied first to exhausts from gas-fired units and then transferred to coal-fired units, not the other way around as implied by the EPA (Rochelle, 2009).
There are multiple characteristics that need to be considered when applying CO2 capture to a flue gas. As raised by the EPA rule, the concentration of CO2 in the flue gas is important. In general, the lower the concentration of CO2, the more costly it will be to remove from the flue gas. However, other important considerations are:
1. Oxygen (O2) in the flue gas can lead to corrosion and solvent degradation, which is usually controlled by adding inhibitors to the solvent.
2. Sulfur Oxides (SOX) in the exhaust gas will react with the solvent to form heat-stable salts. To reclaim the solvent, additional equipment and energy use is required.
3. Particulates will lead to foaming of the solvent, making the process inoperative. To prevent this, adequate cleanup prior to the CCS unit is required, as well as adequate filtration of the solvent in the CCS unit.
In comparing flue gas from NGCC and PC units, NGCC has lower CO2 concentrations and higher O2 concentrations, but essentially no SOX or particulates. Historically, as is shown below, CCS technology has first been used for gas-fired exhausts and then adapted to coal-fired exhausts. This implies that coal-fired exhausts pose more feasibility problems for CCS than do those from gas-fired plants.
Fluor highlighted three reasons that their technology was “notable” in the Bellingham, MA NGCC installation: 1) that the CO2 concentration in the flue gas was low (2.8-3.1%), 2) that the oxygen concentration was high (13% by volume), and 3) that
constant pressure of the flue gas must be maintained (Reddy, Scherffius, & Freguia, 2003). The operation of the plant for about 15 years showed that these challenges could be adequately addressed.
Aker Solutions (previously known as Aker Clean Carbon), the developer of the CCS technology used at Mongstad, stated that the company “considers its technology qualified for full-scale application” on gas turbine exhausts (Anheden, 2013).
As with Fluor and Aker, MHI developed their solvent originally for gas-fired exhausts and now are working to transfer that technology to coal-fired exhausts (Sander & Mariz, 1992; Strazisar, Anderson, & White, 2001). MHI released a statement before the start of the pilot project at the Plant Barry coal-fired power plant in 2009, saying that though “the technology to recover and compress CO2 from natural gas-fired flue gas has already been applied commercially, the planned development and demonstration testing of the plant in the application of CO2 recovery from flue gas of a coal-fired generation plant, which contains more impurities, will be on a scale unprecedented anywhere in the world,” (Mitsubishi Heavy Industries, 2009).
In summary, the demonstration and performance of CCS systems confirm that there are no technological barriers that make scaling up carbon capture technology on natural gas combustion turbine systems any less feasible than on coal systems. Both systems must deal with a set of technological challenges that have been addressed by technology manufacturers through years of pilot and demonstration projects.
3.2.4 Costs
The EPA uses a cost criterion based on cost of electricity (COE), concluding that new technologies should fit within the range of other current electric generating
technologies. “Based on data from the EIA and the DOE National Energy and
Technology Laboratory (NETL), the EPA believes that the levelized cost of technologies other than coal with CCS and NGCC range from $80/MWh to $130/MWh,” (U.S.
Environmental Protection Agency, 2013a). The EPA finds full capture (about 90%) of CO2 on supercritical pulverized coal systems to have a cost of $147/MWh, which is “outside the range of costs that companies are considering for comparable generation and therefore should not be considered BSER for CO2 emissions for coal-fired power plants,” (U.S. Environmental Protection Agency, 2013a). Partial capture of CO2 (about 40% for supercritical PC), according to the EPA, has costs “ranging from $92/MWh to
$110/MWh, depending upon assumptions about technology choices and the amount, if any, of revenue from sale of CO2 for EOR [Enhanced Oil Recovery],” (U.S.
Environmental Protection Agency, 2013a). The EPA argument is that because partial CCS on coal is within the range and full CCS is outside the range, it follows that partial CCS can be considered as the BSER because its “implementation costs are reasonable,” (U.S. Environmental Protection Agency, 2013a).
This argument leaves two key questions unanswered. The first is that natural gas with full capture of CO2 would be within this range, so why is CCS not considered the BSER for natural gas systems (U.S. Department of Energy, 2013)? The EPA indirectly responds to this issue by arguing that most future power plants will be NGCC and therefore any additional technology requirement on such a large part of the grid would increase electricity prices to the consumer. The EPA states that “identifying partial or full CCS as the BSER for new stationary combustion turbines would have significant adverse effects on national electricity prices, electricity supply, and the structure of the power
sector. Because virtually all new fossil fuel-fired power is projected to use NGCC technology, requiring CCS would have more of an impact on the price of electricity than the few projected coal plants with CCS and the number of projects would make it
difficult to implement in the short term,” (U.S. Environmental Protection Agency,
2013a). The EPA argues that no plans currently exist to construct large coal power plants in the US, and therefore no impact will be seen on electricity rates. This seems to be a different criterion than above, mainly that little or no impact on electricity costs should be associated with requiring new emissions control technologies. In the early 2000s when gas prices were high, it was anticipated that a significant number of new coal-fired power plants would be built. This may be the case again in the future. If that happens, then this regulation would have significant adverse effects on national electricity prices.
Second, why does the EPA not utilize cost-benefit analysis and consider the social cost of carbon? To do a cost-benefit analysis, the conventional approach would be to look at cost per metric ton of CO2 avoided, a calculation that takes into account both the cost of a technology and the environmental benefit from emissions reductions. The
Department of Energy (DOE) reports avoided costs (in 2007$) of $69/t CO2 for
supercritical PC power plants with full CCS and $84/t CO2 for NGCC power plants with full CCS (U.S. Department of Energy, 2013). (Note that in terms of $/t CO2 avoided, costs for partial capture will be higher than full capture (Hildebrand, 2009).) The avoided costs are inclusive of capture, transport, and storage. The no capture reference plant from which the emissions are avoided is taken to be the same technology as the capture plant (i.e., supercritical PC for coal, NGCC for gas).
Following the line of argument that $/t CO2 avoided is the correct metric, then the above numbers should be compared to the U.S. government’s social cost of carbon. The social cost of carbon (SCC) is a financial estimate of damages (environmental, human, economic, etc.) caused by each metric ton of CO2 emitted to the atmosphere (Interagency Working Group on Social Cost of Carbon, 2010). In an effort to include the inherent uncertainty in this kind of estimate, the SCC analysis includes an average of three
different integrated assessment models at three distinct discount rates in addition to a 95th percentile at the median discount rate. The 2013 update of the original 2010 SCC analysis (in 2007$) finds a range from $11-$90/t CO2 avoided (Interagency Working Group on Social Cost of Carbon, 2013). Though the EPA has a potential range of SCC targets to choose from, recent regulation has used a social cost of carbon of about $30/t CO2 and the mean value for a 3% discount rate in the 2013 analysis is $33/t CO2 in 2010 and $43/t CO2 in 2020 (Interagency Working Group on Social Cost of Carbon, 2013). It can be seen that the social cost of carbon is much lower than DOE’s estimate of avoided cost, indicating that neither coal- nor natural gas-fired systems with CCS are cost-effective when current SCC estimates are considered.
Though the EPA does not use a cost-benefit analysis as a criterion for determining the BSER, the Regulatory Impact Analysis (RIA) quantifies the monetized benefits for each BSER using the social cost of carbon. The EPA calculates the difference in costs and monetized emissions benefits between a coal CCS technology and the same coal technology without CCS. For pulverized coal without enhanced oil recovery (EOR), the EPA finds a net benefit in 2020 (in 2011$) of -$21 to $16/MWh for partial CCS and -$44 to $59/MWh for full capture (varying based on discount rate), relative to a supercritical
pulverized coal plant without CCS (U.S. Environmental Protection Agency, 2013b). The range of net benefits given by the EPA showcases the possibility for a positive cost (i.e. negative net benefit) compared to a baseline technology even when incorporating the EPA’s social cost of carbon.
In summary, the methods the EPA used to determine whether the implementation costs are reasonable are arbitrary for three reasons:
1. Using the electricity cost metric, natural gas contains less carbon per unit of heating value than coal and therefore the impact on the electricity cost is less for gas than coal. However, even though both coal and natural gas have CCS options in the $80-130/MWh range given by the EPA, this range was only used as a metric for coal with CCS.
2. Using the cost metric of how electricity prices are impacted, gas-fired power with CCS was deemed too expensive. However, coal-fired power plants were deemed affordable primarily because the United States is not planning to build any new ones at this time. Focusing on regulating power plants that will not be built does not seem productive.
3. Using the mitigation cost metric of $/t CO2 avoided (arguably the proper metric), the costs are about 20-30% greater to apply CCS to gas-fired power plants than coal-fired power plants due to the lower concentration of CO2 in their respective flue gases, but both are well above the current SCC of $33/t CO2. However, this metric was not used to determine the BSER, it was only used for the Regulatory Impact Analysis.
3.2.5 Cycling
The EPA states that the addition of “CCS to a NGCC may limit the operating flexibility in particular during the frequent start-ups/shut-downs and the rapid load change requirements. This cyclical operation, combined with the already low concentration of CO2 in the flue gas stream, means that one cannot assume that the technology can be easily transferred to NGCC without larger scale demonstration
projects on units operating more like a typical NGCC. This would be true for both partial and full capture,” (U.S. Environmental Protection Agency, 2013a).
Not all natural gas power plants are created equal. Due to their ability to operate flexibly, natural gas-fired power plants can be used to meet peak and intermediate electricity demand loads, but many others are designed to meet more steady base load demands. Base load natural gas-fired systems cycle much less than their peaking
counterparts, and this is the category of power plant being evaluated here. After a power plant is built, economic dispatch determines how much a power generator cycles. Even a base load power plant may cycle if there are other power plants generating lower cost electricity at times of low demand. New power plants governed by this rule will be deeper in the base load than existing plants (including coal), making cycling less of an issue than it is for existing plants.
The EPA notes that “while some of these [natural gas] turbines are used to serve base load power demand, many cycle their operation much more frequently than coal-fired power plants. It is unclear how part-load operation and frequent startup and shutdown events would impact the efficiency and reliability of CCS,” (U.S. Environmental Protection Agency, 2013a).
Modeling by Howard Herzog’s research group at MIT has found that post-combustion carbon capture systems can keep up with cycling base load power plants without impacting the capture of carbon dioxide. “Integration of a carbon capture unit with coal-fired power plants can be successfully operated dynamically to meet the current load following requirements of coal-fired power plants while maintaining 90 percent capture rates,” (Brasington, 2012).
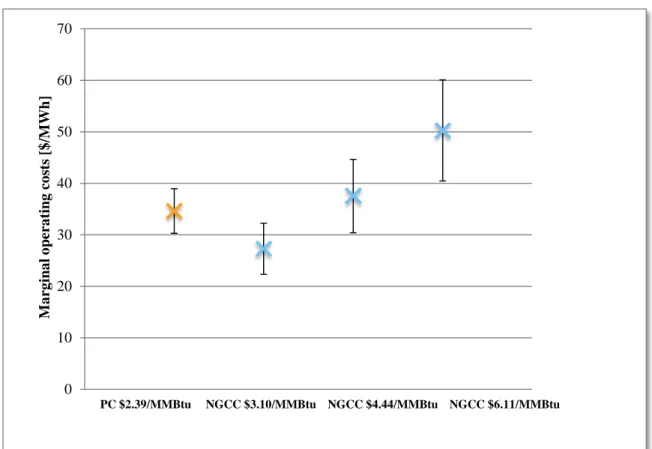
Historically, natural gas prices have driven electricity costs higher compared to coal, driving coal to dispatch first and making gas-fired power plants cycle more often. Due to the recent drop in natural gas prices, there has been a shift to dispatching some natural gas before coal, therefore decreasing cycling of natural gas power plants. Figure 7 utilizes data from the EIA to illustrate the impact of fuel prices on dispatch order and cycling. This figure looks at marginal operating costs (which determine dispatch order) from coal steam turbines and natural gas combined cycle systems. Marginal operating costs include fuel costs as well as variable operations and maintenance (O&M) costs (Eide, 2013). The fuel cost of coal was taken from EIA’s 2013 rolling monthly average ending in September (U.S. Energy Information Administration, 2013b). To show variation in natural gas fuel price three different natural gas prices were examined: $3.10/MMBtu is the lowest monthly average price of natural gas seen in the US in April, 2012; $4.44/MMBtu is the rolling 2013 average cost to electric utilities ending in
September, 2013; and $6.11/MMBtu is the number used by the EPA in their analysis (U.S. Energy Information Administration, 2013c). The range of costs is due to the variation in power plant heat rates and represents 95% confidence limits of US power plants generating more than 300,000 MWh/yr, totaling 347 PC plants and 283 NGCC
plants (U.S. Energy Information Administration, 2012). The 300,000 MWh/yr cut-off eliminates peaking units that may have uncharacteristic heat rates. With low gas prices, natural gas-fired power plants can have lower marginal operating costs than coal, pushing them deeper in the base load than coal power plants, resulting in lower cycling rates than the coal plants they displaced.
Figure 7: Estimated marginal operating costs from pulverized coal and natural gas combined cycle power plants in the United States
In summary, CCS can load follow on base and intermediate load power plants, which will allow for cycling of either coal or natural gas power plants built to target these electricity demands. Additionally, at current natural gas prices, many natural gas plants are lower in the dispatch order than many existing coal plants and will therefore cycle less often. In conclusion, CCS makes cycling more of a challenge for both coal and natural gas, as both systems may cycle depending on their dispatch order. Though
0 10 20 30 40 50 60 70 M ar gi n al op er at in g cos ts [ $/ M W h ]