HAL Id: hal-01866070
https://hal.archives-ouvertes.fr/hal-01866070
Submitted on 23 Nov 2018HAL is a multi-disciplinary open access archive for the deposit and dissemination of sci-entific research documents, whether they are pub-lished or not. The documents may come from teaching and research institutions in France or abroad, or from public or private research centers.
L’archive ouverte pluridisciplinaire HAL, est destinée au dépôt et à la diffusion de documents scientifiques de niveau recherche, publiés ou non, émanant des établissements d’enseignement et de recherche français ou étrangers, des laboratoires publics ou privés.
Upward migration of gas in an active tectonic basin: An
example from the sea of Marmara
Céline Grall, Pierre Henry, Stéphanie Dupré, Louis Geli, Carla Scalabrin,
Tiphaine A.C. Zitter, M. Sengor, M. Namik Cagatay, Gunay Cifci
To cite this version:
Céline Grall, Pierre Henry, Stéphanie Dupré, Louis Geli, Carla Scalabrin, et al.. Upward migration of gas in an active tectonic basin: An example from the sea of Marmara. Deep Sea Research Part II: Topical Studies in Oceanography, Elsevier, 2018, 153, pp.17 - 35. �10.1016/j.dsr2.2018.06.007�. �hal-01866070�
Author’s Accepted Manuscript
UPWARD MIGRATION OF GAS IN AN
ACTIVE TECTONIC BASIN: AN EXAMPLE
FROM THE SEA OF MARMARA
Céline Grall, Pierre Henry, Stéphanie Dupré, Louis
Géli, Carla Scalabrin, Tiphaine A.C. Zitter,
A.M.Celal Sengor, M. Namik Cagatay, Gunay
Cifci
PII:
S0967-0645(17)30136-4
DOI:
https://doi.org/10.1016/j.dsr2.2018.06.007
Reference:
DSRII4462
To appear in:
Deep-Sea Research Part II
Received date: 22 April 2017
Revised date:
13 June 2018
Accepted date: 14 June 2018
Cite this article as: Céline Grall, Pierre Henry, Stéphanie Dupré, Louis Géli,
Carla Scalabrin, Tiphaine A.C. Zitter, A.M.Celal Sengor, M. Namik Cagatay and
Gunay Cifci, UPWARD MIGRATION OF GAS IN AN ACTIVE TECTONIC
BASIN: AN EXAMPLE FROM THE SEA OF MARMARA,
Deep-Sea
Research Part II,
https://doi.org/10.1016/j.dsr2.2018.06.007
This is a PDF file of an unedited manuscript that has been accepted for
publication. As a service to our customers we are providing this early version of
the manuscript. The manuscript will undergo copyediting, typesetting, and
review of the resulting galley proof before it is published in its final citable form.
Please note that during the production process errors may be discovered which
could affect the content, and all legal disclaimers that apply to the journal pertain.
1
UPWARD
MIGRATION
OF
GAS
IN
AN
ACTIVE
TECTONIC
BASIN:
AN
EXAMPLE
FROM
THE
SEA
OF
MARMARA
Céline Gralla, Pierre Henryb, Stéphanie Dupré; Louis Géli, Carla Scalabrinc, Tiphaine A.C. Zitterd, A.M.Celal Sengore, M. Namik Cagataye
, Gunay Cifcif a
b
c
Lamont-Doherty Earth Observatory of Columbia University, Palisades, NY, USA Aix-Marseille Univ, CNRS, IRD, INRA, Coll France, CEREGE, Aix-en-Provence, France IFREMER, Marine Geosciences Unit, Plouzané, France
dATGEO, Aix-en-Provence, France e
İstanbul Teknik Üniversitesi, Maden Fakültesi, Jeoloji Bölümü, Ayazağa 34469 İstanbul, Turkey
f
Dokuz Eylül University, Izmir, Turkey
1. A
BSTRACTGases of various sources were collected at the seafloor of the Marmara basin suggesting that the gases expelled have experienced multiple sequences of upward migration, from multiple sources. The pathways of upward migration of gas can be reconstructed by considering the distribution of gas seeps with respect to the near-surface geomorphostructure and the regional stratigraphic architecture of the Marmara Basin. Gas seeps appear to be more favourably localized within a 1-2 km swath around active faults where sediment permeability is probably enhanced by deformation. In the fault zones, fault intersections between sets of transtensive and transpressive subsidiary faults, or between subsidiary faults and main faults, are the preferred gas pathways. These subsidiary structures localize methane seeps, observed as elongated black patches with bacterial mats, gas bubble emission sites, and chemoherms associated with buried mud volcanoes. Gas seeps are, however, rare along active faults segments crossing basin depocenters but focus along basin edges and along topographic highs. Considering the role of sedimentary layers as gas migration pathways can explain this characteristic of the distribution of gas seeps. Fault zones that cross updip gas migration pathways will vent comparatively more gas than fault
2
zones on the downdip side. Moreover, gas accumulation and resulting overpressuring along the western fault segment crossing the Western High may be associated with aseismic fault creep and intense gas emissions at the seafloor. In contrast, the poorly focused seepage along the fault segment crossing the Central High may be linked to the locked state of this fault segment.
2.
I
NTRODUCTIONGas seeps at the seafloor or on land are often localized along active faults, suggesting that active faults play a major role in venting gas towards the surface (Le Pichon et al., 1992; Sahling et al., 2008; Ranero et al., 2008, Henry et al., 2002). The fluidization of gas-rich sediments associated with mud eruption and mud volcano build-up requires high pore fluid overpressures and is encountered mostly in compressive and transpressive tectonic settings (e.g. Chamot-Rooke et al., 2005, Kopf et al., 2002, Moore et al., 1990, Higgins and Saunders; 1974, Westbrook et al., 1983, Manga and Wang, 2007). Hence, gas migration and fault activity are probably inter-linked (Le Pichon et al., 1992, e.g. Ernst, 1970, Guglielmi et al., 2014 and 2015, Hosseinyar et al., 2014, Ellsworth, 2013).
Emissions of gas through the seafloor are widespread in sedimentary basins (e.g. Paull et al., 1984; Dupré et al., 2010). The primary reason is that gas, mainly methane, is produced in all sedimentary basins and migrates through the sediment pore-water towards the surface (Figure 1). Gas is produced by the degradation of sediment organic matter, either by anaerobic bacterial decomposition (microbial gas; e.g. Barnes and Goldberg, 1976; Head et al., 2003) or thermal cracking (thermogenic gas; e.g. Tissot and Welte, 1984). These two processes occur within the sediments, at different depths and under different conditions (Figure 1). Gas can also be delivered by the crust and the mantle (Kennedy et al., 1997), in particular in zones of extension (e.g. Brauer et al., 2009). Gas can be efficiently trapped at various depths in reservoir units (sediments with high porosity and permeability) that are sealed by a cap of low permeability strata (Figure 1). Overpressure can be generated in reservoir units. Overpressure lowers the effective stress, thus favouring the development of brittle structures that act as gas migration pathways (Gay et al., 2003 and 2004, Figure 1).
Gas migrates through the sediment pore-fluids (water and oil) mainly by buoyancy. Such kind of migration is sensitive to capillarity effects (Henry et al., 1999), notably at sedimentary discontinuities like a clay/sand interface, as clays are characterized by high capillarity forces
3
and low permeability (e.g. Judd, 2009). Gas can migrate updip over long distances along these sedimentary discontinuities (up to 400 km, Clayton et al., 1980; Tainter, 1984, Figure 1). Thus, buoyancy driven gas migration along sediment interfaces tilting basinward drives gas toward basin margins and adjacent topographic highs (Figure 1). This explains why gas accumulates more favourably in topographic highs (anticline trap) and onlap tips (stratigraphic trap) (Figure 1, Bethke et al., 1991; Clayton et al., 1992). Fault displacement can further compartmentalize reservoir units and create gas traps (tectonic trap, Figure 1, Bense and Person, 2006). In contrast, faults also act as conduits for gas migration, when fault zone permeability is increased by fracturing (Eichhubl et al., 2000) forming a damage zone (Figure 1). Faults may thus channel fluid from the source rock (primary migration) or from a gas reservoir (secondary migration) (Figure 1). This can result in charging a reservoir (e.g. Rollet et al., 2006) or gas leaking at the surface (Figure 1). In tectonically active basins, gas migration probably occurs along multiple tectonic and stratigraphic interfaces; and thus, gas rarely migrates directly from the gas source to the surface.
In this paper, we consider the morphotectonic context at the subsurface and the regional stratigraphic architecture of the Marmara Basin to reconstruct the gas migration history in an active tectonic basin and to analyse the relationship between gas migration and faults (Figure 1). First, we integrate seismic reflection data, seafloor morphology, acoustic data (water-column, chirp sub-bottom profiles) and dive visual observations to characterize the distribution and diversity of cold seeps at the seafloor and their relationship with the morphotectonic context in the subsurface. Then we combine these observations on the basin scale (~10-100 km) to provide a framework for discussing the underlying gas migration pathways that can be inferred from the spatial distribution of seeps relative to active faults and the sources of the gas expelled (microbial/thermogenic).
3. OVERVIEW
OF
GAS
SEEPS
IN
THE
SEA
OF
MARMARA
The systematic mapping of gas echoes at the seafloor was carried out on the scale of Marmara Basin, the Central part of the Sea of Marmara that is cross-cut by the Main Marmara Fault (MMF). The MMF accommodates most (~16-22 mm/a, Le Pichon et al., 2015; Grall et al., 2013, Kurt et al., 2013) of the dextral deformation between the Eurasian and Anatolian Plates, and a succession of small deep basins and topographic highs are formed along the different fault segments (Figure 2). Gas venting is more favourably localized at
4
basin edges and topographic highs (Dupré et al., 2015, Figure 2) and active faults play a role in venting the gas at the seafloor (Géli et al., 2008; Dupré et al., 2015, Figure 2). Statistical analysis of the distance to water column echoes to the nearest fault shows that gas seeps occur preferentially within a 1-2 km narrow zone of active fault segments (Henry et al., this issue). This indicates that active fault zones can locally increase permeability and provide conduits for the upward migration of gas.
The majority of cold seeps sampled at the Sea of Marmara are gas seeps (dominantly methane). Some brackish water seeps (from lacustrine sediments at shallow depths) have also been described at basin edges (Zitter et al., 2008 and notably the water seep named Jack the Smoker). Most gas seeps contain free-phase gas in ambient sea or brackish water (Tryon et al., 2010). Pure microbial gas source signature with no evidence of secondary degradation (Ruffine et al., this issue) was found at gas seeps located at the edges of the Çinarcik and Tekirdağ deep-basins (Figure 2). This suggests that the gas originated from local microbial sources in the basin and has migrated updip to basin edges (Figure 1). Most of the gas originating from thermogenic sources are located in the western part of the Sea of Marmara where gas seeps display diverse compositions and origins. These seeps are located on the edges of Tekirdağ basin and at the Western High, at active fault zones (Figure 2). One gas venting complex, located at the western edge of Tekirdağ basin, expels a mixture of gasses comprising thermogenic and microbial hydrocarbon sources and a CO2-rich source,
probably derived from mantle (Boris’ the Bubblers, Burnard et al., 2012) in variable proportions. The microbial fraction of the gas shows evidence of both primary methane generation from organic matter and secondary methanogenesis from hydrocarbon biodegradation (Ruffine et al., this issue), suggesting that these gas seeps are fed by various sources with different migration histories (Figure 1). Thermogenic gas, mixed with secondary microbial gas, is also found at the Western High, where sub-surface gas hydrate accumulations were sampled (Boury et al., 2008; Ruffine et al., 2010, Figure 1). A liquid hydrocarbon phase is also present at this site and there is no contribution from mantle (Burnard et al., 2012; Ruffine et al., this issue). At other locations on the Western High, the gas expelled contains a proportion of primary microbial methane. At the Central High (Figure 2), gas seeps are a mixture of thermogenic and microbial gas (Ruffine et al., this issue), always with a component of secondary methanogenesis (Ruffine et al., this issue), indicating
5
that the gas does not come directly from the gas source; and thus, and has experienced multiple episodes of migration (secondary migration, Figure 1).
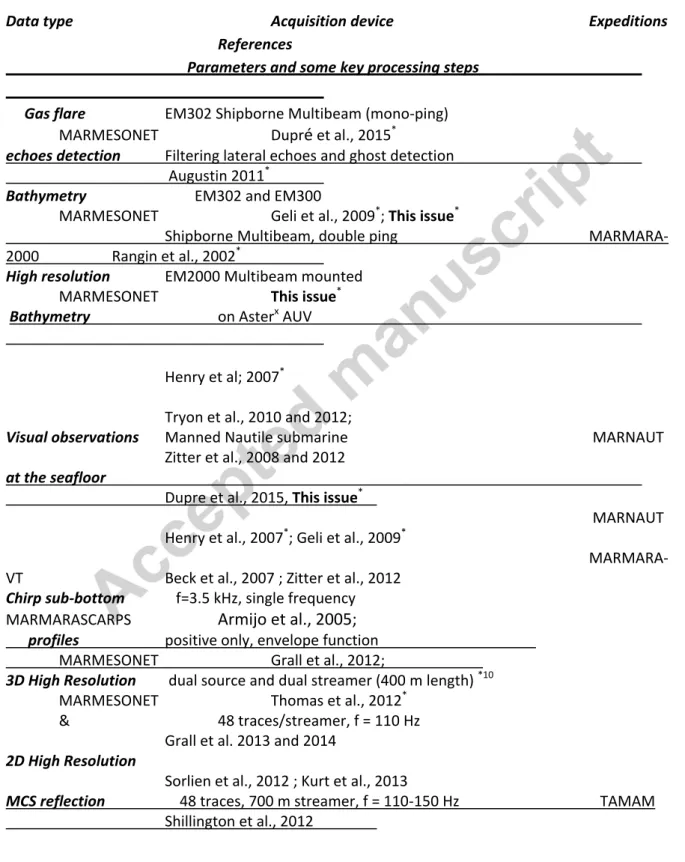
Table 1: Marine datasets used in this study
Data type Acquisition device Expeditions
References
Parameters and some key processing steps
Gas flare EM302 Shipborne Multibeam (mono-ping) MARMESONET Dupré et al., 2015*
echoes detection Filtering lateral echoes and ghost detection Augustin 2011*
Bathymetry EM302 and EM300
MARMESONET Geli et al., 2009*; This issue*
Shipborne Multibeam, double ping
MARMARA-2000 Rangin et al., 2002*
High resolution EM2000 Multibeam mounted
MARMESONET This issue*
Bathymetry on Asterx AUV
Henry et al; 2007*
Tryon et al., 2010 and 2012;
Visual observations Manned Nautile submarine MARNAUT Zitter et al., 2008 and 2012
at the seafloor
Dupre et al., 2015, This issue*
MARNAUT Henry et al., 2007*; Geli et al., 2009*
MARMARA-VT Beck et al., 2007 ; Zitter et al., 2012
Chirp sub-bottom f=3.5 kHz, single frequency
MARMARASCARPS Armijo et al., 2005;
profiles positive only, envelope function MARMESONET Grall et al., 2012;
3D High Resolution dual source and dual streamer (400 m length) *10 MARMESONET Thomas et al., 2012*
& 48 traces/streamer, f = 110 Hz Grall et al. 2013 and 2014
2D High Resolution
Sorlien et al., 2012 ; Kurt et al., 2013
MCS reflection 48 traces, 700 m streamer, f = 110-150 Hz TAMAM Shillington et al., 2012
6
Low frequency (6-15 Hz) + Bubble (30-50 Hz) SEISMARMARA, Leg I Becel et al., 2009, 2010*
4.5 km length streamer, 360 traces and Leg 2 Laigle et al., 2008*, Grall et al., 2012
2D MCS
Carton et al., 2007*
Reflection Variable frequency and streamer (Low Frequency) TPAO, Industrial Data Sengor et al., 2014
2D wide-angle MCS 2D OBS network, SEISMARMARA, Leg I* Becel et al., 2010*;
Refraction 3-D first arrival time tomography and Leg 2* Bayrakci et al., 2013*
References highlighted by a star described the acquisition devices and the data processing. MCS stands for Multi-Channel Seismics.
4. DATASET,
DATA
PROCESSING
AND
DATA
INTEGRATION
A summary of all sets of data considered in this study is provided in Table 1. Previously unpublished data presented in this study were acquired during Marnaut and Marmesonet cruises and detailed information about the acquisition can be found in cruise reports (Henry et al., 2007; Geli et al., 2009). Processing information about these unpublished datasets is provided hereafter. Shipborne EM 300 and EM 302 multibeam systems (mounted of R/V Le Suroît) work at a frequency of 27–33 kHz, with 2 and 5 ms pulse length (e.g. Dupre et al., 2015 and Rangin et al., 2002) respectively. During the Marmesonet cruise, about 70 km2 (Figure 1) of very high resolution bathymetric and seafloor backscatter (acoustic reflectivity) data were collected using a high-frequency (200 kHz) multibeam echosounder (SIMRAD EM2000) mounted on the AsterX AUV (Dupré et al., 2008). The vehicle navigated at an altitude ranging from 50 to 70 m above seafloor, giving a swath width of 150-200 m. This dataset was processed and cleaned up using CARAIBES (@ IFREMER) software to produce a bathymetric grid and seafloor backscatter images with lateral and vertical resolution of 2 and 1 m, respectively. However, uncertainty on the absolute positioning of the data remained relatively high (around 20 m), due to uncertainties on the navigation of the AUV. Nautile dive observations have similar uncertainty on positioning. However, the EM302 shipborne multibeam data coverage is particularly good where AUV and Nautile dives are conducted and allows producing grids with a resolution and accuracy of 10 m. In turn, these grids were
7
used to relocate AUV data and Nautile dive observations. This allows us an accuracy of about 10 m for the horizontal location of both relocated AUV and Multibeam data. Water column echoes are located with a comparable accuracy, but generally define zones of several tens of meters width that may correspond to a single or to several gas emission sites at the seafloor. The resolution on the location of the source of gas flares inferred from the water column echo is thus about 50 m (Dupré et al., 2015) and dots representing the gas flares were scaled accordingly on the figures. Compilation and representation of MNT and acoustic anomaly data were carried out by using the ArcView package. Shipborne EM302 data acquired during MARMESONET cruise was processed and combined with shipborne EM300 data (Le Pichon et al., 2003; Rangin et al., 2002). This work provides improvement of the global resolution of the bathymetric grid of the Marmara Basin available (Rangin et al., 2000) from 38 m to 25 m (figure 2, see supplemental materials for data availability).
5. M
ETHODS:
5.1.
MORPHOTECTONIC MAPPING AND INTERPRETATIONWe have combined geomorphotectonic interpretations of high resolution bathymetry with maps of gas seeps derived from multibeam water column data. Geomorphotectonic interpretations are carried out by identifying all seafloor scarps and scars with more than 5 meters of topographic surface expression. Chirp sub-bottom profiles are used to evaluate if observed seafloor deformation is related to sub-surface features such as faults. Chirp sub-bottom profile images were difficult to exploit on topographic highs, but a high-resolution 3D seismic data block was collected on the Western High (e.g. Thomas et al., 2012; Grall et al., 2013; Grall et al., 2014) and is used to constrain the interpretation of the seafloor morphology. The strike of all features identified is measured and interpreted considering Riedel shear theory (Riedel, 1929; Tchalenko, 1979; e.g. Sengor et al., 2014, Figure 3). Riedel faults are subsidiary shear planes that splay from a main strike slip fault or form within a shear zone and are coeval with the main fault or shear zone (e.g. Sengor et al., 2014). Riedel shear theory predicts the orientation of shear planes with respect to that of the main fault or shear zone (F (fold), P, R, R’, T (Tension gash), X, Figure 3). The orientations of subsidiary Riedel shears may vary slightly (Figure 3) if the main fault is a pure strike-slip fault (e.g. ideally oriented with respect to the strike slip strain field), or if the main fault is transtensive or transpressive
8
(e.g. oblique to the strike slip strain field). This framework helps to determine the nature of the deformation where vertical displacement was identified. For instance, if the strike of the shear planes observed is close to the T-axis of the Riedel system, we thus interpret it as a tension gash (Figure 3). In various places, surface instabilities such as gullies, landslides scars and mass transport deposits are observed along fault structures. Such features were identified in the bathymetry and backscatter data was used to refine mapping interpretations.
Visual observations of rough seafloor from Nautile submersible dives correlate with EM2000 seafloor backscatter intensity (e.g. Figure 4 and supplemental material 1) where both data sets are available. Scree slopes, debris slides, fault scarps and carbonate crust outcrops typically have high backscatter amplitudes. Conversely, bioturbated sediments at the seafloor are characterized by low backscatter amplitudes (Figure 2). A correlation between high backscatter and seafloor roughness associated with scree and debris slides or flows, or the presence of coarse sediments, is indeed often reported for high frequency (>100 kHz) side-scan sonars or multi-beam sounders, while lower frequency systems (e.g. EM12) often reveal buried features (cf. Lamarche et al., 2011; Mitchell et al., 1993; Henry et al., 1996; Chamot-Rooke et al., 2005). This information is used to map actively-eroding slopes and debris slides. Using this approach, a map of active faults (red) and surface erosional features (black, Figures 5, 6, 8, 9, 11, 12) was created for the entire dataset.
All information about gas seeps (e.g. gas flare echoes and seep visual observations) are superimposed on the geomorphotectonic interpretation in order to evaluate the spatial relationship between them. Different categories of seeps are defined and the geometry of the seeps are reconstructed from dive observations (size and also strike if seeps appear elongated in preferential directions). This information proved to be very helpful to establish a link between morphotectonic features and gas seeps.
5.2. SEEP CHARACTERIZATION
Detailed marine surveys reveal a great variety of gas seeps regarding their morphology as well as their composition (Roberts et al, 1994; Judd and Hovland, 2007). Morphology of gas seeps ranges from flat patches, to collapse depressions such as pockmarks (King and Maclean, 1970; e.g. Mazurenko and Soloviev, 2003; Berndt, 2005; Gay et al., 2007, 2006;
9
Loncke et al., 2004; Sultan et al., 2010), or to build-up structures such as carbonate mounds, chimneys, or mud volcanoes (e.g. Moore et al., 1990; Heggland et al., 2000; Kopf et al., 2002, Higgins and Saunders; 1974).
The variety of gas seeps depends notably on the development of microbial ecosystems (involving methanotrophic, sulfidotrophic bacteria and opportunist bacteria, Sassen et al., 1993, Hovland, 2002; Teichert et al., 2005; Paull et al., 1984; Sibuet et al., 1998 and 2005; Olu et al., 1996; Ritt et al., 2012) ; and on the microbial production of authigenic carbonates (Kulm et al., 1986; Kulm and Suess, 1990; Von Rad et al., 1996; Aloisi et al., 2000; Zitter et al. 2008; Tryon et al., 2012). Among controlling variables, the composition, intensity and duration of fluid flows are the most significant (Levin, 2005; Sibuet and Olu, 1998, Henry et al., 2002, Taviani et al., 2013). In particular, the formation of carbonate crusts at gas seeps may require long lasting gas venting (hundreds to thousands of years) and may thus be indicative of the persistence of gas seeps with time (Taviani et al., 2013; Aloisi et al., 2004; Crémière et al., 2013; Cagatay et al., 2018). Visual observations on microbial activity and the occurrence of carbonate crusts at cold seeps are reported in Table 2. We use these observations as a possible indicator of the duration of gas seeps, and their links with gas accumulation domains at shallow depths.
6.
R
ESULTS6.1. Morphotectonic context of gas venting area:
6.1.a. Gas venting and fault deformation zone at basin edges:
The Çınarcık Basin is an asymmetric NW-SE basin bounded by two faults that intersect at depth to form a flower structure (Carton et al., 2005; Seeber et al., 2006; Kurt et al., 2013, Figure 5). Most of the vertical displacement is accommodated by the northern master fault while pure strike-slip faulting is observed at the southern edge where the active strike-slip fault is blind (Karabulut et al., 2011, Bulut et al., 2009) and the shallow deformation is distributed (Figure 5). The northern master fault (Figure 5, Kurt et al., 2013) separates the depocenter of the basin in the hanging wall (downthrown block south of the fault) from a strip of elevated seafloor in the footwall (Seeber et al., 2006) (upthrown block, the “bench”, Figure 6A and 6B). No gas seeps are detected along the main fault scarp of the main faults, but gas seeps can be found locally within the footwall "bench" (Figure 6).
10
Subsidiary structures are well-developed within the footwall, forming an en-échelon transtensional fault system, with a N100-N130° strike dominant set of faults, and a N160° strike secondary subset of faults (Figure 6B, Figure 7D). The subsidiary fault system has formed topography within the bench and localized small-scale slope instabilities. Gas seeps are more favourably located at the intersection of the N100-130˚ set with the N160˚ subset of faults. In contrast, no active fault scarp is observed at the base of the cliff.
At the southern edge of the basin, the near-surface deformation is distributed between continuous, right-lateral strike-slip faults (N135°) and an en-échelon array of normal and strike-slip splay faults (N115°; Figure 6C and 6D). Near surface deformation is linked with a blind strike-slip fault at depth, altogether accommodating bulk transtension (Figure 6C). Gravity driven collapse in this domain may enhance deformation of the sediment (Rangin et al., 2004; Zitter et al., 2012). Gas flare echoes are localized along seafloor fault scarps and in particular, at intersections of the two sets of shallow transtensive faults (Figure 6D).
The Tekirdağ Basin is formed along a large fault bend of the MMF near the western entrance of the Sea of Marmara (Figure 1A). Most strike slip is accommodated by the E-W fault that bounds the southern margin of the basin. Extension is broadly distributed among cross basin faults (oriented N90°-N120° Figure 5A and Figure 8A). This fault system intersects with a N40° system following the western edge of the basin. This fault system along the western edge of the basin is dextral transpressive near its connection with the MMF but deformation decreases north-eastward (from AUV dive sites 13 to 14, Figure 8), and becomes transtensive. Subsidiary structures tend to be localized around the intersections between cross basin faults and the faults along the western edge of the basin. On the basin side, small, active cross basin faults are observed in sediment sounder profiles (e.g. Tary et al., 2011) and, on the slope side, they can be inferred from geomorphology. This is particularly the case around the fault intersection that also marks the transition between transpressive and transtensive domains (Figure 8A, Bend 1). At this location, subsidiary structures determine a large collapsing concave amphitheatre-shape zone (Co on Figure 8B) and gullies that strike obliquely with respect to the maximum slope trend (Figure 8B). Two of these structurally controlled gullies (mGu and sGu for main and southern gullies, on Figure 8), with N135° and N110° trends respectively, have high backscatter due to recent rock
11
avalanches, covered by at most a few centimeters of sediment (sGu is seen on Figure 4). The N135° trend is dominantly observed at the fault bend. The main gully (mGu) is a 200-500 m wide, 300 m depth and bounded by 2 subsidiary N135° faults (Figure 8B). Curved mass wasting head scarps are observed at the top of the gully. N110° striking structures within the gully are inferred to be normal faults or joints based on the visual observation of tension gashes with the same orientation (Figure 12A and Figure 13, T2). Based on these observations we infer that the N135˚ gullies formed along left-lateral transtensional fault zones (R' shears) that include N110° extensional joints or faults (T shears according to Riedel's classification; Figure 3).
About 5 km north of bend 1 (Figure 5 and Figure 8A), in the zone covered by AUV Dive 14, cross basin minor faults (oriented N110°, Figure 5B and Figure 8A) once again intersect the base of the slope (bend 2) and can be traced on the basin side on chirp profiles (Figure 7A). Occurrence of micro-seismicity and a focal mechanism (Tary et al., 2011) suggests these faults are also active landward of the slope. Enhanced backscatter along the base of the slope south of Lat. 40°52.7' N (shown in orange on Figure 8C) indicate erosion. This is the only indication in favour of the possible activity of a blind fault following the base of the slope. This zone of higher backscatter is interrupted north of Lat. 40°52.7' N, at the intersection with a N110° fault. Likely, the edge of the basin is not an active fault scarp north of this intersection. Gas echoes are observed nearly continuously along the basin margin from the southern fault intersection (Bend 1) towards the northern part of the basin, regardless of the northward morphotectonic change observed along the basin edge. In contrast, almost no gas seep is observed along the transpressive basin margin south of bend 1 (Figure 5B and 8).
In the Marmara Basin, gas seeps are observed along most basin edges, even where the basin edge is not defined by an active fault, but are not randomly distributed along those margins (Dupré et al., 2015). They are preferentially gathered at morphological features such as within fallen blocks at the base of the talus, at the outlet of gullies, and along small failure scars. These morphological features are often localized by subsidiary structures (secondary structures associated with the activity of a main fault) and fault intersections.
12
At the western fault segment on the Western High (Figure 1 and 9), various subsidiary structures following Riedel-type geometry define as a ~1-2 km wide shear zone, well-developed on either side of the main fault (Figure 9). The faulting style is dominantly transtensive, but varies along the strike to a neutral or transpressive regime. Tranpression is expressed by folding, either as N45° trending folds or as pressure ridges running parallel to the main fault. These are for instance observed in the eastern part of the western AUV box (Figure 9C). Most small faults observed in the AUV boxes are interpreted as normal faults or as R Reidel shears. N110 Reidel shears are notably observed in a 3 km long and <1 km wide small pull apart basin in the western part of the western AUV box (Figure 9C). These R shears steeply dip and extend at depth beyond the range of the high resolution seismic image (profile 2, see Figure 10). Deep penetration multichannel seismics and relocated seismicity suggest these are related to a small releasing step-over on the main fault (Geli et al., 2018). On the other hand, small 0.5-1 km long normal faults are often layer confined. N110 to N135 faults south of the MMF and north of the pressure ridge have moderate dips (<45°) and are regularly spaced, bounding tilted blocks (profile 1, see Figure 10). Their geometry is evocative of slope creep on a detachment (Grall et al., 2013; Shillington et al., 2012). Gas vents are more abundant within the shear zone and are often associated with subsidiary structures such as transtensive fault sets and the N45° and E-W folds. One particularly active example comprises two small mounds with high acoustic backscatter, 6-8 m high, and separated by a N135° fault (Figure 14). Both mounds have an irregular shape due to collapsing of their flanks (Figure 15). Observations on these mounds are presented in more details in the next section (6.2. Gas seep morphology and characteristics).
The seafloor morphology at the Central High is dominated by sedimentary processes and the surface expression of faulting suggests that the deformation at the seafloor appears less focused than on the Western High (Figure 1 and Figure 11). The fault system splays into several fault segments and deformation is distributed among them. N110° splay faults from the main fault (MF on Figure 11) are observed at the western flank of the topographic highs. Right lateral slip along these transpressive faults is inferred from the bathymetry as sediment waves on the slopes are offset by N110° faults. Fault scarps are absent on the top of the high, and the main fault scarp that bounds the high to the north is discontinuous along the high (Figure 11). Gas vents are not clustered along the active fault scarps but
13
instead at the summit of the topographic high, where no fault scarp could be mapped. Some vents are also found on the flanks of the topographic high (Figure 11). There is a prominent 150 m diameter, pseudo-circular and high backscatter pockmark imaged on the western flank of the high (Figure 11C). Small, circular, high backscatter troughs, with diameters of ~50 m are also found aligned within erosive gullies and we interpret them as fossil or active pockmarks (Jobe et al., 2011), or as indicative of retrogressive sliding within the gully.
6.2. Gas seep morphology and characteristics:
Most gas seeps in the Marmara Basin are grey and black reduced sediment patches, elongated along preferential directions (Figure 12 and Figure 13). The only exception may be at the Central High where a limited number of circular patches were observed at the summit of the High and along the southern scarp of the fault labelled mf on Figure 11C. In most cases, patches appear elongated along the strike of subsidiary transtensive and transpressive structures, as well as along some fractures at the base of the cliffs at basin margins (Tekirdağ and Çinarcik Basins, Figure 12). Gas patches are generally tens of meters in length but, in some cases, they coalesce to form a large patch hundreds of meters long. For instance, a nearly continuous swath of 50 to 150 meters length occurs at the southern edge of the Çinarcik Basin (Figure 12B, Figure 13, CS1) along the N115° fault trace but also locally along the maximum slope gradient direction (N70°), indicating both tectonic and topographic controls on fluid emissions. In this area, gas seeps cluster in a small (~500 m2) region near an extensional step-over defined by N115° strike-slip faults and N135° normal/transtensive faults, indicating that the fault intersections provide a preferential pathway for gas migration (Figure 6D). Similarly, at the western edge of the Tekirdağ Basin, gas seeps are clustered at the intersection of two sets of faults (Figure 8B). Gas seeps observed at this location during a Nautile dive were remarkably well aligned, over a long distance (> 500 m) with the main set of N100-N120° transtensive faults (Figure 10). Gas seeps at basin margin are also commonly located on tectonically controlled landslide scars (Figure 10). Gas seeps are also encountered on talus slopes at the base of cliffs of Cenozoic and Paleozoic sedimentary rocks, near the western edge of the Tekirdağ basin and the northern edge of the Çinarcik basin (Figure 10). Scree at the base of these cliffs may provide long-lived high permeability conduits for fluid expulsion from the adjacent basin (Zitter et al., 2012).
14
Microbial white to yellow blankets are commonly observed on the patches of reduced sediments, for instance at the northern edge of Çinarcik Basin (Figure 12). Black reduced patches are also locally associated with methane derived carbonate concretions near basin margins (such as at the southern edge of Çinarcik Basin) or at topographic highs (Cremiere et al., 2012). On the NE edge of Tekirdağ Basin, four active methane bubblers (Boris’ Bubblers, Burnard et al., 2012; Figure 12 and 13) are located at the outlet of a gully (Figure 8 and Figure 12A, labelled G) and aligned along N110° tension gashes (Figure 12). As noted earlier, gas expelled from these bubblers carries a mantle He component, involving a deep-rooted fluid system (Burnard et al., 2012). Fluids derived from the adjacent Plio-Quaternary basin only represent part of the fluids expelled along the NE edge of Tekirdağ Basin (Ruffine et al., 2018), indicating that migration pathways must extend in the underlying sedimentary formations and crust. This is not the only case in the Sea of Marmara where gas seepage appears to be controlled by fracture networks in sediments pre-dating the formation of the Marmara. For example, in the Çinarcik Basin (Figure 12), gas seeps at the base of the cliff are preferentially elongated along the main fracture set (N80° and N110° strikes) observed in Paleozoic sediments (Henry et al., 2007; Zitter et al., 2012, Figure 12 and Figure 13).
Morphological Source Range of Morphotectonic Characters of hydrocarbon size contexts Gas bubbler Mantle 1-10m In fallen blocks
+thermogenic and microbial methane Tekirdağ Basin
Elongated grey along subsidiary structures
and black patches Microbial at basin edges 10-300m /fault intersection/
with or without bacterial mat scree debris at most basin edges
Circular patches Mixed: microbial 10-50m Summit of the
carbonate crusts and thermogenic Central High
Large Pockmark Unknown 50-150m Sediment waves/gullies
Central High
Small Pockmark Unknown 10-50m Western High fault zone
Tekirdağ Basin edge along canyons at Central High
Chemoherms/ Mainly thermogenic 1- 2 km Fault zone/aligned along
Buried mud volcano + microbial compressional subsidiary structures
15
At the Western High fault zone, the two carbonate encrusted mounds that actively vent gas were explored during 4 Nautile dives (Figure 13). Gas seep exploration in this area has shown that active seeps occur almost everywhere on these mounds, but features associated with gas vents change according to their position on the mounds (Figure 13 and 14). The collapsed flanks are covered by black patches that are locally associated with bacterial material and authigenic carbonate chimneys, and also with white material enriched in barite (Tryon et al., 2010, 2012; Figure 14 and Figure 15). The tops of the mounds are covered by a thick authigenic carbonate crust forming chemoherm structures (Tryon et al., 2010, 2012, Figure 15). This suggests long-lasting gas venting, such as might be expected from a hydrate ridge (Germain et al., 2013; Teichert et al., 2005). Cores collected at the mounds contain gas hydrate (Bourry et al., 2009; Ruffine et al., 2010; Tryon et al., 2010), sediments soaked in hydrocarbons and rich in authigenic carbonates (Crémière et al., 2012) with a strong smell of H2S. A high resolution 3D seismic survey (Thomas et al., 2012, Grall et
al., 2013, Grall et al., 2014) shows that the built-up gas vents are on top of sub-seabed lozenge shaped features, with internal incoherent structures (Figure 16). We interpret these features as buried mud volcanoes (Figure 16). The buried mud volcanoes root into a large ridge-shaped incoherent domain lying in the core of a N40° trending anticline (Figure 16). Fluid focusing (gas but also water) along the anticline has probably promoted mud mobilization and episodes of mud eruption. The feeder conduits are currently channeling fluids (brine, gas and liquid hydrocarbon) resulting in gas hydrate accumulation, and authigenic carbonate crust formation near the seafloor, but there is no evidence of recent mud eruptions.
7.
DISCUSSION7.1. Evidence of permeability enhancing at fault zones:
Gas vents commonly cluster along the subsidiary structures within fault zones, around fault intersections or bends and on top of anticlines, while relatively little gas venting is observed along the main fault traces. This can be explained if the permeability of sediments is increased by fracturing and shearing along the subsidiary structures, while slip on a planar fault could be associated with less off-plane strain and therefore fewer conduits for gas migration. These observations are well in line with the concept of fault core/fault damage zone, that oppose a low permeability fault core and a high permeability damage
16
zone that is characterized by pervasive subsidiary faults and fractures (Aydin, 1978; Caine et al., 1996; Chester et al., 1986; Cowie and Scholz, 1992; Evans 1990; Kim et al., 2004; Scholz, 1987; Sibson, 1977; Wibberley and Shimamoto; 2003, Faulkner et al., 2003; Faulkner et al., 2010). The permeability in the core of the fault zone is significantly decreased, as indicated by outcrop (Caine et al., 1996) and drilling observations (Lockner et al., 2011) and can be attributed to clay shearing, in particular in sediments that are naturally undergoing consolidation as a consequence of burial (Tanikawa et al., 2012). We suggest that clay shearing associated with fault damaging may increase permeability and aid gas migration also in subsurface marine sediments. Due to capillary effects, a gas phase, much like gas hydrate, will tend to segregate within the first hundred meters of unconsolidated sediment and migrate through fractures rather than through the porous network (Henry et al., 1999, 2002). The migration thus depends on the occurrence of brittle deformation and subsidiary structures in fault zones.
Sets of normal and transtensive faults at basin margins commonly form diffuse deformation zones that are linked to active blind strike slip faults (Sengor et al., 2014). Such sets of transtensive faults are observed at the southern margin of Çinarcik Basin and Kumburgaz basin (Dupré et al., 2015) and according to our interpretation, also at the north-western margin of Tekirdağ Basin. Detailed imagery and gas seep observations from this study indicate that gas venting occurs mostly near fault intersections. Riedel shears and their intersections with the main fault segment are likely favourable gas conduits. This may be due to the decrease in n at these intersections, compared to the n along pure strike slip
faults.
The main fault zone is generally associated with a ~1-2 km wide swath where seafloor deformation is expressed as folds, and small faults interpreted as Riedel shear planes defining a shear zone. Three families of faults are best documented in the 3D HR volume covering part of the Western High: sub-vertical transtensive faults (R, figure 3); regularly spaced arrays of syn-sedimentary normal faults; and gravity-driven fault systems associated with tilted blocks rooting into a detachment layer at shallow depth (Figure 10, Grall et al., 2013). Subsidiary faults observed at the seafloor are confined to the sedimentary section that is at least 4-5 km thick on the Western High (Bayrakci et al., 2013; Geli et al., 2018). They form systems that can be viewed as flower structures and are possibly connected to a
17
narrower damage zone at depth (Géli et al., 2018; Henry et al., this issue). The width of the shear zone at the surface, in this latter case, will depend of the depth in which the subsidiary shear planes splay from the main fault zone and on their dip. Permeability enhancement through the development of subsidiary structures at a shallow depth is a pattern that is observed along most fault segments surveyed, suggesting that most of the fault zones are able to vent gas. A few exceptions include the central segment of the MMF at the Central High. This may relate to differences in the mechanical behaviour of the fault zone and in its past seismic activity (Henry et al., this issue).
7.2. Regional pattern of gas migration in the Marmara Basin
In some cases, gas seeps are absent along faults that display structural damage which may be explained by the regional pattern of gas migration. At both local and regional scales, gas seep distributions at basin margins share similarities. They are mainly located near the base of the talus, but also at the outlet of gullies, and locally along small failure scars. Geomorphostructural interpretations suggest a close relationship between morphological features and the tectonic activity of subsidiary structures. It also suggests that intersections of subsidiary fault systems host gas seeps. Despite this correlation, the density of gas seeps does not seem to reflect the intensity of near surface tectonic activity at basin margins. Indeed, gas seeps are also absent along active faults in some places (Figure 5, Dupré et al., 2015). This is for instance the case for the fault that bounds the northern margin of the depocenter, in the Central Basin (Figure 5A, indicated by arrow). A similar relationship was observed along the western edge of Tekirdağ Basin.
Lateral updip migration of the gas along sedimentary discontinuities towards basin edges may explain why seeps at some active faults are totally absent and why gas seeps are also observed at unfaulted basin edges. When gas migrates updip along a surface dipping basinward, such as sediment layers, it would follow the higher slope of this surface, where the hydrostatic gradient is higher. Thus, gas should migrate away from the basin depocenters (Figure 1). In the Central basin (Figure 5A), we noted that the fault that bounds the northern margin of the depocenter does not vent gas. Normal slip along this fault has been higher than along other faults in the basin for 200-400 kyr (Grall et al., 2012),
18
consequently, sediment units and onlap sequences dip toward this fault. Thus, it follows that the gas from the basin depocenter will migrate south, away from the fault, updip along sediment discontinuities and will never encounter the northern basinet-bounding fault (Figure 17). In the Tekirdağ and the Çinarcik basins, the density of gas seeps is higher on the basin margin opposite the basin-bounding master fault (Figure 5). For example, at the western edge of Tekirdağ Basin and at the southern edge of Çinarcik Basin, lateral updip migration along sedimentary layers is moving gas away from the basin-bounding master faults (Figure 17). Moreover, at the western edge of the Tekirdağ Basin, gas is venting along all of the northern section of this edge despite no clear evidence of active deformation at the surface. This suggests that gas has migrated towards the surface along stratigraphic discontinuities rather than faults. Thus, lateral updip migration from local gas sources in the deep basin depocenters towards basin edges along sedimentary discontinuities likely explains the occurrence of gas seeps of microbial source in these cases.
Syntectonic sediments of the MMF are several kilometres thick in the basins (Carton et al., 2005; Bécel et al., 2010, Grall et al., 2012, Kurt et al., 2013) and consist of alternating silty-sandy sediments and silty-clay deposits of marine and lacustrine origins (Cagatay et al., 2004, 2009; Grall et al., 2013). Sediment deposits in basins form onlap sequences related to the local sea-level history associated with glacio-eustatic cycles. Local sea-level history in the Marmara Basin consists of successions of disconnection with the global ocean and the Black Sea. Sapropelic events (Cagatay et al., 2004) occur at transition between lacustrine and marine conditions and form a good organic matter source to be degraded by microbial activity at shallow depths. Seismoturbidities, intercalated in silty clay sediments, have good reservoir properties that may allow the gas to be accumulated and driven laterally updip towards basin edges (at the interface with the draped silty units, Figure 1, Doan et al., 2016, Pettingill et al., 1998). Over the Holocene, seismoturbidites and turbidite-homogenites represent as much as 25% of the sedimentary section (Beck et al., 2007; Eris et al., 2012; Drab et al., 2015). Most sandy layers are less than 5 cm thick and laminated (McHugh et al., 2006, 2014), but thicker layers appear to cluster at the Pleistocene to Holocene lacustrine to marine transition (Eris et al., 2012; Zitter et al., 2012) and older stratigraphic boundaries (Grall et al., 2013, 2014). For example, a several meter thick Homogenite dated at 15,500±750 years exists in the Central Basin (Beck et al., 2007, Figure 7). These interfaces
19
may form stratigraphic discontinuities that may drive gas, produced locally in the basins by microbial activity at a shallow depth, towards basin edges. This interpretation is also supported by seismic amplitude analysis of sediment interfaces. Seismic reflection signatures of gas, such as local loss of reflector coherency,phase reversals, bright spots and flat spots (Taylor et al., 2000), are localized at stratigraphic boundaries (Figure 10 and Figure 15, Grall et al., 2013). Thus, we infer that gas accumulated more favourably at stratigraphic contacts. This observation is particularly clear for the Red-H1 and the Blue-H2 boundaries, where amplitudes are better resolved at shallow depths (Figure 15).
It is thus likely that gas experiences a multiphase sequence of upward migration in the Marmara Basins. Faults are major control on this migration history, in particular at shallow depths. Stratigraphic architecture of the basin (bedding tilt) is also a primary control on gas migration. Gas migrations along permeable stratigraphic discontinuities explain the regional pattern of gas focusing at basin margins and adjacent topographic highs. Evidences of gas of mixed sources also suggests that gas has experienced a multiphase migration history.
7.3. Deep sources and gas accumulation in the western part of Marmara Basin
Gas that originates from thermogenic sources is found mixed with gas of microbial sources in the western part of the Sea and at the Central High. Gas produced by secondary methanogenesis that is also found at these locations, has a variety of isotopic signatures (Ruffine et al., this issue). This suggests that the gas seeping has not followed a unique sequence of migration to the surface gas seeps, but was likely trapped and accumulated at different levels and degraded by secondary methanogenesis. The degree of mixing of gas appears higher in the western part of the Marmara basin than in the Central High. At the western part of the Marmara Basin, the total sediment thickness is >2 km compared to the eastern part of the Sea of Marmara (Bayracki et al., 2013, Figure 17). Architecture of the deeper sedimentary section in the western domain, as well as basin modelling, suggests that the sediments were deposited in a proto-Marmara Basin when the fault network had a different geometry (Grall et al., 2012) and the deformation was probably more distributed (Sengor et al., 2014). The Thrace Basin turbidite units that crop out at the Tekirdağ Basin edge (e.g. Dupré et al., 2015), and the western segment of the MMF defines part of a paleo-margin of the Thrace Basin (Sengor et al., 2014). Thrace Basin sediment defines a
20
sedimentary basement that pre-dated Anatolian fault tectonics in this area. The Eocene-Oligocene Thrace Basin sediments are possibly source rocks and reservoir units in the western part of the Marmara Basin (Hosgormez and Yalcin, 2005). This inference agrees with geochemical results which show that at least part of thermogenic gas in Marmara basin has the same source rock as the Thrace Basin offshore reservoirs (Bourry et al., 2009, Ruffine et al., this issue).
The western segment of the MMF follows the paleo-margin of the Trace Basin (Sengor et al., 2014) and likely shaped the gas migration pathways at the Western High. There is a clear contrast between the distributions of gas seeps south of the fault, compared with that north of the fault (Figure 9). This contrast suggests that little gas from the northern block of the fault is able to reach the southern block. Either all the gas leaks at the fault zone and no gas is driven further south, or the gas could not cross the fault zone. Thus, we infer that gas is trapped along the main fault, either by fault compartmentalization of reservoir units or because of core zone sediment properties that formed an impermeable barrier to gas migration (Figure 1). The geomorphostructure of the Western High is well in line with this evidence of gas accumulation. The deformation at the Western High is not purely brittle but involves some plastic deformation in soft sediment such as clay and possibly gas rich sediment (Grall et al., 2013). The development of excess pore pressure associated with gas accumulation can significantly decrease the effective stresses, increase sliding stability, and promote tectonic creep along the fault (e.g. Hubbert and Rubey, 1960; Kooi, 1986, Gamond, 1983). More recently, in-situ experiments have shown that an increase in pore - pressure can generate aseismic slip in a zone wider than the pressurized zone, under low - effective normal stresses at shallow depths (Guglielmi et al., 2015). How this process relates with crustal creep inferred from seismicity in the Western Sea of Marmara remains to be understood (Schmittbuhl et al., 2016; Bohnhoff et al., 2017). Thus, we conclude that gas is accumulating at the Western High and possibly charging reservoir units within the Western High.
7.
M
AIN CONCLUSIONS,
OPEN QUESTIONS AND PERSPECTIVESIn the Marmara basin, gas seeps are found preferentially within a narrow 1-2 km swath around active faults. Gas seeps are completely absent at basin depocenters, and are
21
observed mostly at basin edges and on topographic highs. Permeability enhancement at shallow depths through the development of subsidiary structures is inferred along most of the fault segments surveyed, suggesting that most of fault zones are able to vent gas. The only exception may be the central segment of the MMF at the Central High. Subsidiary structures include Riedel shear structures, folding and normal faulting and define a seafloor deformation zone ~2km wide that may be considered analogous to a fault damage zone. Gas vents are more widespread along these subsidiary structures than anywhere else, suggesting that they are of primary controls on the gas outflows at shallow depths. Also, gas seeps are preferentially distributed along subsidiary structures rather than on the main fault scarp, possibly reflecting the growth of a low permeability fault core as a result of shear induced dewatering. Transtensive subsidiary structures host both landslides and gas seeps and form intersecting fault sets that are preferential pathways for gas migration.
Gas expelled at the Marmara Basin has experienced multiple sequences of upward migration. We show that gas upward migration pathways are controlled by sediment discontinuities as well as fault zones. The updip migration of gas along tilted stratigraphic discontinuities can explain why gas seeps are not observed along some faults, or preferentially observed at some basin edges. We show that gas migrates updip away from some basin-bounding master faults and towards topographic highs; and thus, in these cases the faults channel little gas towards the seafloor. Our interpretation also explains why most gas seeps that have been sampled from basin margins originated from local microbial sources, likely within the basins. Gas leaks along faults at the Marmara seafloor if the faults cut the lateral updip migration pathway of gas along tilted sedimentary discontinuities near basin edges. Faults that cut gas accumulation domains (e.g. where the western segment of the MMF crosses the western high) also vent gas. Aseismic creep behaviour is suspected to occur on this fault segment (Schmittbuhl et al., 2016, Bohnhoff et al., 2017, Klein et al., 2017, Yamamoto et al., 2016) but it is unclear how the observations of intense gas emission along this fault segment may be causally related: aseismic slip can, by imposing steady-state deformation of the sediment, contribute to maintaining long-term gas permeability along subsidiary structures and, on the other hand, overpressuring resulting from gas generation and migration in the fault zone could promote aseismic creep within the ≈6 km thick sedimentary section.
22
A
CKNOWLEDGMENTWe thank IFREMER, CNRS/INSU, the European Commission in the FP6 of ESONET and FP7 of MARSITE programs and NSF (OCE program, project 15-3761) for funding. We thank Naci Görür for his constant support over the years of Turkish-French collaborative projects. We would like to thank GENAVIR, IFREMER, INSU support teams and in particular the captain and crew of R/V Le Suroît and R/V L’Atalante, as well as the scientific party of both the Marmesonet and Marnaut expeditions. We also greatly acknowledge the support of the Turkish Navy. Alain Normand and Charline Guérin are thanked for one-board processing and for spending time teaching the first author, the processing of bathymetric and backscattering data. Bruno Marsset and Yannick Thomas are thanked for the acquisition and the processing of the 3D seismic blocks, as well as Alexis Rochat, and the Seislab team; Hélène Clouet and André Ogor for their contributions on the process of water column data; Jean-Baptiste Tary, Devrim Teskan and Bernard Mercier De Lepinay for their contributions on the process of chirp data. Graham Westbrook and Hélène Ondreas are thanked for stimulating discussions. We thank two anonymous reviewers and the editors Livio Ruffine and Javier Aristegui for their comments which helped to improve this manuscript, as well as Paul Betka and Alison Chalm for their careful revisions of the manuscript.
FIGURE CAPTIONS
Figure 1: Synthesis of the gas generation, migration and trapping in sedimentary basins. Gas is generated by
thermogenic cracking and microbial degradation. The upward migration of gas is mainly driven by buoyancy through the sediment pore-fluids from its source (primary migration) or from reservoir units where gas is leaking partially (secondary migration). Gas is focused by anticline and onlap tips as a consequence of its upward migration along sediment discontinuities that act as permeable discontinuities. Gas can also be driven upward by fault zones when permeability is enhanced by damaging processes.
Figure 2: Tectonic settings and data location. A. Tectonic setting of the Eastern Mediterranean. Lines indicate
active faults and major plate boundaries. The abbreviations NAF and SoM stand for North Anatolian Fault and Sea of Marmara, respectively. B. Bathymetry, simplified tectonic sketch map of the Marmara basin (Grall et al., 2012) and location of microbathymetric data. The Main Marmara Fault (MMF) may be divided in three fault segments: the western, the eastern (Çinarcik) and the central (Istanbul) segments. Microbathymetric data have been collected at seven active gas venting sites. C. Location map of the systematic water-column and chirp sub-bottom surveys (MARMESONET cruise, Géli et al., 2009) and location map of the Nautile dives (MARNAUT cruise, Henry et al., 2007). All information about the water column survey can be found in Dupré et al., 2015.
Figure 3: Subsidiary structures and axes of deformation in a fault zone predicted by the Riedel fault system
23
zones. Examples of an E-W dextral strike-slip strain field, similar to the strain field observed in the Marmara Basin are represented. A: Pure strike-slip fault system. B: Transtensive fault system. C: Transpressive fault system. D: Synthesis of the variability of subsidiary structure orientations between transtensive and transpressive systems.
Figure 4: Examples of visual observation from Nautile submersible dive number 1644 superimposed on the
EM2000 seafloor backscatter intensity from the AUV dive 13 in the Tekirdağ Basin. Note the good correlation between the observations of actively eroding slopes where basement is outcropping and the high backscatter amplitudes. The geomorphotectonic interpretation of AUV dive 13 is presented in Figure 8.
Figure 5: Gas seeps distribution from water-column echo-sounding and active faults at the three main basins of the Marmara Basin: the Central Basin (A), the Tekirdağ Basin (B) and the Çinarcik Basin (C). Gas seeps appear focused by basin edges and gas seeps are also absent along some active faults.
Figure 6: Bathymetric and microbathymetric data, geomorphostructural interpretations and distribution of gas
seeps along the Çinarcik Basin margins. A. Zoom of the northern margin of the basin where it can be observed that gas seeps are gathered along the strip of elevated seafloor named the bench. B. High resolution bathymetric data from AUV dive 16 at the northern margin. Active faults are localized along the transtensional slope of the bench. C. Zoom of the southern margin of the basin where a distributed en-échelon fault system is observed. D. High resolution bathymetric data from AUV dive 2 at the southern margin of the basin where gas seeps appear focused by fault intersections. High resolution bathymetric data are shaded with a N315° lighting.
Figure 7: Examples of chirp sub-bottom profiles imaging the faulting and the sediment properties in subsurface.
A. SW-NE profile along the western edge of the Tekirdağ Basin crossing the microbathymetric data from AUV dive 13 and 14. Ae. fault stands for along edge fault (see Figure 8). B. NW-SE profile crossing the Tekirdağ Basin. Sediments are dipping towards the southern margin of the basin that is crossed cut by the MMF. C. Section across the Central Basin where a thick silty sandy unit, interpreted as an homogenite (Beck et al., 2005) is observed. This deposit reaches several meters and has a relatively high permeability. D. NNE-SSW profile across the Çinarcik Basin where we observed an en-échelon fault system at the southern margin and the occurrence of a main fault at the toe of the northern flank (Figure 6). Sediments are dipping to the north, toward the Master Fault.
Figure 8: Bathymetric and microbathymetric data, geomorphostructural interpretations and distribution of gas
seeps along the western margin of the Tekirdağ Basin. A. Data location, gas echoes and detailed structures of the western edge of the basin. B. High resolution bathymetry at the main fault bend, named bend 1 (AUV dive 13). The Bend 1 marks the transition between the transpressive domain (TRANSP) and the transtensive domain (TRANST) of the margin. C. High resolution bathymetry northward of the fault bend 2 (AUV dive 14). Note the contrast in morphology and faulting between B and C. High resolution bathymetric data are shaded with a N45° lighting.
Figure 9: Bathymetric and microbathymetric data, geomorphostructural interpretations and distribution of gas
seeps in the Western High. A. Geomorphostructure and gas distribution at the scale of the Western High that shows that gas is focused by the 1-2 km shear zone of the MMF and by the rims of the topographic high. B and C. Geomorphostructure and gas distribution superimposed on the microbathymetric data at the western part of the fault zone (B, dives 10, 11 and 12) and at the eastern part of the fault zone (C, dive 15). Interpreted high resolution bathymetric data are shaded with a N270° lighting.
Figure 10: Seismic amplitude anomalies associated with gas occurrence and subsidiaries structures imaged on
the 3D seismic volume at the fault zone of the Western High. A. Seismic amplitude along the Blue-H2 stratigraphic horizon on the 3D block (Grall et al., 2013). High negative anomalies are represented in red and provide evidence of gas occurrence (Thomas et al., 2012). This map shows that the gas is leaking preferentially at the apex of the topographic highs and the rim of small basins. 1, 2, 3: Seismic profiles extract from the 3D
24
seismic dataset and gas echoes superimposed on its. Line 1 represents examples of creep like shear planes. Line 2 represents Riedel shear planes. Line 3 represents the detachement shear plans that roots at shallow depths to the seismic stratigraphic boundary H4. The location of seismic sections is presented in Figure 8.
Figure 11: Bathymetric and microbathymetric data, geomorphostructural interpretations and distribution of gas
seeps in the Central High. A. Geomorphostructure and gas echoes distribution at the scale of the topographic high where it can be observed that gas is focused at the top of the topographic high. B. Geomorphostructure, gas echoes distribution and Nautile dive observations (numbers 1664 and 1651) represented on the high resolution bathymetric data (AUV dive 6, 7, 8, 9). The exact fault traces are relatively poorly defined, as the seafloor morphology is controlled by sedimentary processes and slope instabilities. C. Zoom of a large active pockmark on the western flank of the topographic high. D. Zoom of the Nautile dive observations. Interpreted high resolution bathymetric data are shaded with a N45° lighting.
Figure 12: Synthesis of the dive observations at basin edges. Gas flare echoes and Nautile dive observations are
superimposed on the geomorphostructural interpretations in the Tekirdağ Basin (A, Nautile dives 1644 and 1647), in the southern edge of the Çinarcik basin (B, Nautile dive 1659) and at the base of the cliff of the northern edge of the Çinarcik Basin (C, Nautile dive 1641 to the west and 1654 to the east). Refer to Figure 6 and 8 for the context of these zooms. The location of images presented in Figure 13 is provided.
Figure 13: Selected images from dive observations at basin edges. CN1 and CN2 are images from an elongated
gas seep within fallen blocks at the northern edge of Çinarcik Basin. CS1 is an image of large elongated black patches observed at fault intersection at the southern edge of Çinarcik Basin. T1 and T2 are images of the rock falls and the bubblers observed at Tekirdağ Basin. Bubblers are aligned along preferential directions and form metric cracks at the seafloor. Refer to the table 1 in the supplemental material that provides detailed information about the pictures. Location maps of these pictures are presented in Figure 12.
Figure 14: Synthesis of the dive observations at the Western High. A. Location map and microbathymetric data
at the chemoherm sites within the fault shear zone (see Figure 9B). B. Nautile dive observations (dive 1648 and 1666) at the chemoherm site. C. Synthesis of observations made during the Nautile dive 1649 at the eastern part of the fault shear zone. The location of images presented in Figure 15 is provided.
Figure 15: Selected images from dive observations at the fault zone at the Western High. Whc 1, 2, 3 are images
made at the chemoherm sites (Figure 14A and B). Whe1 and 2 are images collected at the eastern toe of the Western High, within the fault zone (Figure 14C). Whe1: debris of carbonate crust on the slope. Whe2: Black patches associated with bivalves. Location maps of these pictures are presented in Figure 14.
Figure 16: Architecture and seismic character of the mud volcano complex within the fault damage zone at the
Western High observed right below the chemoherms (Figure 14 and 15). A. Time slice at 0.9 s twt across the seismic cube where we can recognize the outlines of an incoherent domain, the buried mud volcanoes. B. W-E interpreted high resolution seismic section where gas echoes are superimposed. This seismic section shows a buried mud volcano with a characteristic ‘Christmas tree’ geometry and internal incoherent reflections.
Figure 17: Regional W-E (A) and N-S sections (B) across the Marmara Basin showing together the basinal
architecture and the faulting, the bathymetry and the distribution of gas seeps at the seafloor. The “pre-kinematic” basement geometry is from Bayracki et al., 2013. The sediment geometries, the stratigraphy and the faulting are from the seismic profiles and interpretations published in Grall et al., 2012, 2013; Sengor et al., 2014, Carton et al., 2007; Kurt et al., 2013, Bécel et al., 2009, Seeber et al., 2004.