DYNAMIQUE SPATIO-TEMPORELLE DES MAMMIFÈRES
HIVERNANT DANS UNE FORÊT BORÉALE DE L’EST DU
CANADA
Thèse de doctorat
TOSHINORI KAWAGUCHI
Doctorat en sciences forestières Philosophiae doctor (Ph.D.)
Québec, Canada
iii RÉSUMÉ
La sélection de l'habitat par les espèces animales est rarement abordée par des études à long terme. Basé sur 11 années de pistage sur la neige, j’ai examiné 1) s’il est possible d’élaborer un indice de population fiable avec des dénombrements de pistes comparés à des ventes de peaux de mustélidés, l'écureuil roux et la marte, 2) si la sélection de l'habitat du lièvre est influencée par la densité de l’espèce, 3) si la profondeur de la neige exerce une influence sur l'utilisation de l’habitat du lièvre, 4) et si l’association spatiale entre la martre et le lièvre est réduite lorsque l’abondance de prédateurs concurrents, le lynx du Canada et le renard roux, augmente.
Chaque année, 91,3 km ± 28,9 km (moyenne ± SD) de transects ont été parcourus. Pour le premier objectif, des modèles linéaires généralisés du nombre de pistes de chaque espèce ont été développés, en fonction de l'effet de l'année (variable catégorique) et des descripteurs de la végétation. Les estimations des effets de l'année étaient étroitement associées avec les ventes des peaux d'écureuil roux et de belettes. Le nombre moyen de pistes par effort d’échantillonnage étaient associés avec les ventes de peaux de martre. La fréquentation de jeunes peuplements (20-40 ans) était influencée par l’indice de population de lièvres durant l'année précédente. À l’intérieur d’un hiver, le lièvre était davantage associé à feuillage au-dessus de 2 m (données LiDAR) à mesure que la neige devenait plus profonde. Finalement, la relation de causalité entre le lièvre, la martre, l'écureuil roux, le renard roux et le lynx a été déterminée par l'analyse de piste (path analysis). L’association spatiale entre les lièvres et la martre diminuait lorsque l’abondance de lynx dans l'année précédente était élevée.
Cette étude démontre l’importance de la prise en compte de la dynamique écosystémique à long terme tel que le climat et la dynamique de la population, et de l’espèce focale, lors de l’étude de la sélection de l’habitat. Elle incite à la prudence dans les projections à long terme basées sur des approches simples telles que les indices de qualité des habitats. Dans un contexte d’aménagement forestier, il est probable que les changements à court terme et à long terme dans la végétation et l’enneigement, suite aux pratiques forestières et aux changements climatiques, auront des effets complexes sur la répartition spatiale des mammifères hivernants.
v ABSTRACT
Habitat selection by animals has rarely been the focus of long term studies. Based on 11 years study of snow tracking, I investigated whether 1) population indices derived from snow tracking agreed with pelt sales in marten, red squirrel and weasels, 2) habitat selection by snowshoe hare is influenced by conspecific density, 3) snow depth influenced habitat use pattern of snowshoe hare, 4) spatial association between marten and hare is reduced when other hare predators, lynx and fox, are more abundant.
Each year, 91.3km ± 28.9 km (mean ± SD) of transects were surveyed. For the first objective, generalized linear models were used for track count of each species as function of year effect (categorical variable) and vegetation variables. Estimates of year effects agreed strongly with pelt sales of red squirrel and weasels. Mean track counts by sampling effort agreed with marten pelt sales. Hare track counts in young (20-40y) forest stands declined with an increase of conspecific density with one year lag. Hare track counts were increasingly associated to stands with high foliage density above 2m (measured with LiDAR), as snow became deeper in the course of winter. Finally, path analyses of the causal relationship between spatial distributions of hare, marten, red squirrel, red fox and Canada lynx suggested that the hare-marten spatial association declined when lynx abundance in the previous year was high.
This thesis underlines the importance of accounting for long term ecosystem dynamics such as population and climate, including those of the focal species, in the study of habitat selection. It raises questions about the validity of long-term projections based on simple approaches such as habitat suitability indices. In a forest management context, short- and long-term changes in the vegetation and snow cover, following forest management and climate change, will have complex effect on wintering mammal spatial distribution.
vii TABLE OF CONTENTS
RÉSUMÉ ... iii
ABSTRACT ... v
TABLE OF CONTENTS ... vii
LIST OF TABLES ... xi
LIST OF FIGURES ... xiii
ACKNOWLEDGMENTS ... xvii
AVANT-PROPOS ... xix
GENERAL INTRODUCTION ... 1
Ecosystem management and limits of short term studies ... 2
Habitat selection ... 3
Interspecific interactions and habitat selection ... 4
Winter and seasonal aspects of habitat selection ... 5
Objectives ... 7
STUDY SITE ... 9
Climate condition ... 9
Plant species composition ... 9
Mammal species composition ... 9
Natural disturbance ... 10 Ecosystem management ... 10 GENERAL METHODS ... 19 Strengths ... 19 Weaknesses ... 20 Sampling design ... 20 Survey conditions ... 21
Statistical procedures for adjusting potential bias in track counts ... 21
CHAPTER 1 - SNOW TRACKING AND TRAPPING HARVEST AS RELIABLE SOURCES FOR INFERRING ABUNDANCE: A 9-YEAR COMPARISON ... 27
Abstract ... 28 Introduction ... 29 Field-Site Description ... 32 Methods ... 33 Results ... 37 Discussion ... 38 Acknowledgments ... 40
CHAPTER 2 – INFLUENCES OF CURRENT AND RECENT CONSPECIFIC DENSITY ON HABITAT SELECTION OF SNOWSHOE HARE ... 49
viii Introduction ... 51 Methods ... 52 Results ... 55 Discussion ... 56 Acknowledgements ... 58
CHAPTER 3 – VARIATION OF SNOW DEPTH AFFECTS THE SPATIAL DISTRIBUTION OF SNOWSHOE HARE ... 63
Abstract ... 64
Introduction ... 65
Methods ... 66
Study site ... 66
Assessing snowshoe hare spatial distribution ... 67
Understory cover, stand height and foliage density ... 67
Statistical analysis ... 69
Results ... 70
Discussion ... 70
Acknowledgements ... 72
CHAPTER 4 – WINTER SPATIOTEMPORAL DYNAMICS OF A BOREAL PREDATOR-PREY COMPLEX ... 81 Abstract ... 82 Introduction ... 84 Methods ... 87 Study area ... 87 Snow tracking ... 87
Estimation of population indices ... 88
Exploratory path analysis ... 89
Dynamics of spatial association ... 90
Results ... 90
Discussion ... 92
Acknowledgements ... 94
Appendix ... 103
Appendix 1. The best causal graphs for each year during study period, 2004-2014. 103 Appendix 2. Result of d-separation test representing all d-separation claims and its probability of independence. ... 107
Appendix 3. Estimated path coefficients of edges in the best graphs for each year. . 112
GENERAL CONCLUSION ... 117
The challenge for developping a reliable population index ... 117
ix
Snow depth influenced habitat use of hare ... 118
Interactions in spatial distribution among mammals ... 119
Caveats ... 120
Management implications ... 121
Long term studies and snow tracking ... 122
xi LIST OF TABLES
GENERAL METHODS
Table Method 1. Sampling effort for snow tracking at the Montmorency Forest, southern Quebec, Canada, 2004-2014. ... 25 CHAPTER 1
Table 1. 1. Sampling effort for snow tracking and track counts for American Marten, American Red Squirrel, and weasels at the Montmorency Forest, southern Quebec, Canada, 2004-2012. ... 46 Table 1. 2. Pearson correlations between pelt sales, and different population indices that were
based on snow-tracking over the three species (n = 9): a) American Marten, b) American Red Squirrel, and c) weasels, in southern Quebec, Canada, 2004-2012. Year effect GLM indicates estimates of year effect from a Generalized Linear Model. ... 47 CHAPTER 2
Table 2.1. Sampling effort for snow-tracking of snowshoe hare (Lepus americanus) in the Montmorency Forest, southern Quebec (Canada), 2004-2014. ... 59 Table 2.2. Estimated effects of current and lag density (previous winter) on habitat selection
of snowshoe hares in the Montmorency Forest, Québec, 2004-2014 (n = 10). Estimates are shown for models including either current or lagged effects of density. Positive estimates indicate a greater association at higher density. Adjusted R2 values can be
negative, because unlike raw R2, they are penalized by the number of parameters. .... 60
CHAPTER 3
Table 3. 1. Sampling effort for snow-tracking for snowshoe hare (Lepus americanus) at the Montmorency Forest in southern Quebec, Canada, 2012 -2014. ... 77 Table 3. 2. List of models for testing hypothesis regarding effect of interaction between
LiDAR derived tree height, penetration rate, regenerating forest and snow depth on track counts of hare. X indicates a corresponding variable included into the model. ... 78 Table 3. 3. Model comparison among candidate models for habitat use by snowshoe hare in
the Montmorency Forest, Quebec, 2012-2014. The variable YEAR was treated as a categorical variable. The w indicates Akaike weight. ... 79 Table 3. 4. Estimated effects of snow depth on habitat use by snowshoe hare in the
Montmorency Forest, Quebec, 2012-2014: a) hare response mean LiDAR penetration rate (n = 336) and b) hare response to proportion of understory cover (n = 180) under different snow depth. ... 80 CHAPTER 4
Table 4. 1. Sampling effort for snow tracking and track counts for snowshoe hare (Lepus americanus), American marten (Martes americana), red squirrel (Tamiasciurus
xii
hudsonicus), and Canadian lynx (Lynx canadensis) and red fox (Vulpes vulpes) at the Montmorency Forest, southern Quebec, Canada, 2004-2014. ... 100 Table 4. 2. Model fit for dynamics of edges in spatial distribution between Hare and Marten
in the Montmorency Forest, Québec, 2004-2014. Candidate models include variables: Hare-marten path coefficients (Hare-Marten), hare-marten path coefficients in the previous year (Hare-Martent-1), marten population index (Marten population), hare-fox
path coefficients (Hare-Fox), and hare-lynx path coefficient (Hare-Lynx). ... 101 Table 4. 3. Model fit for dynamics of edges in spatial distribution between marten and squirrel
in the Montmorency Forest, Québec, 2004-2014. Candidate models include variables: Hare-lynx path coefficients (Hare-Lynx), hare population index (Hare population), hare-fox path coefficients (Hare-Fox). ... 102 Table 4. 4. Result of d-separation test representing all d-separation claims and its probability
of independence. ... 107 Table 4. 5. Estimated path coefficients of edges in the best graphs for each year. ... 112
xiii LIST OF FIGURES
STUDY SITE
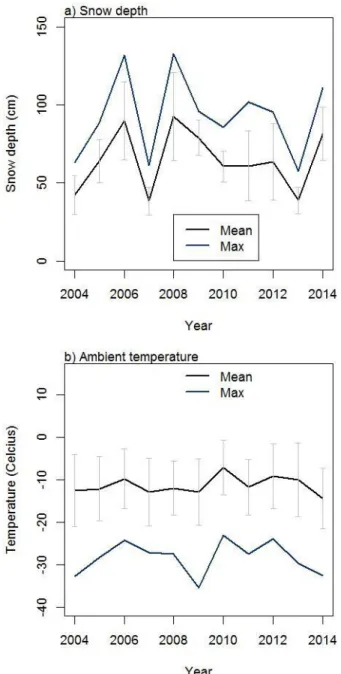
Figure Site 1. Inter-annual dyhnamics in weather condition in winter (January to March), 2004-2014: a) Snow depth and b) Temperature. Black line indicates mean value. Blue line indicates either seasonal maximum or minimum value depending on variable of interst. Grey error bar indicates standard deviation. ... 12 Figure Site 2. Vegetation maps of the study site. The map was created based on vegetation
map in March 2014. ... 13 Figure Site 3. Distribution of clear-cut performed during the study period, 2004-2014.
Different colors are corresponding to year of clear-cut performed. ... 14 Figure Site 4. Inter-annual variations in proportion of area of each habitat types in Foret
Montmorecy, southern Quebec, 2004-2014. ... 15 GENERAL METHOD
Figure Method 1. Spatial distribution of transects in Forêt Montmorency. ... 23 Figure Method 2. Schematic representation of an off-road snow-tracking transects. ... 24 Photo 1. Effect of snow depth on understory cover represented by photographie. The photo represents that small tree was buried by deep snow. ... 16 Photo 2. Graphical representation of four types of winter habitats in the study site, the
Montmorency Forest, Québec: Regenerating forest (top left), young forest (top right), mature forest (bottom left), old forest (bottom right). ... 17 CHAPTER 1
Figure 1.1. Graphical representation of spatial location of snow tracking site (the Montmorency Forest) and trapping area of Furbearer Management Unit (UGAF) 39, southern Quebec, Canada, 2004 - 2012. Black area indicates the location of snow tracking sites. Gray area indicates the location of trapping area. ... 41 Figure 1. 2. Inter-annual dynamics of winter precipitation and winter temperature in the study
sites, the Montmorency Forest and the Laurentides Wildlife Reserves (UGAF 39), southern Quebec, Canada, 2004-2012: a) Winter temperature (oC), b) winter
precipitation (mm). The data for 2006 was not available. ... 42 Figure 1. 3. Spatial distribution of sampling transects in the Montmorency Forest, southern
Quebec, Canada, 2004-2012. Black lines indicate off-trail transects and gray lines indicate either roads or trails. ... 43 Figure 1. 4. Comparison of population trends between snow tracking and pelt sales across
three taxa: a) American Marten, b) American Red Squirrel and c) weasels, southern Quebec, Canada, 2004-2012. Two population indices are presented: left) Year effect of a Generalized Linear Model (Year effect GLM), right) tracks/exposure time. Black lines represent pelt sales and gray lines represent population indices of year effect GLM (right) or tracks/exposure time (left). Vertical bars represent standard errors. ... 44
xiv
CHAPTER 2
Figure 2. 1 Estimated population index of snowshoe hare over 11 years from 2004 to 2014 in the study site. The index was developed from coefficients of the year effect estimated from generalized estimating equations (GEE). Vertical bars indicate standard errors. 61 Figure 2.2. Association of hares with 0-20y forest stands explained by a) immediate effect
(Dt) only and b) with immediate and time-lag effects (Dt + Dt-1) of the density index
over 10 years (2005 - 2014) in the study site (n = 10). Points with standard error bars indicate model coefficients. Dashed lines indicate 95 % confidence bands of the fitted regression line values. ... 62 CHAPTER 3
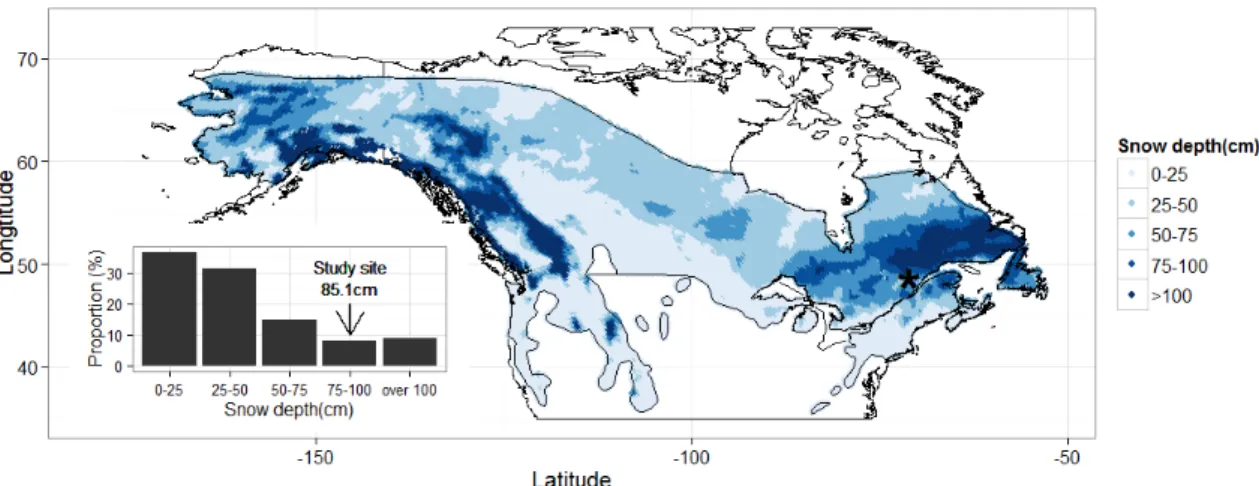
Figure 3. 1. Satellite snow depth over distribution of snowshoe hare (Lepus americanus). Satellite data was obtained from Canadian Meteorological Centre (Brown and Brasnett 2010). The date of measurement for the map was 1 March in 2012. The resolution was 24km x 24km. The location of the study site was represented by a black star. The histogram showed frequency distribution of snow depth over hare distribution. Snow depth at the study site was 85.1cm on this date. ... 74 Figure 3. 2. Vegetation map and sampling location in the study site, 2012-2014. The
vegetation map was produced by using the one in 2012, ... 75 Figure 3. 3. Effect of interaction between snow depth and vegetation structure on habitat use
by hares at the Montmorency Forest, Canada, 2012-2014: A) hare response to LiDAR penetration rate, B) hare response to mean understory cover under different snow depth. High penetration rate values indicate low foliage density above 3m from ground. ... 76 CHAPTER 4
Figure 4. 1. Population dynamics of five species over 11 years, 2004-2014: a) Snowshoe hare, b) red squirrel, c) American marten, d) Lynx and e) red fox. Gray error bars indicate standard errors. ... 96 Figure 4. 2. Summary of path analysis results linking spatial distributions of predator, prey
and vegetation attributes, 2004-2014. Thickness of line is proportional to the number of years with evidence for an edge. Red colored edges indicate positive coefficients and blue colored edges indicate negative coefficiens. Grey colored edges indicate that path coefficient were either positive or negative depending on study year. ... 97 Figure 4. 3. Dynamics of edges in spatial distributions between hare and marten, 2004 -2014
(n = 10). The graphs represent a) relationship between hare-marten spatial association in the current winter and the one in the previous winter and b) hare-marten spatial association in the current winter and lynx population index in the previous winter. Points with standard error bars indicate path coefficients. Dashed lines indicate 95 % confidence bands of the fitted regression line values. ... 98 Figure 4. 4. Dynamics of edges in spatial distributions between squirrel and marten, 2004 -2014 (n = 10): a) Relationship between squirrel-marten spatial association and hare population index, b) Relationship between squirrel-marten spatial association and hare-marten association. Points with standard error bars indicate path coefficients. Dashed lines indicate 95 % confidence bands of the fitted regression line values. ... 99
xv Figure 4. 5. The best causal graphs for each year during study period, 2004-2014. Solid line indicates significant path (p < 0.05). Dashed line indicates non-significant path (p < 0.05). Red line indicates positive effect from a variable to the other and blue lines indicate negative. ... 106
xvii ACKNOWLEDGMENTS
I am indebted to a great number of recherchers and volunteers who have helped me progress in this PhD project. Their collaboration and contribution made this thesis possible.
Financial support for this project was provided by a scholarship to T. Kawaguchi from the “Leadership and Sustainable development Scholarship Program” of Laval University as well as Foundation F.-K.-Morrow, and by a Natural Sciences and Engineering Research Council of Canada (NSERC) Discovery grant to A. Desrochers.
I thank the Ministère des Forêts, de la Faune et des Parcs for providing us with pelt sales data, trapping effort data and geographical information for chapter 1. Especially, I appreciate H. Bastien for providing me useful comments and advice for the manuscript in chapter 1.
We are grateful to the 29 skilled field workers who contributed to the collection of snow tracking data. Among 29 skilled workers, I would like to thank especially M. Lapointe for her great contribution to data collection under harsh winter environment. I also thank C. Villeneuve for teaching me how to drive a snowmobile safely and for his great contribution to data collection.
I appreciate my collegues for providing me useful comments on my project and for having discussions on ecological and statistical issues. I thank J. Marchal for providing me useful advice on R programming. I have frequently discussed statistical issues with him during lunch time. The discussion made me think the issues further and deeper. And I thank J. Faure Lacroix for helping me improve my french writing and pronouciation in french presentation in Colloque 3 and other opportunities. F. Fabianek introduced me to boreal forest in the Montmorency Forest in 10 days of his field work. The field work was useful for me to
xviii
capture characteristics of boreal forest and to develop the initial idea of my thesis. I thank S. Beaudoin for her assistance in correcting in my French during PhD program. I thank C. Roy, S. Renard and N. S. Baker for their comments on the earlier version of this thesis.
I appreciate D. Fortin, L. Bélanger and C. Samson for their assistance in the design of the study and W.F.J. Parsons in Centre d’Ètude de Forêt (CEF) for his assistance in linguistic corrections. My special thanks was given to C. Samson for his contribution to this thesis from the beginning to the end. His comments and questions often led me to think further and deeper. I also appreciate I. D. Thompson and M. Mazerolle, members of jury for my defense, for providing me with thoughtful feedbacks on the thesis.
Lastly, I would like to give my gratitude to my director, André Desrochers, for having provided me with useful advice and comments on this thesis for this 4 years. He had been working on data collection and initiation of snow tracking project from 2000 before I started the PhD program. Again, I apprecite his great amount of contribution to the project.
xix AVANT-PROPOS
Cette thèse de doctorat inclut quatre chapitres. Je suis l’auteur principal de tous les chapitres, aussi que l’introduction générale et la conclusion générale. Toutes les analyses statistiques ont été éffectués par moi. Mon directeur de recherche, André Desrochers, a largement contribué à l’élaboration de cette thèse. De plus, Héloïse Bastien (Ministère des Forêts, de la Faune et des Parcs, en cours) est coauteur du premier chapitre.
1 GENERAL INTRODUCTION
Ecological long term studies are often essential to detect and understand ecological processes and patterns including population dynamics and spatial distribution of animal species (Lindenmayer et al. 2012). Ecological patterns requiring longitudinal studies typically include, but are not limited to, responses to climate change (Brown and Braaten 1998) and population dynamics (Fryxell et al. 1999). In the Canadian boreal forest, fur returns were instrumental in revealing the 10-year population cycle in several mammals including snowshoe hare (Lepus americanus) and lynx (Lynx canadensis) (Elton and Nicholson 1942). A classical long term study in Yukon showed that population dynamics of snowshoe hare are driven primarily by a predator, the Canada lynx (Krebs et al. 2001a). In the case of habitat preference of snowshoe hare, monitoring habitat preferences for eight years let researchers realize that at low population densities, hares used mature pine forest less frequently than dense immature pine forest. However, at peak density, they used mature pine forest as frequently as immature pine forest (Mowat 2003). Long term work in Finland empirically demonstrated mesopredator release in a hare-fox-lynx relationship, in which the top predator (lynx, Lynx lynx) suppressed abundance of mesopredator (red fox, Vulpes vulpes), indirectly leading to prey population increase (hare, Lepus timidus) (Elmhagen et al. 2010).
An additional reason for the need to conduct longitudinal ecological studies is the presence of time lags in processes such as species redistribution following landscape changes (Metzger et al. 2009), local extinction after deforestation (Brooks et al. 1999), species invasion (Crooks 2005), and population dynamics (Fryxell et al. 1991, Erb et al. 2001). Time lags can be caused by long processing times following the perception of a stimulus (Brooks et al. 1999), intervening processes between two processes of interest (Magnuson 1990), or
2
feedbacks (Framstad et al. 1997). Thus, accounting for recent ecological states is often required to understand what causes current ecological phenomena.
Ecosystem management and limits of short term studies
In the boreal forest, forestry practices under the context of ecosystem management (defined in Gauthier et al. 2008) attempt to emulate habitat and landscape pattern produced by natural disturbances (Long 2009) and attempts to manage forest within natural range of variability (Keane et al. 2009). On the other hand, the Convention on Biological Diversity (CBD) mentioned that at least 17 per cent of terrestrial are expected to be conserved by 2020 as well as prevention of species extiction. Under this context, a large number of studies have investigated wildlife-habitat relationships to conserve a focal species via protecting their preferred habitat and to establish a management ‘baseline’. Habitat relationship studies in this context typically 1) evaluate effect of forestry practices on animal distribution (e.g., Ferron et al. 1998, de Bellefeuille et al. 2001, St-Laurent et al. 2008), 2) examine if forestry practices emulate dynamics of habitat use along a stand age gradient observed in natural disturbance (e.g., Allard-Duchêne et al. 2014) and 3) describe habitat use patterns along stand age gradient under natural disturbance (e.g., Hodson et al. 2011). Most of these studies substitute space for time, i.e. use a cross-sectional approach, to infer long-term relationships. The results derived from these studies have been, and remain, important to establish a basic understanding of habitat use, an end-result of habitat selection, and patterns of population dynamics. However, since wildlife-habitat relationships have been shown to vary with wildlife population density fluctuating over time (examples above), thus the studies might potentially introduce confounding effects due to conditions prevailing at the time of those studies.
3 Habitat selection
Habitat selection is a decision-making process whereby individuals preferentially use, or occupy, a non-random set of available habitat (Morris 2003), which ecologists postulate as a tool to maximize fitness. The process is influenced by various factors including conspecific density (Fretwell and Lucas 1970), weather (Reid et al. 2012), interference or exploitation competition (Morris et al. 2000) and predation risk (Hildén 1965, Laundré et al. 2010, Thomson et al. 2006).
Under the assumption of ideal free distribution (Fretwell and Lucas 1970), animals move freely among habitats of different quality, in accordance to what is expected to maximize their fitness. Fitness per capita declines with increase of conspecific density due to intraspecific competition. According to the isodar model (Morris 2003), individuals use the best habitat at low density. However, as density increases, individuals are exposed to intensive intraspecific competition. As a consequence, fitness in the best habitat can decrease to the point where fitness in an alternative habitat is equal or higher to that in the best habitat. Eventually, this leads individuals to move from high-density (best) to lower-density (alternative) habitat. The effect of conspecific population density on habitat selection has been documented for various taxa, including mammals (e.g., fat sand rat Psammomys obesus, Shenbrot 2004; white-footed mouse Peromyscus maniculatus, Morris 1996) and birds (e.g., brown-headed cowbird Molothrus ater, Jensen and Cully 2005) taxa (Dreisig 1995, Haché et al. 2012).
To this date, effects of density on wildlife-habitat relationships have been investigated in cross-sectional approaches (Morris 2003, Hodson et al. 2010). However, given the facts that population dynamics of animals synchronized over space (Liebhold et al. 2004), variation
4
captured in cross-sectional approach might not be as large as the one captured in longtitudinal studies, potentially leading to poor performance of space-for-time substitution.
In addition, time lags are generally expected, and sometimes observed in species redistribution due to lagged perception of stimuli or long processing time (Brooks et al. 1999). Since habitat selection involves responses to stimuli, the effect of density on habitat selection could be lagged. Despite their likely occurrence, time lag effects of density on habitat selection per se have not been investigated.
Interspecific interactions and habitat selection
Habitat selection by preys and predators each can be influenced by interspecific interactions modulated by prey abundance, predation risk, and intra-guild competition (Lima 2002, Gorini et al. 2012). Predation risk often leads prey to maintain anti-predator responses to prior presence of predators, for example moose (Alces alces) – grey wolf (Canis lupus) (Latombe et al. 2014), elk (Cervus canadensis)-wolf (Fortin et al. 2005).
In a prey-predator interaction, habitat selection by predators often translates into occupying areas with high prey abundance, as has been shown in the lynx - snowshoe hare case (Keim et al. 2011).
When several prey species are available, the strength of the spatial association between a predator and a given prey species can decrease when the abundance of alternative prey species increases (prey switching; Murdoch et al. 1975). Prey switching is exemplified with wolves that concentrate on areas used by deer (Odocoileus virginianus) during winter, but switch to beavers (Castor canadensis) during summer, when the latter become available (Latham et al. 2013).
5 Habitat selection can be influenced by competition for shared resources by other species (Morris et al. 2000, Morris 2003). For example, population density of collared lemmings (Dicrostonyx groenlandicus) in their preferred habitat can decline with increase in density of competitor, brown lemmings (Lemmus trimucronatus), in the same habitat (Morris et al. 2000). Competition among predators having dietary overlap often results in spatial segregation among species as shown in the marten (Martes americana) – fisher (Pekania pennant, formerly Martes pennanti) relationship (Fisher et al. 2013).
North American boreal forests typically host a multi-species predator-prey system including snowshoe hare, American marten, red squirrel (Tamiasciurus hudsonicus), lynx and red fox. To exemplify how the complexity of this system influnece habitat selection of a species, we consider marten. Marten has been long thought to be an old-growth specialist species (Buskirk and Powell 1994) but now known to use a wider range of habitats including young and mature forest (Potvin et al. 2000). A deeper understanding of marten habitat selection can be attributed to the spatial distribution of their prey, snowshoe hare and red squirrel (Powell et al. 2003). Since those prey species have been confirmed to appear in mature forest (40yr-) (Hodson 2011, Allard-Duchêne et al. 2014), association between mature or old forest and marten could be due to association between habitat and those prey. Still, as observed in a case of prey switching and competition, the strength of the spatial association between marten and its prey itself could be subject to change due to abundance of alternative prey and competitors.
Winter and seasonal aspects of habitat selection
The boreal forest is characterized by its harsh winter environment with extreme low temperatures and deep snow cover (Brandt et al. 2013). Of course, the main challenges
6
encountered in winter by animals are lower food availability and high homeostasis demands. But recent climate change (Pauli et al. 2013) may add to the existing challenges, for example, by creating a mismatch between molt to white pelage by hares and the timing of snowfall (Mills et al. 2013). Lower snow accumulation may also reduce survival of small mammals such as voles which are dependent on subnivean space (Pauli et al. 2013). However, winter is also challenging for field work, and therefore a relatively small number of studies have been conducted during this season (Campbell et al. 2005).
Spatial distribution in summer might be different from the one in winter because availability of required resource might be subject to vary due to weather, especially in landscapes where snow depth regularly exceeds 1 m. Variable snow accumulation affects accessibility to resources including food and thermal cover for both herbivore and carnivore (Halpin and Bissonette 1988, Morrison et al. 2003). When small trees are covered by deep snow, availability of understory cover may decline to the point where food (White et al. 2009) and anti-predator cover (Litvaitis et al. 1985) become sparse enough to elicit changes in habitat selection.
As described above, habitat selection can be considered as a complex process involving multiple stimuli and potentially including lags in response to stimuli, all with potential consequences on the spatio-temporal dynamics of mammals. For example, snowshoe hare – habitat relationship is known to vary with conspecific density, but this reponse could be lagged. In addition, preferred habitat of hare might vary with climate, particulary snow depth. Given an association between prey and predators, spatial dynamics of prey would greatly influence the dynamics of predator. Long term studies, enabling to capture large varitation
7 and allowing the investigation of lagged responses, would contribute to address those uncertainty prevailing in species-habitat relationship studies.
Objectives
The general objective of my thesis is to gain a better understanding of spatio-temporal dynamics of wintering mammals in an eastern Canadian boreal forest under varying abundance, trophic and competitive interactions with accounting for potential lagged response to these factors, based on a 11 years of snow-tracking. My thesis contains four specific objectives, each corresponding to a chapter.
The first thesis objective (Chapter 1) was to design and evaluate different population indices developed from snow tracking data by comparing with pelt sales data for three mammal species: American marten, red squirrel and weasels. If the two indices describe population changes accurately over time, I predict that they will be highly correlated, after accounting for sources of error described above.
My second objective (chapter 2) was to investigate influences of current and recent conspecific density on habitat selection of snowshoe hare. In this chapter, I predicted that at high population densities, snowshoe hare distribution expands into less preferred habitat, thus weakening the association between hares and most preferred habitat. I predicted that the the shift in distribution would be stronger in the winter following high density rather than in the current winter, i.e. will be lagged.
My third objective (Chapter 3) was to examine whether variation of snow depth affects the spatio-temporal distribution of snowshoe hare. I predicted that with increasing snow depth, snowshoe hares will less frequently use sites dominated by saplings and lower trees.
8
My fourth objective (Chapter 4) was to explore the spatio-temporal dynamics of five mammal species: snowshoe hare – red squirrel – marten – lynx – red fox, in a temporally-changing habitat. I tested whether the strength of the marten-hare spatial association is affected by presence of lynx and fox, competitors, and abundance of alternative prey, red squirrel.
9 STUDY SITE
Geographical location and topography
Snow tracking was performed in the Forêt Montmorency, about 80 km north of Quebec City (47° 20’N, 71° 10’W). The area of this study site is 66 km2. Altitude ranges from 650 m to
1000 m and maximum degree of slope was 40o.
Climate condition
From 1999 to 2011, annual mean temperature was 0.3 °C. Annual precipitation was 1417 mm (33 % as snow). Maximum snow depth at weather station in the Montmorency Forest ranged from 62 to 146 cm in 2004-2014 (Figure Site 1a). Mean daily temperature ranged from -15
oC to -9 oC (Figure Site 1b). Snow accumulation in this site was high enough to bury small
trees (Photograph 2).
Plant species composition
Balsam fir (Abies balsamea) dominates second-growth mature forest stands. Black spruce (Picea mariana), white or paper birch (Betula papyrifera), trembling aspen (Populus tremuloides), and white spruce (P. glauca) are also common. Recent (less than 5-yr-old) clear-cuts are generally colonized by red raspberry (Rubus idaeus), balsam fir, and white birch (de Bellefeuille et al. 2001). Dominance of balsam fir was confirmed by the prism survey conducted in 2012, which showed that 77% of trees captured in the survey was balsam fir and only 9% of tree was white birch.
Mammal species composition
A lot of mammal species are commonly observed in the study site: snowshoe hare, American marten, American red squirrel, Canadian lynx, red fox, grey wolf, weasels (mostly
10
Mustela erminea based on known species distribution), moose, beaver, river otter, and porcupine (Bouliane et al. 2015). Mountain lion was rarely observed. There was no sighting of coyote (Canis latrans) and bob cat (Lynx rufus). Small mammlas such as meadow vole (Microtus pennsylvanicus) and southern red-backed vole (Clethrionomys gapperi) are also present.
Natural disturbance
Outbreak of spruce budwarm and windthrow were main natural disturbance in the site, which were driving sources of developing mosaic forest.
Ecosystem management
The principal strategy to protect biodiversity is to “manage natural mosaic forest within variabily of natural primitive forest” (Bélanger 2001). Specifically, the management goal is to be achieved through three practices: 1) employ practices maintaining natural regeneration process, 2) emulate natural disturbances to conserve mosaic forest, 3) developping modality to conserve ecological value.
The main forestry practice in this area is clearcut with protection of soils and regeneration (CPRS; Bélanger et al. 1991), resulting in an ever changing landscape (Figure 1 and Figure2). A dense road is present, with ca. 150 km of roads, i.e. over 2 km/km2. The forest has been
managed to perserve 20% of regenerating forest (1-20yr) and 20 % of youg forest (20-to-40yr) and 20% of mature forest (40-80yr), 20 % of older forest with irregular management (e.g., all types of partial cutting) in a landscape at a scale of 10km2. In addition, in a
management unit of 10-15km2, similar proportion of different size of harvest patches
11 management, the landscape in this study site was mosaic forest and contained a large amount of small patches. During the study period, average of actual proportion of each of habitat type were 26.4 ± 3.5 % (mean ± standard deviation), 23.8 ± 2.9 %, and 49.7 % ± 1.1 for regenerating forest, young forest and mature forest respectively. Targeted proportion of each plant species (balsam fir, white spruce, black spruce, white birch) are 60, 14, 3, 10-to-25 % separately.
In addition, the study area is also managed for other uses such as recreational and research activity. During winter, some of roads and trails has been used for cross-country ski and snowshoe hiking in the study years.
12
Figure Site 1. Inter-annual dyhnamics in weather condition in winter (January to March), 2004-2014: a) Snow depth and b) Temperature. Black line indicates mean value. Blue line indicates either seasonal maximum or minimum value depending on variable of interst. Grey error bar indicates standard deviation.
13 Figure Site 2. Vegetation maps of the study site. The map was created based on vegetation map in March 2014.
14
Figure Site 3. Distribution of clear-cut performed during the study period, 2004-2014. Different colors are corresponding to year of clear-cut performed.
15 Figure Site 4. Inter-annual variations in proportion of area of each habitat types in Foret Montmorecy, southern Quebec, 2004-2014.
16
Photo 1. Effect of snow depth on understory cover represented by photographie. The photo represents that small tree was buried by deep snow.
17 Photo 2. Graphical representation of four types of winter habitats in the study site, the Montmorency Forest, Québec: Regenerating forest (top left), young forest (top right), mature forest (bottom left), old forest (bottom right).
19 GENERAL METHODS
(While the following chapters provide description about the field method, this section provides more detatiled descriptions on the field work used in the entire thesis.)
Most of this thesis was based on snow tracking, a method commonly used in northern countries (e.g., Canada: Silva et al. 2009; Finland: Sulkava 2007; Norway: Pedersen et al. 2010). Snow tracking can be achieved in two ways, 1) searching for tracks (used here), and 2) tracking at bait stations (not used here) (Halfpenny, 1995).
Snow tracking is non-invasive and is used to monitor changes in relative population size (Raphael 1994) as well as to determine habitat selection for many mammalian species. Population trend derived from snow tracking surevey was corresponding to the one from mark-repcature method. Snow tracking has been used to conduct reliable field surveys of American marten, fisher, lynx and wolverine (Halfpenny 1995). Snow tracking and the classic pellet count technique can show similar patterns in habitat use for the snowshoe hare (Litvaitis et al. 1985).
Strengths
Snow tracking is often easy to implement, less expensive in comparison with other techniques such as live trapping. In addition, this technique has no bias associated with bait. Compared to other non invasive methods (e.g., camera trap), snow tracking can survey extensive areas, which is potentially important in detecting rare animals and also in investigating animals with large home range size (> 50 ha). For several mammalian species active in winter, snow tracking has higher detection probability (Gompper et al. 2006). Given larger variation in seasonal snow depth (approximately 50cm to 150cm) as observed in the study area (Montmorency Forest), snow tracking would provide more stable detection rate
20
comparing with camera traps which are installed at a fixed height and are potentially buried in deep snow.
Weaknesses
The main weakness of snow tracking is that it does not provide a direct estimate of number of animals, given the lack of individual identification. Furthermore, the detection and count of animal tracks is easily affected by weather such as strong wind, snow fall, and snow quality (Gompper 2006). Snow tracking is more labor-intensive than camera traps, which may explain why several government agencies that used to employ snow tracking as monitoring method now use camera traps (Claude Samson, pers. comm.). Despite these caveats, snow tracking offers a high potential for long-term, extensive studies, because of its simplicity and relatively low cost.
Sampling design
Snow-tracking has been conducted at Forêt Montmorency each winter (date range: 20 December – 15 April) since March 2000, initially using a haphazard selection of transects (2000-2003), followed by a more systematic design (2004-present), consisting of 67 sample units placed on a 1-km square grid (Figure Method 1). Each grid point was numbered and sorted randomly at the beginning of a field season to determine the temporal sampling order within the season. In order to cover larger area and visit a site regulaly, off-road transects sampled in the previous 2 years were removed from the pool of points available for sampling. Off-road transects were 2 km long, except for truncated transects occurring near the border of the study area (Figure Method 2). Additionally, some off-road transects were erased from the sampling area because observers cannot access them securely. Road and trail transects covers 150 km of roads and 40 km of trails. However, the actual length of transect sampled
21 depended on snow condition, weather, time of day, and personnel available (Table Method 1). Each year, snow tracking surveys are conducted from late December to late March.
Survey conditions
Snow quality and climate can affect the detection rate of animal tracks. Thus, we conduct snow tracking when no strong wind (faster than 20m/s) and no snow fall has occurred in approximately the last 24 h before field work. Each transect is surveyed only once each winter. At the start of each transect, observers entered snow conditions on a GPS and start looking for tracks by snowshoe, skis, by foot or by snowmobile at speed slower than 20 km/h. When a track is detected, observers obtained its coordinate with a GPS and measured stride length, width as well as footprint width and depth to help identify the species in case of doubt. All six species studied here leave tracks that are usually easy to detect and identify, and track misidentification is assumed to be negligible.
Personnel who participated in snow tracking included experienced field workers and volunteers. To avoid variation in quality and capacity of observers in detection and identifying tracks, two days of field training was required for inexperienced participants, and volunteers were required to measure and photograph tracks of equivocal origin. Thus, this entire thesis assumed that the quality and capacity of observers were not different among years and within years. Number of observators per a sampling event ranged from one to two in most sampling events, depending on difficulty of terrain (for security) and experience.
Statistical procedures for adjusting potential bias in track counts
Since snow tracking was performed on both trail and off-trail transects, surveying on trails and roads might detect more tracks than on off-trail transect for certain species. For
22
example, red fox and wolf have been confirmed to use road as movement corridors (Coffin 2007). In addition, road has no canopy cover and lateral cover. For mammal species which require these vegetation cover, road might not be used as much as off-trail transect, resulting in lower track detection rate on road. Exposure time and temperature are often factors affecting detection rate of tracks (Roy et al. 2010, Bois et al. 2012).
The following chapters integrated these factors into statistical models as fixed effects to account for these biases in track presence or counts. While N-mixture models are often used to account for detection probability (MacKenzie et al. 2002), this thesis did not use them because the aim of this thesis did not require to estimate true occupancy but simply assess whether and how track count and environmental conditions, including other wildlife, covaried while accounting for possible bias.
23 Figure Method 1. Spatial distribution of transects in Forêt Montmorency.
24
25 Table Method 1. Sampling effort for snow tracking at the Montmorency Forest, southern Quebec, Canada, 2004-2014.
Year
Road and trail Off-trail
Length (km) Number of observers Sampling events (days) Length (km) Number of observers Sampling events (days) 2004 109.5 4 11 44.4 4 30 2005 110.9 6 18 20.2 2 13 2006 187.5 3 21 47.5 3 21 2007 125.6 3 14 30.8 3 14 2008 146.7 5 17 47.3 4 19 2009 162.8 4 19 26.4 3 13 2010 151.4 10 13 29.6 5 10 2011 143.8 4 10 24.7 2 9 2012 135.9 2 13 69 6 21 2013 124.4 5 9 27.3 2 11 2014 124.6 5 12 22.9 2 9 Total 1523.1 51 157 390.2 36 170 Mean 138.5 4.6 14.3 35.5 3.3 15.5 SD 23.3 2.1 3.9 14.9 1.3 6.6
27
CHAPTER 1 - SNOW TRACKING AND TRAPPING HARVEST AS
RELIABLE SOURCES FOR INFERRING ABUNDANCE: A 9-YEAR
COMPARISON
Toshinori Kawaguchi1,*, André Desrochers1 and Héloïse Bastien2
1Centre d’Étude de la Forêt, Université Laval, 2405, rue de la Terrasse, Québec (Québec),
G1V 0A6, Canada. 2Direction de la Gestion de la Faune de la Capitale-Nationale et de la
Chaudière-Appalaches, Ministère des Forêts, de la Faune et des Parcs, 1300, rue du Blizzard, local 100, Québec (Québec) G2K 0G9, Canada.
This chapter was accepted by the journal Northeastern Naturalist on 3 November 2015. Therefore, the format in this chapter was adjusted to the guidline of the journal.
28 Abstract
Trapping harvest and snow tracking are frequently used to infer population dynamics, yet there have been few evaluations of those indices. We developed population indices for Martes americana Turton (American Marten), Mustela spp. (Weasels) and Tamiasciurus hudsonicus Erxleben (American Red Squirrel) from 9 years of snow tracking data in Eastern Canada. Population indices were mean track counts per unit effort and derived from a Generalized Linear Model (GLM) of track counts as a function of year and covariates including forest age. Mean track counts had significant correlation with American Marten and Weasels pelt sales. Year effects in GLM were correlated with American Red Squirrel and Weasels pelt sales. Both methods are in agreement therefore they likely are replicating population dynamics of the selected species.
29 Introduction
Monitoring animal populations is a key to understanding the state of ecosystems, their functions and their responses to anthropogenic and natural disturbances (Lindenmayer et al. 2012). Direct estimates of population densities by live trapping or mark-recapture is very labor intensive and expensive (Gese 2001). Thus, ecologists often resort to population indices, such as those derived from snow tracking (Pellikka et al. 2005), trapping harvest (Roberts and Crimmins 2010), observation reports by hunters (Simard et al. 2012) and scat surveys (Krebs et al. 2001a, Mowat and Slough 2003).
Snow tracking is non-invasive (Halfpenny et al. 1995) and is frequently used to estimate relative abundance of wintering mammals in North America (Mowat and Slough 2003) and Europe (Pellikka et al. 2005). Assuming that the number of tracks is proportional to population size, some studies use tracking counts per unit effort to infer relative abundances of mammals such as Lepus americanus Erxleben (Snowshoe Hare), Tamiasciurus hudsonicus Erxleben (American Red Squirrel) (Jensen et al. 2012), Martes americana Turton (American Marten) (Krebs 2011), and Mustela frenata Lichtenstein (Long-tailed Weasel) (Fitzgerald 1977). Snow tracking is ease of use (Halfpenny et al. 1995) and has higher detection rates than other non-invasive techniques such as camera traps and track plates (Gompper et al. 2006). Also, snow tracking does not require the baits or attractants that are employed in other population monitoring techniques (Raphael 1994).
However, there may be significant noise and bias in population indices obtained from snow tracking data. Track counts can be affected by weather conditions such as strong winds and recent snow falls (Raphael 1994, Gompper et al. 2006), and can vary with the activity level of animals. For example, American Marten activity decreases at extremely low
30
temperatures in American Marten (Thompson and Colgan 1994) and weasels (Robitaille and Baron 1987). Presence of prey can influence track counts of the predator as shown in Lynx canadensis Kerr (Canada Lynx) (Keim et al. 2011). Observer bias and miss identification can be biases.
In many provincial and state agencies, trapping harvest in the form of total catch and catch per unit effort is commonly used to infer relative population sizes and trends of fur-bearing species (Douglas and Strickland 1987), particularly American Marten and Pekania pennanti (formaly Martes pennanti ) Erxleben (Fisher) (Jensen et al. 2012). In the United States, harvest surveys are frequently used to monitor Lynx rufus Schreber (Bobcat) population status (Roberts and Crimmins 2010). In Quebec, Canada, the number of pelts that are sold is the main and sometimes the only index of population size, in the case of Weasels composed mostly (probably more than 95% based on known species distribution) of Mustela erminea Linnaeus (Short-Tail Weasel) and Long-tailed Weasel, Mephitis mephitis Schreber (Striped Skunk), and Ondatra zibethicus Linnaeus (Muskrat). For Canada Lynx, American Marten and Fisher, abundances can be inferred from the logbooks that trappers are required to maintain. Those logbooks record the numbers of trapped animals for each species, together with trapping effort. Numbers of pelts sold can be obtained from fur transaction reports. Trapping harvest is mainly affected trapping effort (Fortin and Cantin 2004), which in turn is influenced by several ecological and socioeconomic factors, such as food abundance (Ryan et al. 2004), market prices (Weinstein 1977), government quotas (Smith et al. 1984), landscape changes (Raphael 1994) and other disturbances over time (Raphael 1994), and temperature (Kapfer and Potts 2012).
31 In addition to problems that are specific to each of these indirect methods, temporal changes in sampling locations may introduce additional bias to the index. Moreover, even if field surveys are conducted in fixed locations each year, successional patterns in vegetation will affect the response of different species to the sampled plots (Anderson 2001). As is the case with any model, those that are used to develop population indices should optimize the combination of simplicity and accuracy.
Few studies have evaluated the reliability of population indices that have been obtained through those indirect methods. In a five-year study in Ontario, Thompson and Colgan (1987) reported different population trends from trapping harvest and snow tracking. Thompson et al. (1989) again found no correlation between track counts and trapping harvest, but they did find a significant correlation between track counts and live trapping data. The authors suggested that track counts correctly described population changes over 5 years.
To evaluate population indices that were based on snow tracking and pelt sales, we examined the correlation between the two techniques with data from three mammal species: American Marten, weasels, and American Red Squirrel. While two indices were not direct measure of population size, we hypothesized that if two indices describe population changes accurately over time, they are highly correlated, after accounting for sources of error described above. We predicted that if one or both of the indices failed to describe annual population dynamics, correlation coefficient between two indices should not be different from zero for the species concerned.
32
Field-Site Description
We conducted snow tracking surveys in the Montmorency Forest, a 66 km2 area, about
80 km north of Quebec City (47° 20’N, 71° 10’W), Canada (Fig. 1. 1). Trapping and hunting for the three species were not allowed in this area. Most of the study area was originally clearcut between 1941 and 1945 and is now managed with a combination of clear-cuts and selective cuts. The resulting forest is composed of mature (more than 40-y-old), mid-succession (21- to 40-y-old) and regenerating (less than 20-y-old) forest stands, which comprise 55 %, 25 % and 20 % of the study area at the time of the study, respectively. Locations of different-aged stands shift with time due to continuing timber harvest and forest stand succession; mean stand age remained stable throughout the study period (42.97 ± 1.67 years, range 0 – 113 y). A dense road network is present, with about 150 km of dirt roads. During winter, several roads were groomed by machinery for cross-country ski trails. Elevation ranges from 650 m to 1000 m. From 1999 to 2011, annual mean temperature was 0.3 °C. Annual precipitation was 1417 mm (33 % as snow). Maximum snow depth at weather station in the Montmorency Forest ranged from 62 to 146 cm in 1999–2011 (Vigeant-Langlois and Desrochers 2011). Abies balsamea (Linnaeus) Miller (Balsam Fir) dominated second-growth mature forest stands. Picea mariana (Miller) Britton, Sterns and Poggenburg (Black Spruce), Betula papyrifera Marshall (White Birch), Populus tremuloides Michaux (Trembling Aspen), and P. glauca (Moench) Voss (White Spruce) were also common. Recent (less than 5 y) clear-cuts were generally colonized by Rubus idaeus Linnaeus (Red Raspberry), balsam fir, and white birch (de Bellefeuille et al. 2001).
We obtained pelt sales data from fur transaction reports of Furbearer Management Unit (French acronym, UGAF) 39, a 7934 km2 area (Fig. 1.1). In this area, Balsam Fir and Black
33 Spruce were dominant plant species. White Birch, Trembling Aspen, Yellow Birch and maples were also common (Dussault et al. 2006). Similar to the Montmorency Forest, timber harvest was conducted in UGAF 39, resulting in a heterogeneous stand mosaic (Dussault et al. 2006). From 2004 to 2012, mean daily winter temperature ranged from -16 to -9 oC and
total winter precipitation ranged from 165 to 265mm (Environment Canada 2014; Fig. 1. 2).
In summary, the main difference between snow tracking and trapping areas was the presence of trapping in the latter. Thus, furbearers were possibly more abundant in the snow tracking area than in the trapping area, potentially resulting in different movement patterns due to higher density. But we assumed that those two locations exhibited similar population trends. We based our assumption on the facts that two areas were geographically overlapped and had similar forest composition and forest management, in addition to the fact that wildlife populations within 100 km have been shown to vary synchronously in various taxa including mammals (Liebhold et al. 2004).
Methods Snow tracking
We conducted snow tracking each winter (20 December - 31 March) from 2004 to 2012. We counted tracks along a subset of a network including about 150 km of roads, 40 km of trails, and 60 km of off-trail straight line transects (Fig. 1.3). None of the roads that were surveyed had been snowplowed. Transect length depended upon snow condition, current weather, time of day, and personnel availability (Table 1.1). Off-trail transects were randomly selected from a systematic grid covering the entire study area at the beginning of each year. However, in the selection process, we removed transects that had been surveyed in the previous 2 years. For each year, we surveyed selected transects only once to cover larger area
34
as much as possible with a GPS. As a result, we surveyed an average of 91.3km ± 28.9 km (mean ± SD) of transects each year (Table 1.1). Our surveys on transects were performed within a 24 to 72 hours after the last snowfall exceeded 3 cm. We recorded all tracks found within 2 m of either side of the transect lines into a GPS receiver and identified the species, based on track pattern and size. Conspecific tracks that were within 3 m of a recorded track were ignored. Temperature and snow depth were measured at an Environment Canada weather station at the Montmorency Forest.
We georeferenced track and transect data with ArcGIS (Version 10.1, ESRI, 2012) and then split transects into 200 m fixed-length segments, totaling 4123 200-m segments for the entire study (Table 1.1). We counted tracks on each transect segment, and generated buffers with a radius of 100 m around each segment. We selected this fixed-length as a compromise that limits the number of zeros in the data while retaining a sufficiently large number of sampling units. Within each buffer, we calculated the mean age of forest stands (weighted by area), slope (the difference between minimum and maximum elevation), variance of age and mean elevation. Mean forest stand age was calculated as follows, with age in years and w in hectares for each forest stand in a buffer:
𝑀𝑒𝑎𝑛 𝑎𝑔𝑒 = ∑𝑘=1𝑖 𝑤1𝑎𝑔𝑒1+𝑤2𝑎𝑔𝑒2+⋯+ 𝑤𝑖𝑎𝑔𝑒𝑖
∑𝑘=1𝑖 𝑤1+ 𝑤2+⋯ + 𝑤𝑖 (1)
Since buffers occasionally included roads, rivers and lakes, we also calculated the percentage of vegetation cover inside each buffer.
Population indices from snow tracking data
We assumed that track count is a function of population size, animal activity level, exposure time of transect since the last disturbance. We developed two population indices.
35 The first was mean track count per 200-m transect segment per hours of exposure since the last snowfall. This index has the advantage of simplicity, but ratios raise statistical issues including spurious correlation (Atchley et al. 1976). Thus, we used a second index based on a generalized linear model (GLM) with a negative binomial distribution and log link by using package MASS in the R software (Venables and Ripley 2002). We used negative binomial distribution instead of Poisson due to large number of zero count. In the GLMs, track counts were function of year as a categorical variable, and combinations of the following covariates: mean stand age, variance of stand age, mean temperature since last disturbance, exposure time since last disturbance (snow or wind), slope, mean elevation, proportion of vegetated area and transect type (road or off-trail). Transect type was included into the model to account for differences in length of off-trail transect surveyed among study years. Year effect represents a population index (or ‘anomaly’) by comparing mean counts in a given year with that in the reference year (2004). Thus, year effect estimates reflected differences in mean track counts between 2004 and other years, after accounting for the effect of covariates on track counts described above. We were aware that GLMs do not account for spatial autocorrelation which likely occurred in track counts. However, average Moran’s I for American Marten, American Red Squirrel and weasels over study years were respectively 0.044 (range = 0.015-0.080), 0.062 (range = 0.007-0.119) and 0.024 (range = 0.006-0.040). These values suggest weak spatial autocorrelation in track counts after accounting for covariates. More importantly, we considered years, not transects, as sampling units for statistical inference on the comparison of time series. Thus we do not consider spatial autocorrelation an issue.
36
Pelt sales
We used pelt sales data as a proxy for trapping harvest, based on fur transaction reports, which were obtained from Quebec’s Ministère des Forêts, de la Faune et des Parcs. Pelt sales data were composed mainly of trapping harvest and of number of animals hunted. There were 112 trappers in the area who used body-gripping traps (Model 120, 160 or 220). Trapping season was from 18 October to 1 March of the following year, and there was no harvest limit for the three species that were studied. However, for American Marten, the ministry asked trappers to stop trapping American Marten when they caught more females than males late in the trapping season. We obtained data of trapping effort (number of traps x number of nights) for American Marten from trappers’ mandatory reports and daily logbooks of the government. Data for American Red Squirrel and weasels were not available. Average trapping effort for American Marten from 2004 to 2012 was 70187 [range: 52046 - 87756] traps x night. Average number of trapping logbooks submitted was 72 [range: 58 -83]. Population indices from pelt sales data
Various confounding factors such as temperature and trapping effort can influence both pelt sales and track counts. We calculated Pearson product-moment correlations (r) between raw pelt sales and four factors: trapping effort, daily mean temperature (January to March) (oC),
winter total precipitation (mm) and pelt price in the previous year adjusted for 2012 (Canadian dollars) in the UGAF 39. Only factors which had significant correlation with pelt sales were accounted in testing correlation between two indices.Testing correlation between two indices
In order to test if two indices agree, we calculated Pearson correlation between pelt sales and each of the annual snow tracking indices. If pelt sales have significant correlation with any of potential external factors such as trapping effort, winter temperature and winter
37 precipitation, we also modeled pelt sales as a function of the significant external factors and one of population index derived from snow tracking data. When estimated parameter of an annual tracking index was significantly different from zero, we deemed two indices agreed. The procedure was replicated for each of population index based on snow tracking. The entire statistical analysis was performed in the software R (R Development Core Team 2013).
Results
Annual track counts were 139 ± 83 (mean ± SD) [range: 66 - 329] for American Marten, 543 ± 723 (mean ± SD) [range: 63-2061] for American Red Squirrel, and 120 ± 174 (mean ± SD) [range: 11 - 575] for weasels. Mean annual pelt sales for American Red Squirrel, weasels, and American Marten were 184 [range: 74- 319], 361 [242 - 636], and 921 [629-1334] pelts respectively. None of the factors among trapping effort, winter temperature, winter precipitation and pelt price in the previous year were significantly correlated with pelt sales (-0.64 < r < 0.44, P > 0.05).
Mean of track counts hr-1 200 m-1 for American Red Squirrel, weasels, and American
Marten were 0.029 [0.004 –0.131], 0.006 [0.007- 0.027], and 0.008 [0.006 – 0.016] respectively. There was strong agreement between mean track counts per unit effort and pelt sales in American Marten and weasels (Fig. 1.4; Table 1.2, but the agreement was not statistically significant in the case of squirrel (Fig. 1.4; Table 1.2).
Year effect estimates counts 200 m-1 (compared with 2004) in the best generalized linear
model ranged from 1.76 to 2.34 for American Red Squirrel, 1.54 to 1.91 for weasels, and -0.61 to 0.81 for American Marten. Year effect estimates agreed strongly with pelt sales of weasels and American Red Squirrel (Fig. 1.4; Table 1.2), but the agreement was not
38
statistically significant in the case of American Marten (Table 1.2). Agreement between GLM-based snow-tracking indices and pelt sales was the highest in weasels, followed by American Red Squirrel and American Marten (Table 1.2).
Discussion
Track counts data were generally in strong agreement with pelt sales over the nine years of this study, which indicated that both methods capture a real signal in the three taxa that were studied. Our results differed from those of Thompson et al. (1989), who found no correlation between track counts and trapping harvest in Short-tailed Weasel, Vulpes vulpes Linnaeus (Red Fox), or Lynx. Agreement between track counts and pelt sales is remarkable especially because they were derived from completely different methods, from different sets of locations, with contrasting trapping effort. Thus, both data sets likely captured population phenomena occurring over the entire study area.
Nevertheless, agreement between indices may arise from common biases, such as weather and food availability effects on exploratory behavior and movements. Thus, it could be argued that the variation in the population indices had little to do with actual population size. However, there was little confounding effect of trapping effort, mean daily temperatures or precipitation (snow) on indices, because none of these factors were strongly correlated with indices. Food-related biases may have occurred, though. Jensen et al. (2011) reported that success rate of American Marten harvest was lower in mast year of Fagus grandifolia Ehrhart (American Beech) and Sorbus aucuparia Linnaeus (Mountain Ash) than in year of mast failure. When food is abundant, American Marten could be less likely to be attracted to bait associated with trapping devices, possibly leading to underestimates of the relative abundance. High food abundance might decrease track counts. High food abundance was