2D protrusion but not motility predicts growth
factor–induced cancer cell migration in 3D collagen
The MIT Faculty has made this article openly available.
Please share
how this access benefits you. Your story matters.
Citation
Meyer, A. S. et al. “2D Protrusion but Not Motility Predicts Growth
Factor-induced Cancer Cell Migration in 3D Collagen.” The Journal
of Cell Biology 197.6 (2012): 721–729. Copyright © 2012 by The
Rockefeller University Press
As Published
http://dx.doi.org/10.1083/jcb.201201003
Publisher
Rockefeller University Press, The
Version
Final published version
Citable link
http://hdl.handle.net/1721.1/71869
Terms of Use
Creative Commons Attribution-Noncommercial-Share Alike 3.0
Unported
The Rockefeller University Press $30.00
JCB:
Report
Correspondence to Douglas A. Lauffenburger: lauffen@mit.edu
Abbreviations used in this paper: DIC, differential interference contrast; EGFR, EGF receptor; ER, estrogen receptor; GAPDH, glyceraldehyde 3-phosphate dehy-drogenase; PR, progesterone receptor; RMS, root mean squared.
Introduction
In most all solid cancers, dissemination of cells and
estab-lishment of distant metastases is an essential step in disease
mortality (Lazebnik, 2010). Dissemination of carcinomas
occurs by invasion across a basement membrane layer and
migration through interstitial matrix to blood or lymph
ves-sels. Efficient migration in this context requires coordinate
regulation of cytoskeletal protrusion, adhesion, proteolysis, and
contraction (Lauffenburger and Horwitz, 1996; Friedl and Wolf,
2009), each of which is modulated by paracrine and autocrine
growth factor cues.
Cell migration has principally been studied as
transloca-tion across rigid 2D substrata. Despite the relevance of migratransloca-tion
within ECM to tumor progression (Wolf et al., 2009) and known
qualitative and quantitative differences in cell movement
be-tween 2D and 3D environments (Zaman et al., 2006; Doyle
et al., 2009; Fraley et al., 2010), analysis of cells embedded
within the ECM remains relatively uncommon because of
technical difficulty and incompatibility with most biochemical
analyses. Functional genomic screening techniques have been
used to identify regulators of cell migration in planar contexts
(Simpson et al., 2008; Lara et al., 2011), and analogous efforts
were used to identify small molecule drug targets (Yarrow
et al., 2005) or ascertain dependence on key signaling pathways
(Wolf-Yadlin et al., 2006). The physiological relevance of
results obtained from such high-throughput efforts is related
directly to the degree that cellular responses measured in 2D
systems correlate to those within ECM environments.
Deter-mining whether in fact any metrics easily obtained from 2D
assays correlate robustly with 3D migration behavior across a
broad range of treatment conditions is therefore critical.
We herein address this challenge for the important case
of breast carcinoma cell migration. Through quantitative
analy-sis of motility across multiple triple-negative (estrogen
re-ceptor [ER]/progesterone rere-ceptor [PR]/HER2 normal)
breast carcinoma cell lines moving in 3D within collagen I
matrix, we evaluate the predictive value of measurements,
such as receptor expression, and motility surrogates, such as
cell translocation in 2D. We fail to observe correlation
be-tween growth factor–induced motility responses on either stiff
or compliant ECM in a 2D context and those within 3D ECM.
G
rowth factor–induced migration is a critical step
in the dissemination and metastasis of solid
tumors. Although differences in properties
char-acterizing cell migration on two-dimensional (2D)
sub-strata versus within three-dimensional (3D) matrices
have been noted for particular growth factor stimuli, the
2D approach remains in more common use as an efficient
surrogate, especially for high-throughput experiments.
We therefore were motivated to investigate which
migra-tion properties measured in various 2D assays might be
reflective of 3D migratory behavioral responses. We used
human triple-negative breast cancer lines stimulated by a
panel of receptor tyrosine kinase ligands relevant to
mam-mary carcinoma progression. Whereas 2D migration
properties did not correlate well with 3D behavior across
multiple growth factors, we found that increased
mem-brane protrusion elicited by growth factor stimulation did
relate robustly to enhanced 3D migration properties of the
MDA-MB-231 and MDA-MB-157 lines. Interestingly, we
observed this to be a more reliable relationship than
cognate receptor expression or activation levels across
these and two additional mammary tumor lines.
2D protrusion but not motility predicts growth
factor–induced cancer cell migration in 3D collagen
Aaron S. Meyer,
1,2Shannon K. Hughes-Alford,
1,2Jennifer E. Kay,
1,2Amalchi Castillo,
1Alan Wells,
3Frank B. Gertler,
2and Douglas A. Lauffenburger
1,21Department of Biological Engineering and 2Koch Institute for Integrative Cancer Research, Massachusetts Institute of Technology, Cambridge, MA 02139 3Department of Pathology University of Pittsburgh Medical Center, Pittsburgh, PA 15261
© 2012 Meyer et al. This article is distributed under the terms of an Attribution– Noncommercial–Share Alike–No Mirror Sites license for the first six months after the pub-lication date (see http://www.rupress.org/terms). After six months it is available under a Creative Commons License (Attribution–Noncommercial–Share Alike 3.0 Unported license, as described at http://creativecommons.org/licenses/by-nc-sa/3.0/).
THE
JOURNAL
OF
CELL
BIOLOGY
on June 18, 2012
jcb.rupress.org
Downloaded from
Published June 4, 2012 http://jcb.rupress.org/content/suppl/2012/05/31/jcb.201201003.DC1.html Supplemental Material can be found at:JCB • VOLUME 197 • NUMBER 6 • 2012
722
Hutcheson et al., 2007; Pasanisi et al., 2008; McIntyre et al.,
2010; Tyan et al., 2011; Wilson et al., 2011). Semiautomatic
centroid tracking was used to extract multiple parameters
that describe the migration phenotype of each cell. Each
indi-vidual cell track provides five distinctly quantifiable
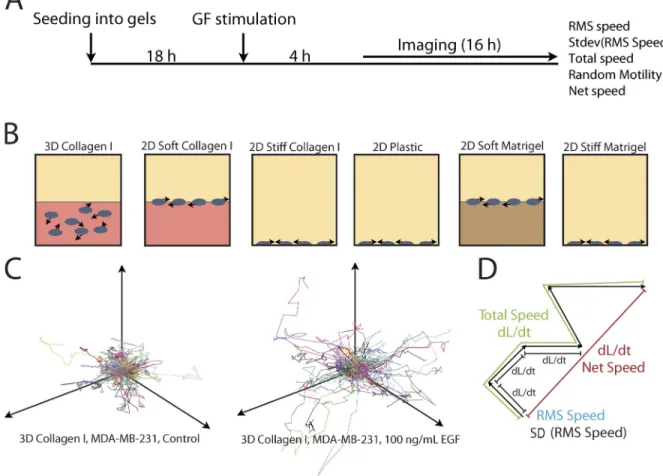
proper-ties (Fig. 1 D): (1) a root mean squared (RMS) speed of each
time interval; (2) the variance of that speed; (3) a total speed
calculated as the total path length normalized by the time of the
experiment; (4) a net speed or the net displacement normalized
by the duration of the experiment; and (5) a random motility
coefficient calculated by fitting to a random walk model (Kipper
et al., 2007). The migration parameters were independent
of position within the gel, and cells were not biased in their
direction of migration, indicating homogenous physical
charac-teristics (Kim et al., 2008) and that the growth factors had
distributed fairly uniformly throughout the gels before the
observation period. Of 10 breast carcinoma cell lines
investi-gated across clinical markers and subtypes, five were
ob-served to migrate robustly (Table S1). Vimentin expression
and subtype classification distinguished cells that did or did
not migrate in 3D.
Initial analysis of the full dataset by multidimensional
reduction techniques illustrated that speed (RMS speed and
total speed) and persistence (net speed and random motility)
broadly cluster into two groups (Fig. S1 C). This multidimensional
Although cognate receptor expression can weakly predict the
relative motility responses across cell lines, it fails to
quantita-tively predict motility enhancement caused by growth factor
stimulation. By examination of individual migration-related
biophysical processes, we identify that acute lamellipodial
pro-trusion dynamics of cells in response to growth factor cues can
predict motility within 3D ECM. These findings have broad
consequence in the assessment of motility responses in vitro,
both for high-throughput experiments and for deeper
investiga-tion of how growth factor–elicited signaling network activities
govern migration behavior.
Results and discussion
Systematic quantification of migration
To address multicomponent responses to growth factor
stimula-tion, we performed a battery of quantitative single-cell migration
assays using multiple human breast tumor cell lines and assay
geometries (see Materials and methods; Fig. 1, A and B). Cells
were fluorescently labeled to facilitate image analysis, and
their displacement was tracked via live-cell microscopy over
the course of 16 h in the presence or absence of seven growth
factor cues relevant to the tumor microenvironment (Fig. 1 C and
Fig. S1, A and B; Mograbi et al., 1997; Hankinson et al., 1998;
Dunn et al., 2004; Cheng et al., 2005, 2008; Goswami et al., 2005;
Figure 1. Schematic of the migration assays. (A) Schematic of the migration assay protocol. (B) Cells were seeded on or in matrix or on plastic for 18 h before growth factor stimulation. 4 h after growth factor stimulation, cells were imaged for 16 h. Arrows show cell movement. (C and D) Tracks of each cell were produced (C) and used to calculate five parameters summarizing the migration phenotype of each cell (D). dL/dt, change in length over time.
on June 18, 2012
jcb.rupress.org
Downloaded from
tumor subtype. Total protein expression was measured for
three different growth factor receptors, which were
impli-cated in breast cancer invasion and metastasis
Jauffret et al., 2006; Jin and Esteva, 2008; Mader et al.,
2011), in 2D for each cell line (Fig. 3 B), and every pairwise
comparison of receptor expression and motility enhancement in
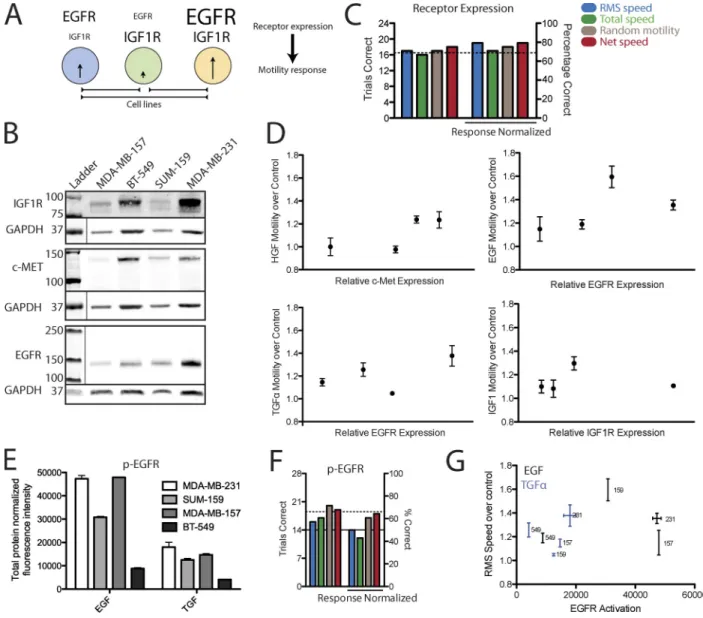
3D was performed (Fig. 3 A). With 24 comparisons (4× C(4,2)),
≥17 trials must correspond between receptor expression and
motility for this relationship to be considered significantly
predictive (P < 0.05). The analysis revealed a weak, but
sig-nificant, association for three of four motility properties,
with 15–18 correct associations (Fig. 3 C). Normalizing the
measured properties for each cell line across the range of
growth factor treatment conditions by variance, which may
potentially account for differences among cell lines in their
intrinsic motility capabilities, slightly improved the
predic-tive capacity of receptor expression to 16–20 correct
associ-ations (Fig. 3 C). As receptor activation might have improved
predictive capacity overexpression, we additionally tested
the ability of EGF receptor (EGFR) pan-pY measurements to
predict EGF and TGF- motility enhancement (Fig. 3 E).
Both stimulations may be directly compared in this case,
result-ing in 28 (C(8,2)) comparisons. Receptor activation, although
distinct from expression, was not a better predictor of motility
enhancement (Fig. 3 F).
scaling seeks to preserve distance as a description of relative
difference between each motility metric and indicates that cell
speed and persistence are distinct parameters to describe
migra-tion captured by the assay. Using unsupervised clustering
tech-niques, cell lines (Fig. 2 A) and dimensionalities or ECM in 2D
(Fig. 2 B) were found to be separable. Weaker clustering among
speed- or persistence-related motility metrics from identical
cell lines or geometries was obtained, consistent with single
cell–based clustering (Fig. S1 C). In some cases,
distinguish-able responses were observed when analyzing different
quan-tiles of the single-cell migration metrics (Fig. S1 D), resulting
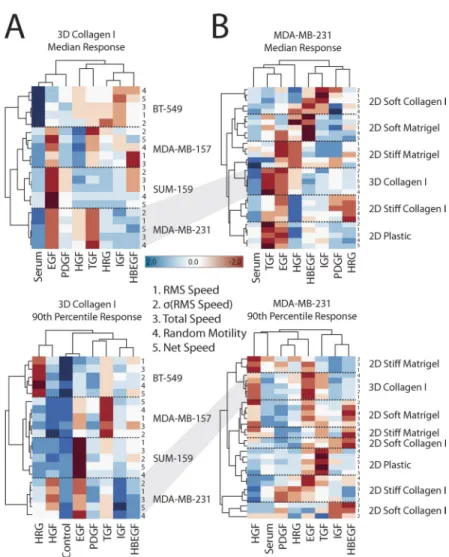
in different response profiles (Fig. 2). Analysis of “outlier” cell
populations is particularly important in invasive disease, as bulk
population responses may not reflect disease etiology (Bernards
and Weinberg, 2002; Al-Hajj et al., 2003; Cristofanilli et al.,
2004; Weigelt et al., 2005). One important advantage of our
large single-cell migration parameter dataset is the ability to
quantify differences in responses within distinct cell
subpopu-lations across assay conditions.
Prediction of motility enhancement by receptor expression
We tested the ability of growth factor receptor expression
to predict differential motility response upon stimulation, as
receptor expression is widely used to define clinical breast
Figure 2. Large-scale quantification of migration responses enables systems analysis of migration. (A and B) Shown are mean-centered motility responses across eight growth fac-tor conditions and four cell lines within collagen I gels (A) or MDA-MB-231 cells across different 2D and 3D motility assays (B; also see Fig. 1 B). Each profile and growth fac-tor is clustered by rank correlation and mean linkage. Both the median (top) and 90th quantile (bottom) responses are shown as well as each migration metric (indicated by num-bers). IGF, insulin-like growth factor 1; HRG, Heregulin 1; HBEGF, heparin-binding EGF-like growth factor; HGF, hepatocyte growth factor.
on June 18, 2012
jcb.rupress.org
Downloaded from
JCB • VOLUME 197 • NUMBER 6 • 2012
724
sufficient to identify the particular growth factor cues driving
invasion and metastasis in the context of myriad heterogeneities
among various samples.
Growth factor motility responses are distinct in 2D and 3D
Migration across a planar substratum has been the principal
means for quantitative studies of responses to compound and
genetic manipulations intended to inhibit metastasis (Simpson
et al., 2008; Lara et al., 2011). Dissimilarities in unstimulated
migration between 2D and 3D have been noted (Doyle et al.,
Receptor expression levels thus predicted growth factor–
elicited motility enhancement to a small degree that barely
reached statistical significance. Although this provides support
that receptor expression can account for some of the variation
observed among cell lines and presumably among tumors, it is
manifest that receptor expression or activation levels do not
readily explain disparities in relative or absolute growth factor–
enhanced migration responses (Fig. 3, D and G). Therefore,
although expression measurements across many samples may
indicate etiologically important changes, measurement of
receptor expression alone within tumor cells will likely not be
Figure 3. Cognate receptor measurement is weakly informative of relative growth factor motility enhancement. (A) Illustration of the pairwise comparison of receptor measurement and motility enhancement made between each cell line. (B) EGFR, IGF1R, and c-Met expression was measured across four cell lines. Lines separate loading controls from a different portion of the same membrane. Thin lines indicate portions of a membrane shown from a separate channel on the same membrane, position, and scan. (C) Every pairwise comparison of receptor expression and motility enhancement was made between cell lines for each metric of motility. Additionally, the motility enhancement for each cell line across all growth factor conditions was used to normalize for differences in the ability of each cell line to globally respond by migrating. The left and right y axes indicate the number and percentage of correct compari-sons, respectively. Significance was tested by use of the binomial distribution (dotted line, P < 0.05). Migration measurements are the mean of at least three independent experiments. (D) Plots of RMS speed enhancement upon receptor stimulation versus relative receptor expression. Error bars indicate SEM from at least three independent experiments. (E) EGFR pan-pY measurement in cells stimulated with either EGF or TGF- for 5 min. Error bars indicate the range of duplicate measurements. (F) Similar pairwise comparison analysis using measurement of p-EGFR to predict migration response. Migration measurements are the mean of at least three independent experiments. The continuous line indicates the maximum likelihood outcome of random chance. The dotted line indicates the P < 0.05 threshold. (G) Plot of RMS speed enhancement upon EGFR stimulation versus EGFR pan-pY measurement. Vertical error bars indicate SEM of at least three independent experiments; horizontal error bars indicate the range of duplicate measurements. Numbers refer to different cell lines.
on June 18, 2012
jcb.rupress.org
Downloaded from
enhancement correlates with metastatic capacity and migration
metrics in vivo in one case (Philippar et al., 2008; Roussos
et al., 2011).
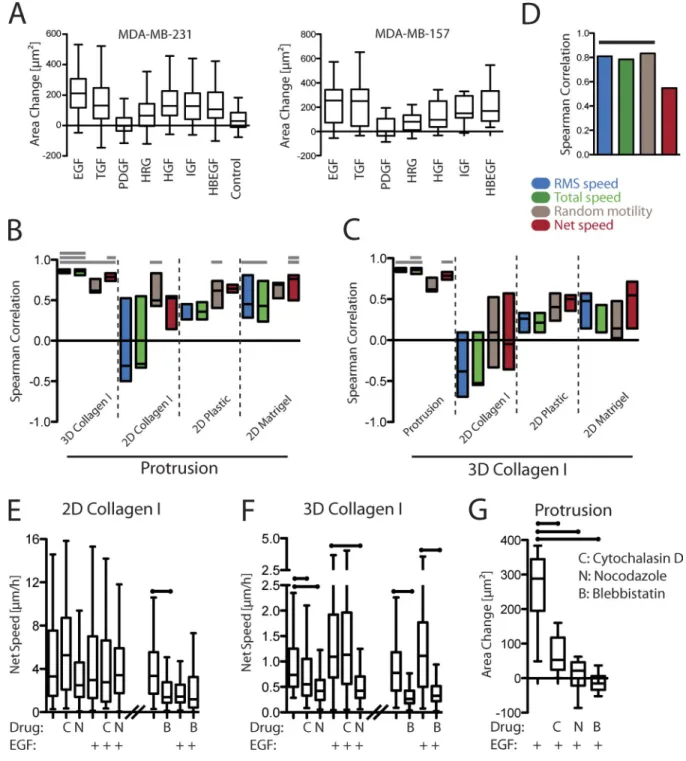
Acute changes in the area of MDA-MB-231 cells after
growth factor stimulation were quantified (Fig. 5 A). This
profile of growth factor response (the 50th, 90th, or 95th
quantile area change across growth factors) was then
com-pared with that of each motility metric in differing dimensional
contexts. We found that lamellipodial protrusion correlates
positively with 3D migration (Fig. 5 B). Upon comparison to
all 2D motility and protrusion assays, 3D migration correlated
better with the acute membrane protrusion response than with
any 2D migration measurements (Fig. 5 C). The generality
of the link between migration in 3D and early protrusion was
tested independently by measuring protrusion across all growth
factor conditions in MDA-MB-157 cells (Fig. 5 A).
Signifi-cant association between 3D migration and lamellipodial
protrusion was once again observed despite differences in the
growth factor responses between the two cell lines (Figs. 5 D
and 2 A). This test is especially stringent, as it requires similarity
across growth factors that promote different intracellular
sig-naling responses (Kim et al., 2011).
To more stringently test our observed link between initial
protrusion and eventual migration in 3D, as well as to evaluate
whether protrusion plays a specific causal role in 3D migration
or is simply an auspicious measure of signaling, we selected
three drugs that disrupt cytoskeletal elements to test whether 2D
migration or protrusion would better predict eventual 3D
migra-tion. Notably, drugs that block migration in both 2D and 3D
would not address our prediction because we sought to assess
the ability of protrusion to evaluate 3D migratory capacity
spe-cifically. Nocodazole and blebbistatin were selected for their
2009; Fraley et al., 2010). However, although migration in vivo
is driven by autocrine and paracrine growth factor cues, the
effects of growth factor stimulation have not been compared in
different dimensional contexts. It is conceivable that growth
factor motility responses may be similar in distinct dimensional
contexts if various migration-related processes (e.g., protrusion,
proteolysis, and retraction) are similarly modulated by growth
factor cues.
To study the contributions of dimensional and matrix
context on cell migration in vitro systematically, we performed
all pairwise comparisons of growth factor–enhanced cell
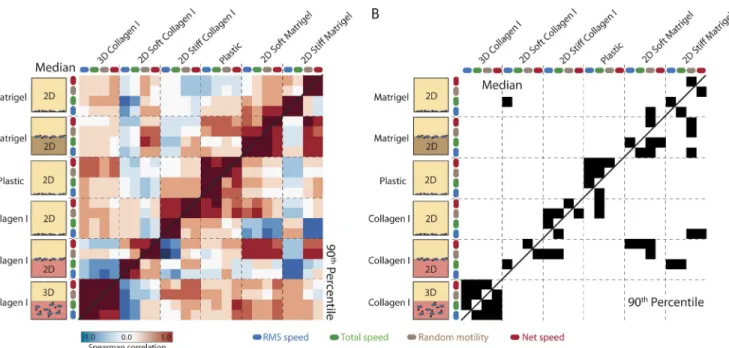
mo-tility metrics in MDA-MB-231 cells (Fig. 4 A). A stronger
cor-relation exists between different motility metrics within a single
dimensional or matrix type, reflected by analysis for significant
correlations (P < 0.05; Fig. 4 B), which only exist within, and
not across, dimensionalities.
Here, we systematically demonstrate for the first time
that growth factor–enhanced motility is distinct between
dimensional contexts. This difference holds serious
implica-tions for studies investigating migration in general and, in
particular, for analyzing intracellular signaling events that
promote migration.
Early protrusion is a better surrogate for measurement of 3D migration response
Next, we sought to identify biophysical processes that may
better reflect growth factor–enhanced 3D motility. Within
sec-onds after growth factor stimulation, cells respond through
actin polymerization and lamellipodia protrusion, which can
be measured in 2D as an area change (Mouneimne et al., 2004).
We hypothesized that initial 2D protrusion may reflect
even-tual motility enhancement in 3D, particularly as 2D protrusion
Figure 4. Motility enhancement in 2D and 3D in MDA-MB-231 is broadly distinct. (A) All Spearman pairwise correlation coefficients between each motility metric in each 2D and 3D migration assay across growth factor stimuli. The top and bottom diagonals show coefficients corresponding to the median and 90th percentile response profiles, respectively. Arrows show cell movement. (B) Significant correlations (P < 0.05) are indicated in black. Correlations are observed along the diagonal between motility metrics but not between different migration assays and 3D migration.
on June 18, 2012
jcb.rupress.org
Downloaded from
JCB • VOLUME 197 • NUMBER 6 • 2012
726
Figure 5. Protrusion correlates specifically with 3D motility enhancement. (A) MDA-MB-231 and MDA-MB-157 cells were stimulated with each growth factor condition, and the fold change in cell area was calculated by manual tracing of DIC images (MDA-MB-231, n = 60–138; MDA-MB-157, n = 15–25 from at least three independent experiments). (B) Rank correlation coefficients were calculated for MDA-MB-231 between the median, 90th percentile, and 95th percentile protrusion responses and the migration responses across different metrics of migration and assays. Each box is bounded by the highest and lowest correlation calculated, with a line indicating the median correlation calculated. Bars on the top indicate the number of quantiles for which the correlation is significant (Storey correction, q < 0.05; 0.75 false positive). (C) Similar analysis shows correlations between 3D motility and protrusion or different 2D motility assays (q < 0.05; 0.2 false positive). (D) Protrusion and 3D motility also correlate in MDA-MB-157 cells. Bar indicates correlations that are significantly nonzero (P < 0.05). (E) Net displacement of MDA-MB-231 cells treated with three cytoskeleton-related inhibitors with or without EGF stimulation on stiff collagen matrix. (F) Net displacement of cells treated similarly within 3D collagen gels. (G) Protrusion in response to EGF stimulation for cells treated with each cytoskeletal drug. For inhibitor experi-ments, a single representative experiment is shown. An independent replicate showed qualitatively identical results but was not quantified. (E–G) Bars on the top indicate significant differences with respect to the no inhibitor control (P < 0.05). (A and E–G) The lines indicate the median. The box is bound by the 25th and 75th quantiles. The whiskers extend to either the maximum and minimum values or three halves the interquartile range, depending on which is closer to the median. IGF, insulin-like growth factor 1; HRG, Heregulin 1; HBEGF, heparin-binding EGF-like growth factor; HGF, hepatocyte growth factor.
on June 18, 2012
jcb.rupress.org
Downloaded from
A detailed mechanistic picture describing the
modula-tion of multiple essential processes involved in interstitial
mi-gration remains to be constructed, with careful consideration
of intricate forms of cross talk between these processes being
an important key. Here, we have presented a systematic
decon-struction of migration behaviors across an especially invasive
and lethal subtype of breast cancer. Our findings point toward
the initial steps in actin polymerization–driven membrane
protrusion as an important regulator of invasive potential in
these cells. Our contribution offers an improved basis for
ratio-nal experimental design and pinpoints the time scale that may
be most relevant for quantification. As migration in vivo may
occur via directed paracrine cues from tumor-associated cell
populations, high-throughput analyses of migration responses
to growth factor cues are likely to reveal effective targets of
metastatic suppression.
Materials and methods
Antibody reagents, growth factors, and inhibitors
Antibodies against EGFR, IGF1R, C-Met, and glyceraldehyde 3-phosphate dehydrogenase (GAPDH) were purchased from Cell Signaling Technology. EGF, PDGF-BB, and TGF- were purchased from Invitrogen. IGF1, hepatocyte growth factor, heparin-binding EGF-like growth factor, and Heregulin 1 were purchased from PeproTech. EGF and IGF1 were used at 100 ng/ml, Heregulin 1 was used at 80 ng/ml, and all others were used at 50 ng/ml for all experiments. (S)-(-)-Blebbistatin, cytochalasin D, and nocodazole were purchased from Santa Cruz Biotechnology, Inc. and used at 50 µM, 25 nM, and 10 µM, respectively.
Cell culture
MDA-MB-231, BT-549, and MDA-MB-157 cells were cultured in high-glucose DME supplemented with 10% FBS and 1% penicillin–streptomycin. SUM-159 cells were cultured in Ham’s F12 media supplemented with 5 µg/ml insulin (Lonza), 1 µg/ml hydrocortisone (BD), 5% FBS, and 1% penicillin–streptomycin.
Migration analysis
For 3D migration assessment, cells were labeled with CMPTX (Invitrogen) for 20 min and mixed with 2.2 mg/ml pH-neutralized, acid-extracted, nonpepsin digested collagen I (BD) with DME at 500,000 cells/ml. The matrix–cell solution was placed in a glass-bottom multiwell plate (MatTek), polymerized for 30 min at 37°C, and then overlaid with full serum media overnight. Cells were stimulated 4 h before imaging on an environment-controlled microscope (TE2000; Nikon) with a camera (C4742-95-12ERG; Hamamatsu Photonics) and a Plan Apochromat 10× 0.45 NA differential interference contrast (DIC) L air objective. Image stacks of 70 3-µm slices were obtained every 60 min for 16 h using MetaMorph (Molecular De-vices). Where indicated, inhibitors were added simultaneously to stimu-lation. To avoid artifacts caused by potential gradients in stiffness near the edges of the gel, analysis fields were selected >200 µm from the glass surface.
For soft 2D migration assays, 100 µl pH-neutralized, acid-extracted 2.2 mg/ml collagen I or 100% matrigel was spread across wells of a 48-well plate and allowed to polymerize. For stiff 2D migration assays, either 100 µg/ml collagen I in 20 mM acetic acid or 0.2% matrigel in serum-free medium was used to coat uncoated glass multiwall plates for 30 min (MatTek). Cells were then labeled with CMFDA (Invitrogen) for 20 min and seeded sparsely on wells with matrix or directly on tissue-culture plastic. The next day, cells were stimulated 4 h before imaging every 10 min for 16 h. Where indicated, inhibitors were added simultaneously to stimulation.
Cells were tracked using Imaris (Bitplane). From each track, the RMS cell speed was calculated from position intervals between time points as well as the standard deviation of the mean. Total and net speeds were calcu-lated by dividing the total path length and net displacement by the duration of the experiment. Each track was then fit to a random walk model using the method of nonoverlapping intervals as previously described to calculate the random motility coefficient (Kim et al., 2008). In brief, individual cell
documented distinct effects in 2D and 3D contexts (Doyle et al.,
2009), whereas cytochalasin D was chosen for its ability at
low doses to reduce barbed-end elongation of actin filaments
(Bear et al., 2002). MDA-MB-231 cells were treated with the
three drugs with or without EGF stimulation on stiff collagen
in 2D (Figs. 5 E and S2 A) or in 3D collagen gels (Figs. 5 F
and S2 B). In parallel, initial protrusion was evaluated as before
(Fig. 5 G). Whereas 2D migration was not affected by any of
these three drug treatments under EGF stimulation conditions
(Fig. 5 E), EGF-induced 3D migration was noticeably decreased
by nocodazole and blebbistatin (Fig. 5 F). These decreases
cor-responded well to strongly diminished EGF-elicited protrusion
response for both these two drugs (Fig. 5 G). The effect of
cyto-chalasin D on EGF-elicited protrusion was milder than for
nocodazole and blebbistatin, so the lack of significant reduction
of 3D migration serves as at least an intermediate
correspon-dence for this third drug.
Our results ought not be taken to imply that modulation of
membrane protrusion dynamics be considered to necessarily be
the sole, or even predominant, governing mechanism for
motil-ity enhancement in response to growth factor stimuli. Strong
evidence exists indicating that 3D migration is concomitantly
modulated by other processes, such as traction and proteolysis.
Focal proteolysis in 3D collagen gels has been suggested to
be driven by pericellular constriction resulting from
pseudopo-dial protrusion, promoting integrin- and membrane-associated
protease clustering (Wolf et al., 2007). Whether by functional
or phenomenological means, protrusion frequency and matrix
deformation correlate significantly in 3D collagen (Fraley et al.,
2010). However, interpretation of results obtained from probing
protease function by biochemical or genetic means is
compli-cated by the effects of proteases on growth factor ligand and
receptor shedding along with their effects on matrix
degrada-tion. Thus, mechanistic relationships for convoluted effects of
protease activities between membrane protrusion and migration
will remain extremely difficult to parse until quantitative
multi-variate measurement and analysis technologies (e.g., Miller et al.,
2011) can be applied across broad treatment landscapes.
Impor-tantly, the correspondence found here between acute actin
po-lymerization responses and longer term 3D migration response
in response to growth factor stimulation offers an opportunity
for more vigorous investigation of intracellular signaling
path-ways regulating 3D migration. Biochemical analyses from or
on a plate of sparsely seeded cells with enough physical space
for robust membrane protrusion are much more tractable than
collection of cells or real-time analysis of signaling events
within cells in a 3D matrix.
As migration within 3D was only observed with cells of
one clinical subtype (ER/PR/HER2 normal), our
observa-tion of correspondence between short-term protrusion and
mi-gration in 3D remains to be tested for cells of other clinical
subtypes and lineages. However, although bulk tumors may
not be represented by the cell lines of mesenchymal phenotype,
metastasis-relevant subpopulations may show a distinct
expres-sion signature (Giampieri et al., 2009). Our results urge
consider-ation of protrusion measurement, at least over measurement of
2D motility, as an indicator of 3D migration-relevant response.
on June 18, 2012
jcb.rupress.org
Downloaded from
JCB • VOLUME 197 • NUMBER 6 • 2012
728
hypothesis correction was not performed, as type I error is not a concern. When comparing protrusion and 3D migration results, identical quantiles of single-cell data were always used.
Online supplemental material
Fig. S1 shows an example of fluorescent stacks from a 3D migration assay and preliminary analysis of the migration phenotypes. Fig. S2 shows the RMS speed measurements for the experiments shown in Fig. 5 (E and F). Table S1 shows the subtype characteristics of each cell line examined and whether it was observed to migrate in 3D. Online supplemental material is available at http://www.jcb.org/cgi/content/full/jcb.201201003/DC1. This work was supported by the National Institutes of Health (grants R01-GM081336 to D.A. Lauffenburger and A. Wells and U54-CA112967 to D.A. Lauffenburger and F.B. Gertler), the National Science Foundation (Graduate Research Fellowship to A.S. Meyer), and the Congressionally Directed Medical Research Programs Department of Defense Breast Cancer Research Program (grants W81XWH-11-1-0088 to A.S. Meyer and W81XWH-10-1-0040 to S.K. Hughes-Alford).
Submitted: 2 January 2012 Accepted: 8 May 2012
References
Al-Hajj, M., M.S. Wicha, A. Benito-Hernandez, S.J. Morrison, and M.F. Clarke. 2003. Prospective identification of tumorigenic breast cancer cells. Proc.
Natl. Acad. Sci. USA. 100:3983–3988. http://dx.doi.org/10.1073/pnas .0530291100
Bear, J.E., T.M. Svitkina, M. Krause, D.A. Schafer, J.J. Loureiro, G.A. Strasser, I.V. Maly, O.Y. Chaga, J.A. Cooper, G.G. Borisy, and F.B. Gertler. 2002. Antagonism between Ena/VASP proteins and actin filament capping regu-lates fibroblast motility. Cell. 109:509–521. http://dx.doi.org/10.1016/ S0092-8674(02)00731-6
Bernards, R., and R.A. Weinberg. 2002. A progression puzzle. Nature. 418:823. http://dx.doi.org/10.1038/418823a
Charafe-Jauffret, E., C. Ginestier, F. Monville, P. Finetti, J. Adélaïde, N. Cervera, S. Fekairi, L. Xerri, J. Jacquemier, D. Birnbaum, and F. Bertucci. 2006. Gene expression profiling of breast cell lines identi-fies potential new basal markers. Oncogene. 25:2273–2284. http://dx .doi.org/10.1038/sj.onc.1209254
Cheng, N., N.A. Bhowmick, A. Chytil, A.E. Gorksa, K.A. Brown, R. Muraoka, C.L. Arteaga, E.G. Neilson, S.W. Hayward, and H.L. Moses. 2005. Loss of TGF- type II receptor in fibroblasts promotes mam-mary carcinoma growth and invasion through upregulation of TGF--, MSP- and HGF-mediated signaling networks. Oncogene. 24:5053– 5068. http://dx.doi.org/10.1038/sj.onc.1208685
Cheng, N., A. Chytil, Y. Shyr, A. Joly, and H.L. Moses. 2008. Transforming growth factor- signaling-deficient fibroblasts enhance hepatocyte growth factor signaling in mammary carcinoma cells to promote scat-tering and invasion. Mol. Cancer Res. 6:1521–1533. http://dx.doi.org/ 10.1158/1541-7786.MCR-07-2203
Cristofanilli, M., G.T. Budd, M.J. Ellis, A. Stopeck, J. Matera, M.C. Miller, J.M. Reuben, G.V. Doyle, W.J. Allard, L.W. Terstappen, and D.F. Hayes. 2004. Circulating tumor cells, disease progression, and survival in metastatic breast cancer. N. Engl. J. Med. 351:781–791. http://dx.doi .org/10.1056/NEJMoa040766
Doyle, A.D., F.W. Wang, K. Matsumoto, and K.M. Yamada. 2009. One-dimen-sional topography underlies three-dimenOne-dimen-sional fibrillar cell migration.
J. Cell Biol. 184:481–490. http://dx.doi.org/10.1083/jcb.200810041 Dunn, M., P. Sinha, R. Campbell, E. Blackburn, N. Levinson, R. Rampaul, T.
Bates, S. Humphreys, and W.J. Gullick. 2004. Co-expression of neuregu-lins 1, 2, 3 and 4 in human breast cancer. J. Pathol. 203:672–680. http:// dx.doi.org/10.1002/path.1561
Efron, B., and G. Gong. 1983. A leisurely look at the bootstrap, the jackknife, and cross-validation. Am. Stat. 37:36–48.
Fraley, S.I., Y. Feng, R. Krishnamurthy, D.-H. Kim, A. Celedon, G.D. Longmore, and D. Wirtz. 2010. A distinctive role for focal adhesion proteins in three-dimensional cell motility. Nat. Cell Biol. 12:598–604. http://dx.doi.org/ 10.1038/ncb2062
Friedl, P., and K. Wolf. 2009. Proteolytic interstitial cell migration: a five-step process. Cancer Metastasis Rev. 28:129–135. http://dx.doi.org/10.1007/ s10555-008-9174-3
Giampieri, S., C. Manning, S. Hooper, L. Jones, C.S. Hill, and E. Sahai. 2009. Localized and reversible TGFbeta signalling switches breast cancer cells from cohesive to single cell motility. Nat. Cell Biol. 11:1287–1296. http://dx.doi.org/10.1038/ncb1973
speeds were calculated from each track using the mean of each time interval. Mean squared displacements were then calculated as the mean squared distance of all nonoverlapping intervals within a track. Using the mean squared displacement (MSD) for varying time intervals, the follow-ing equation was fit usfollow-ing least squares to yield a fit persistence:
MSD= S P t P −
(
−et P)
−
22 1 / .
From the fit, the random motility coefficient (RMC) was calculated as RMC = S2P, analogously to the diffusion coefficient (S, speed; P,
persis-tence; t, time). Protrusion assays
Glass-bottomed dishes (MatTek) were coated with 0.2% matrigel in serum-free media for 30 min. Cells were seeded sparsely overnight and then serum starved for 4 h in L15 media with 0.35% bovine serum albu-min. Inhibitors, when indicated, were added at the beginning of serum starvation. DIC images were acquired every 10 s for 1 min before stim-ulation and 9 min after stimstim-ulation. Cell areas were traced immediately before stimulation and 9 min after stimulation using ImageJ (National Institutes of Health). Single-cell information was aggregated from at least three independent experiments.
Receptor expression and activation measurement
Cells were plated sparsely on 15-cm plates overnight, washed with PBS, and lysed with 500 µl of radioimmunoprecipitation assay buffer containing protease inhibitor (Roche) and phosphatase inhibitor cocktail (Boston Bio-Products). Equal protein was loaded for SDS-PAGE analysis using a bicin-choninic acid assay and blotted using standard techniques with antibodies against GAPDH, EGFR, IGF1R, and C-Met. Densitometry was performed on an imager (Odyssey; LI-COR Biosciences) and normalized to GAPDH as a loading control.
For activation measurement, cells were seeded sparsely overnight and starved for 4 h the next day followed by stimulation with either 100 ng/ml EGF or 50 ng/ml TGF- for 5 min. Cells were lysed using lysis buffer (Bio-Rad Laboratories) containing protease inhibitor (Roche) and phosphatase inhib-itor cocktail (Boston BioProducts). EGFR pan-pY was measured using a bead-based ELISA assay (Bio-Rad Laboratories) loaded with equal protein using a bicinchoninic acid assay. Linearity of the assay with respect to pro-tein concentration was verified.
Numerical analysis
All analysis was performed in MATLAB (MathWorks). Single-cell data from each experiment were imported, and each quantile of interest (50th, 90th, or 95th) was calculated for each motility metric and condition. Each set of growth factor conditions within a given quantile was then normalized to the condition absent of growth factor stimulation (or mean centered if indi-cated). The mean and standard error were then calculated from indepen-dent experiments. Comparisons of motility metrics between single growth factor conditions were performed using the Student’s t test or the Mann– Whitney test for single-cell data.
For single cell–based migration parameter clustering, Spearman correlation () of the parameters for individual cells from all experiments for a single cell line in 3D (n ≥ 3) were calculated and used to calculate pair-wise distances, in which perfect correlation corresponds to a distance of zero, and anticorrelation corresponds to a distance of two (1 ). Multidi-mensional scaling in two dimensions captured >99% of the distance quan-tities for all cell lines. The first principle component captured 90–95% of the distance quantities, whereas the second principle component captured 5–10%. Standard error was calculated by jackknife, during which each cell was removed separately, and each time, both the distances and scal-ing repeated (Efron and Gong, 1983). For clusterscal-ing of quantile-level migration metrics, each growth factor profile was mean centered and averaged across experimental replicates. Clustering of profiles and growth factors was performed by rank correlation and mean linkage.
Receptor expression and motility enhancement comparison were tested for significance using the binomial distribution. Where indicated, motility enhancement was variance normalized between cell lines by log transformation (so as to center fold-change values around zero) and by divi-sion by the standard deviation across growth factor conditions.
Growth factor profiles were compared by calculating the Spearman correlation, and significance was calculated by permutation. Where many comparisons were performed, multiple hypothesis testing was performed as indicated. When comparing migration in 2D and 3D contexts, multiple
on June 18, 2012
jcb.rupress.org
Downloaded from
Simpson, K.J., L.M. Selfors, J. Bui, A. Reynolds, D. Leake, A. Khvorova, and J.S. Brugge. 2008. Identification of genes that regulate epithelial cell migration using an siRNA screening approach. Nat. Cell Biol. 10:1027– 1038. http://dx.doi.org/10.1038/ncb1762
Tyan, S.W., W.H. Kuo, C.K. Huang, C.C. Pan, J.Y. Shew, K.J. Chang, E.Y. Lee, and W.H. Lee. 2011. Breast cancer cells induce cancer-associated fibro-blasts to secrete hepatocyte growth factor to enhance breast tumorigenesis.
PLoS ONE. 6:e15313. http://dx.doi.org/10.1371/journal.pone.0015313 Weigelt, B., J.L. Peterse, and L.J. van’t Veer. 2005. Breast cancer metastasis:
markers and models. Nat. Rev. Cancer. 5:591–602. http://dx.doi.org/ 10.1038/nrc1670
Wilson, T.R., D.Y. Lee, L. Berry, D.S. Shames, and J. Settleman. 2011. Neuregulin-1-mediated autocrine signaling underlies sensitivity to HER2 kinase inhibitors in a subset of human cancers. Cancer Cell. 20:158–172. http://dx.doi.org/10.1016/j.ccr.2011.07.011
Wolf, K., Y.I. Wu, Y. Liu, J. Geiger, E. Tam, C. Overall, M.S. Stack, and P. Friedl. 2007. Multi-step pericellular proteolysis controls the transition from individual to collective cancer cell invasion. Nat. Cell Biol. 9: 893–904. http://dx.doi.org/10.1038/ncb1616
Wolf, K., S. Alexander, V. Schacht, L.M. Coussens, U.H. von Andrian, J. van Rheenen, E. Deryugina, and P. Friedl. 2009. Collagen-based cell migra-tion models in vitro and in vivo. Semin. Cell Dev. Biol. 20:931–941. http://dx.doi.org/10.1016/j.semcdb.2009.08.005
Wolf-Yadlin, A., N. Kumar, Y. Zhang, S. Hautaniemi, M. Zaman, H.D. Kim, V. Grantcharova, D.A. Lauffenburger, and F.M. White. 2006. Effects of HER2 overexpression on cell signaling networks governing prolifera-tion and migraprolifera-tion. Mol. Syst. Biol. 2:54. http://dx.doi.org/10.1038/ msb4100094
Yarrow, J.C., G. Totsukawa, G.T. Charras, and T.J. Mitchison. 2005. Screening for cell migration inhibitors via automated microscopy reveals a Rho-kinase inhibitor. Chem. Biol. 12:385–395. http://dx.doi.org/10.1016/j .chembiol.2005.01.015
Zaman, M.H., L.M. Trapani, A.L. Sieminski, D. Mackellar, H. Gong, R.D. Kamm, A. Wells, D.A. Lauffenburger, and P. Matsudaira. 2006. Migration of tumor cells in 3D matrices is governed by matrix stiffness along with cell-matrix adhesion and proteolysis. Proc. Natl. Acad. Sci.
USA. 103:10889–10894. http://dx.doi.org/10.1073/pnas.0604460103 Goswami, S., E. Sahai, J.B. Wyckoff, M. Cammer, D. Cox, F.J. Pixley, E.R.
Stanley, J.E. Segall, and J.S. Condeelis. 2005. Macrophages promote the invasion of breast carcinoma cells via a colony-stimulating factor-1/ epidermal growth factor paracrine loop. Cancer Res. 65:5278–5283. http://dx.doi.org/10.1158/0008-5472.CAN-04-1853
Hankinson, S.E., W.C. Willett, G.A. Colditz, D.J. Hunter, D.S. Michaud, B. Deroo, B. Rosner, F.E. Speizer, and M. Pollak. 1998. Circulating concen-trations of insulin-like growth factor-I and risk of breast cancer. Lancet. 351:1393–1396. http://dx.doi.org/10.1016/S0140-6736(97)10384-1 Hutcheson, I.R., J.M. Knowlden, S.E. Hiscox, D. Barrow, J.M. Gee, J.F.
Robertson, I.O. Ellis, and R.I. Nicholson. 2007. Heregulin 1 drives gefitinib-resistant growth and invasion in tamoxifen-resistant MCF-7 breast cancer cells. Breast Cancer Res. 9:R50. http://dx.doi.org/10 .1186/bcr1754
Jin, Q., and F.J. Esteva. 2008. Cross-talk between the ErbB/HER family and the type I insulin-like growth factor receptor signaling pathway in breast can-cer. J. Mammary Gland Biol. Neoplasia. 13:485–498. http://dx.doi.org/ 10.1007/s10911-008-9107-3
Kim, H.-D., T.W. Guo, A.P. Wu, A. Wells, F.B. Gertler, and D.A. Lauffenburger. 2008. Epidermal growth factor-induced enhancement of glioblastoma cell migration in 3D arises from an intrinsic increase in speed but an extrinsic matrix- and proteolysis-dependent increase in persistence. Mol.
Biol. Cell. 19:4249–4259. http://dx.doi.org/10.1091/mbc.E08-05-0501 Kim, H.-D., A.S. Meyer, J.P. Wagner, S.K. Alford, A. Wells, F.B. Gertler, and
D.A. Lauffenburger. 2011. Signaling network state predicts twist-mediated effects on breast cell migration across diverse growth factor contexts. Mol.
Cell. Proteomics. 10:M111:008433–1–M111:008433–12. http://dx.doi .org/10.1074/mcp.M111.008433
Kipper, M.J., H.K. Kleinman, and F.W. Wang. 2007. New method for modeling connective-tissue cell migration: improved accuracy on motility param-eters. Biophys. J. 93:1797–1808. http://dx.doi.org/10.1529/biophysj .106.096800
Lara, R., F.A. Mauri, H. Taylor, R. Derua, A. Shia, C. Gray, A. Nicols, R.J. Shiner, E. Schofield, P.A. Bates, et al. 2011. An siRNA screen identifies RSK1 as a key modulator of lung cancer metastasis. Oncogene. 30: 3513–3521. http://dx.doi.org/10.1038/onc.2011.61
Lauffenburger, D.A., and A.F. Horwitz. 1996. Cell migration: a physically inte-grated molecular process. Cell. 84:359–369. http://dx.doi.org/10.1016/ S0092-8674(00)81280-5
Lazebnik, Y. 2010. What are the hallmarks of cancer? Nat. Rev. Cancer. 10:232– 233. http://dx.doi.org/10.1038/nrc2827
Mader, C.C., M. Oser, M.A.O. Magalhaes, J.J. Bravo-Cordero, J. Condeelis, A.J. Koleske, and H. Gil-Henn. 2011. An EGFR-Src-Arg-cortactin pathway mediates functional maturation of invadopodia and breast cancer cell invasion. Cancer Res. 71:1730–1741. http://dx.doi.org/ 10.1158/0008-5472.CAN-10-1432
McIntyre, E., E. Blackburn, P.J. Brown, C.G. Johnson, and W.J. Gullick. 2010. The complete family of epidermal growth factor receptors and their ligands are co-ordinately expressed in breast cancer. Breast Cancer Res. Treat. 122:105–110. http://dx.doi.org/10.1007/s10549-009-0536-5
Miller, M.A., L. Barkal, K. Jeng, A. Herrlich, M. Moss, L.G. Griffith, and D.A. Lauffenburger. 2011. Proteolytic Activity Matrix Analysis (PrAMA) for simultaneous determination of multiple protease activities. Integr. Biol.
(Camb.). 3:422–438. http://dx.doi.org/10.1039/c0ib00083c
Mograbi, B., N. Rochet, V. Imbert, I. Bourget, R. Bocciardi, C. Emiliozzi, and B. Rossi. 1997. Human monocytes express amphiregulin and heregulin growth factors upon activation. Eur. Cytokine Netw. 8:73–81.
Mouneimne, G., L. Soon, V. DesMarais, M. Sidani, X. Song, S.-C. Yip, M. Ghosh, R. Eddy, J.M. Backer, and J. Condeelis. 2004. Phospholipase C and cofilin are required for carcinoma cell directionality in response to EGF stimulation. J. Cell Biol. 166:697–708. http://dx.doi.org/ 10.1083/jcb.200405156
Pasanisi, P., E. Venturelli, D. Morelli, L. Fontana, G. Secreto, and F. Berrino. 2008. Serum insulin-like growth factor-I and platelet-derived growth factor as biomarkers of breast cancer prognosis. Cancer Epidemiol.
Biomarkers Prev. 17:1719–1722. http://dx.doi.org/10.1158/1055-9965 .EPI-07-0654
Philippar, U., E.T. Roussos, M. Oser, H. Yamaguchi, H.-D. Kim, S. Giampieri, Y. Wang, S. Goswami, J.B. Wyckoff, D.A. Lauffenburger, et al. 2008. A Mena invasion isoform potentiates EGF-induced carcinoma cell invasion and metastasis. Dev. Cell. 15:813–828. http://dx.doi.org/10.1016/j.devcel .2008.09.003
Roussos, E.T., M. Balsamo, S.K. Alford, J.B. Wyckoff, B. Gligorijevic, Y. Wang, M. Pozzuto, R. Stobezki, S. Goswami, J.E. Segall, et al. 2011. Mena invasive (MenaINV) promotes multicellular streaming motility and transendothelial migration in a mouse model of breast cancer.
J. Cell Sci. 124:2120–2131. http://dx.doi.org/10.1242/jcs.086231