The Design of a Controllable Energy Recovery Device for Solar
Powered Reverse Osmosis Desalination with
Experimental Validation
by
Elizabeth Anne Reed
Bachelor of Science, Mechanical Engineering
United States Naval Academy, 2010
MASSACHUSETTS INST E OF TECHNOLOGY
JUN
2
8 2012
LIBRARIES
ARCHIVES
Submitted to the Department of Mechanical Engineering
in Partial Fulfillment of the Requirements for the Degree of
Master of Science in Mechanical Engineering
at the
Massachusetts Institute of Technology
June 2012
@ 2012 Massachusetts Institute of Technology
All rights reserved
Signature of A uthor: ... . ...
Department of Mechanical Engineering May 10, 2012
Certified by:
...
... Steven Dubowsky Professo f Mechanical Enginee g74
ThejI
rvisor
A ccep ted b y : ...
David E. Hardt Chairman, Department Committee on Graduate Theses
The Design of a Controllable Energy Recovery Device for Solar
Powered Reverse Osmosis Desalination with
Experimental Validation
by
Elizabeth Anne Reed
Submitted to the Department of Mechanical Engineering
on May 10, 2012 in Partial Fulfillment of the
Requirements for the Degree of Master of Science in
Mechanical Engineering
ABSTRACT
The purpose of this thesis is to design and validate a controllable energy recovery device with
application to photovoltaic powered reverse osmosis (PVRO). The energy consumption of a
reverse osmosis plant depends significantly on the efficiency of its energy recovery process.
This work presents a concept for a controllable energy recovery process, so that a system can
operate optimally based on the incoming water and power characteristics. The design presented
here uses a variable nozzle and a Pelton wheel to recover energy from the high pressure
concentrated brine exiting the reverse osmosis membrane. The components are designed,
analytically modeled using fundamental engineering principles, and experimentally tested. The
experimental data is then used to check the validity of the formulated concept models. This
research encompasses the modeling and testing of a variable nozzle using a needle valve to
control the flow through the nozzle, and also of a Pelton bucket, to examine the effectiveness of
the momentum transfer from a high velocity jet to the Pelton wheel. This research is done to
examine the feasibility of this concept for potential implementation on a full scale PVRO system.
The component validation is performed to prove that the concept is effective and competitive
with other options.
ACKNOWLEDGEMENTS
I would like to thank Professor Steven Dubowsky for giving me the opportunity to work on this
project in the Field and Space Robotics Lab. He provided instrumental guidance in the completion of this thesis, and I am very grateful for the support and time that he puts into educating his students.
I would also like to thank my colleagues in the Field and Space Robotics Lab at MIT.
Specifically, I would like to thank Amy Bilton for her help setting up the data collection software used in experimentation. Her guidance was invaluable. Also, Leah Kelley and Adi Bhujle have been constant sources of knowledge in the field of PVRO and I am grateful to work with and learn from them each day.
I am also thankful for the financial support of the Center for Clean Water and Clean Energy at MIT and KFUPM. The project is a part of a collaboration between the two universities. I was lucky enough to have the chance to travel to Saudi Arabia and visit our colleagues in 2011, which was not only educational, but was also a great cultural experience.
Lastly, I would like to thank my family for their love and support. I can always count on them to be there for me no matter the situation -whether it is talking on the phone when things are
stressful or being there for me at the end of a marathon when I can barely walk. I love them and am very thankful to have such wonderful people in my life.
CONTENTS
ABSTRACT ...
3
ACKNOWLEDGEMENTS ... 5CONTENTS ...
7
LIST OF FIGURES
... 9LIST OF TABLES
... .. 10 CHAPTER 1: INTRODUCTION... 12 1.1 MOTIVATION ... 121.1.1 Importance of Photovoltaic Reverse Osmosis Desalination... 13
1.1.2 Reverse Osmosis is an Energy Intensive Process ... 14
1.1.3 Energy Recovery is Key ... 15
1.1.4 The Need for Small-Scale Variable Energy Recovery ... 16
1.2 RESEARCH OBJECTIVE ... 19
1.3 SUMMARY OF APPROACH ... 19
CHAPTER 2: BACKGROUND AND LITERATURE REVIEW ... . 21
2.1 PVRO OVERVIEW ... 21
2.1.1 Reverse Osmosis ... 21
2.1.2 Photovoltaics... 22
2.1.3 Small-Scale PVRO ... 23
2.2 ENERGY RECOVERY OPTIONS ... 24
2.2.1 Pressure Exchange... 24
2.2.2 Hydro-machinery for Variable Recovery Ratio... 27
2.3 THE PELTON WHEEL... 29
CHAPTER 3: CONCEPTUAL AND ANALYTICAL DEVELOPMENT...32
3.1
CONCEPT DEVELOPMENT...32
3.2
CONTROLLABLE NozzL E ANALYTICAL MODEL ...33
3.2.1 Nozzle selection... 33
3.2.2 Nozzle calculations ... 36
3.3
PELTON BUCKET ANALYTICAL MODEL ... 463.3.1 Redirection losses and imperfect momentum transfer in a Pelton bucket... 47
3.3.2 Friction drag on inside surface of a Pelton bucket... 51
3.4
PELTON WHEEL FUNDAMENTAL RELATIONSHIPS ... 573.5 POTENTIAL CONTROL METHOD: LINEAR MECHANICAL ACTUATOR ... 58
CHAPTER 4: EXPERIMENTAL VALIDATION...66
4.1 EXPERIMENTAL SYSTEM DESCRIPTION... 66
4.2 CONTROLLABLE NozzLE MODEL VALIDATION ... 70
4.3 PELTON BUCKET MODEL VALIDATION ... 73
4.4 EXPERIMENTAL RESULTS... 76
4.4.1 Controllable Nozzle Results... 76
4.4.2 Pelton Bucket Results... 79
4.5 SENSORS AND RELIABILITY OF DATA ... 80
4.5.1 Flow Sensor ... 81
4.5.2 Pressure transducer... 81
4.5.3 Load cell... 82
CHAPTER
CONC USN ... .C...O...
83
5.1 VALIDITY OF MODEL AND EXPERIMENTAL WORK... 83
5.2 FUTURE WORK ...
84
APPENDIX
A:
THE PELTON WHEEL... ... 88APPENDIX B: NOZZLE DESIGN
... ... 93APPENDIX
C:
HARDWARE SPECIFICATIONS ... .96LIST OF FIGURES
Figure 1-1: Flow scheme entering and exiting reverse osmosis membrane ... 15
Figure 1-2: Salinity variation by location - Mediterranean and South Asia [6]... 17
Figure 1-3: Salinity variation by time of year (single location) [7]... 18
Figure 2-1: Comparison of differential pressure requirement for various purification methods [9], [10]... 22
Figure 2-2: Representative PVRO system... 23
Figure 2-3: Pressure exchange conceptual figure ... 25
Figure 2-4: PX Pressure Exchanger [16]... 26
Figure 2-5: Components of MIT Experimental PVRO system with Clark Pump ... 26
Figure 2-6: Clark Pump operation [18]... 27
Figure 2-7: Setup with high pressure pump in parallel configuration with Clark Pump [20]... 28
Figure 2-8: Hydraulic Pressure Booster with valve control [21]... 29
Figure 2-9: Computer drawing of Pelton runner for future experimental work ... 30
Figure 3-1: Nozzle options, Left to Right; (a) Long radius nozzle, (b) Orifice, (c) Converging conical nozzle... 34
Figure 3-2: Converging conical nozzle with needle valve... 35
Figure 3-3: Labeled nozzle diagram... 36
Figure 3-4: Variation of needle valve resistance coefficient vs. Percentage of nozzle open at its exit plane ... 41
Figure 3-5: Flow rate variation with changing nozzle opening at exit ... 41
Figure 3-6: Nozzle efficiency variation with changing pressure and flow rate... 44
Figure 3-7: Close up view of region of most efficiency variation with flow rate ... 45
Figure 3-8: Effect of varying nozzle exit are on nozzle efficiency... 46
Figure 3-9: Cross section of Pelton bucket showing flows... 47
Figure 3-10: Diagram to deduce relative velocities... 48
Figure 3-11: Bucket efficiency variation with redirection angle
p...
51Figure 3-12: Pelton bucket figure showing characteristic length of flow for one half of the bucket ... 52
Figure 3-13: Force diagram in Pelton bucket ... 54
Figure 3-14: Variation of Pelton bucket efficiency with flow rate... 56
Figure 3-15: Conceptual computer controllable mechanism for needle valve ... 59
9
Figure 3-16: Detailed nozzle and valve diagram ...
61
Figure 3-17: High level control flow diagram for PVRO with ERD subsystem... 63
Figure 4-1: Experimental setup with labels ...
67
Figure
4-2:
Experimental nozzle assembly (left) with close up view of the valve adjustment
m echanism (right)...
68
Figure 4-3: Region of interest for experimental testing...
69
Figure 4-4: Picutre of flat plate experimental setup...
71
Figure 4-5: Predicted impulsive force on flat plate ...
72
Figure 4-6: Pelton-like bucket experimental setup ...
74
Figure 4-7: Pelton-like bucket used in experimentation...
74
Figure 4-8: Measured forces on flat plate vs. Analytical model prediction...
77
Figure 4-9: Experimental nozzle efficiency plotted vs. Predicted efficiency with variation in flow
rate and pressure...
78
Figure 4-10: Close up view of region of interest for nozzle efficiency experimental results... 79
Figure 4-11: Experimental results from Pelton bucket efficiency testing ...
80
Figure A-1: Original sketches included in Lester Pelton's patent application in 1880 [24]____87
Figure A-2: Conceptual Pelton bucket wheel drawing---
88
Figure A-3: Velocities associated with Pelton bucket_____________________---89
Figure A-4: Ideal torque, power and bucket velocity relationships in Pelton wheel operation-90
Figure B-1: Controllable nozzle used in experimentation .__________________92
Figure B-2: Nozzle drawing_________________________________---93
Figure B-3: Pipe drawing ._ __ _ ___ _ _ _ _ _ ___ _ _ _ __ _ ___ _ _ _ __ _ _ __ 93
Figure B-4: Guide drwaing with corss sectional drawing of vane. ______________94
Figure B-5: Needle valve rod drawing...94
Figure B-6: Manual valve adjustment mechanism used in experimentation __________94
LIST OF TABLES
Table 1: Typical coefficients of discharge for three nozzle designs...
34
Table 2: Table of measured experimental variables ...
68
Table 3: Representative system sizes with varying recovery ratio based on experimental brine
flow rates in gpm ...
70
CHAPTER
1
INTRODUCTION
This thesis aims to increase the efficiency of photovoltaic powered reverse osmosis (PVRO) on a
"community-size" scale with the design of a controllable energy recovery device. This work is
part of ongoing research in PVRO in the Field and Space Robotics Laboratory (FSRL) at MIT.
The focus of this work is to develop a method for implementing variable energy recovery in a
small-scale PVRO system. A variable energy recovery device controls the pressurized brine
stream exiting the reverse osmosis unit in order to recycle the energy back into the system in a
useful way. A conceptual design suitable for implementation on small-scale systems is presented
and validated experimentally. A variety of control methods have been applied to small-scale
system models and an experimental system at MIT, but this is the first work done in the area of
modeling and validating a method for variable energy recovery as a part of this ongoing research
in the FSRL. The motivation for work in the field of solar powered desalination, the objectives
of this thesis, and the summary of approach are presented in this chapter.
1.1 Motivation
Roughly one out of every seven people in the world, 780 million people globally, does not have
access to clean water for drinking and sanitation [1]. There is an clear need for clean water
technologies. Furthermore, there is a need for water purification or desalination technologies
Chapter 1: Introduction
12
12that can be deployed to areas of the world with extreme poverty and unreliable power sources, which is where the majority of those who lack clean water live.
The need for clean water in remote areas also extends to war zones where soldiers are deployed abroad to countries lacking in freshwater, as exemplified by the deployments of American and United Nations soldiers in the last decade. In 2011, a Department of Defense study estimated the cost of bottled water delivered to a forward operating base in Afghanistan to be $4.69 per gallon
[2]. Additionally, this price does not include the potential human cost that comes with securing convoys that deliver bottled water to the battlefield. A solar powered desalination unit
eliminates not only these expenses but also the need to transport fossil fuels to warzones to fuel conventionally powered water purification systems.
1.1.1 Importance of Photovoltaic Reverse Osmosis Desalination
The need for solutions to the world's lack of clean water is painfully obvious when looking at the statistics. Many places in the world that lack clean water have favorable solar resources [3]. By taking advantage of an area's abundance of sunlight, it is possible to harness the power necessary to desalinate seawater or brackish groundwater. These complementary supply and demand characteristics make solar powered desalination an ideal solution to the global need for clean water. Furthermore, reverse osmosis (RO) is an ideal desalination process to be used in this context because it scales much better than some thermal processes used for desalination [3]. In the PVRO system concept used for this research, no batteries are used to store energy; the system components are controlled to operate optimally given the available power. A solar powered desalination system is a sustainable option with very low maintenance and logistical costs. Once a PVRO system is delivered to a location it can be self-sustaining if all necessary controls and cleaning cycles are internally implemented, with the exception of occasional
membrane and filter changes and cleaning the PV panels when dust or debris collects on the surface. An autonomous option for water purification is ideal when access to technical equipment and labor is not readily available.
1.1.2 Reverse Osmosis is an Energy Intensive Process
While reverse osmosis is a sustainable and feasible long-term solution to clean water shortages in areas with favorable solar conditions, it is also an energy intensive process. The reverse osmosis process requires that feed water be pressurized to a pressure higher than its osmotic pressure in
order for clean water to permeate through the membrane. The energy needed to desalinate the water depends on the chemical and microbiological makeup of the feed water. The amount of energy required for reverse osmosis desalination increases with increasing salt concentration. For example, brackish groundwater has a lower salt concentration than seawater; given this information, more clean water can be produced from brackish feed water than seawater with the same amount of energy. In order for the product water to be safe to drink, it must also be free of harmful micro-organisms that cause disease. Accepted convention for quantifying energy in terms of water production is called specific energy consumption, with the units of kWh/m3. The
theoretical minimum specific energy consumption to desalinate seawater (at 25*C) is 0.7 kWh/m3 [4]. For a small-scale PVRO system on the scale of the concept explored in this work (<5 m3 per day), the specific energy consumption has been seen to range from 2.5 - 4.0 kWh/m3
[3]. By controlling system operation and using the most efficient combination of components for
a small-scale system, lowering the specific energy consumption (i.e. increasing the system's efficiency) is possible.
Chapter 1: Introduction
14
1.1.3 Energy Recovery is Key
As a result of the energy intensive nature of reverse osmosis, the overall efficiency of the system depends heavily on the efficiency of the energy recovery process of the pressurized brine water exiting the membrane. Only a certain percentage of the feed water is desalinated as it flows through the RO membrane unit; the remainder of the feed water exits the membrane while still at high pressure, but at a higher salt concentration than the feed water. Turning this high pressure brine water into useable energy for the system is referred to as the "energy recovery" process in RO. Figure 1-1 shows the flows into and out of a reverse osmosis unit. The RO unit consists of a pressure vessel which contains a spiral-bound membrane.
Reverse Osmosis Unit
Feed Water Cean Product Water
Hgh PressureQ Brine
Figure 1-1: Flow scheme entering and exiting reverse osmosis membrane
To exemplify the importance of the energy recovery loop, a single PV panel may produce around 300W of electrical energy at a given time, but the energy flow in the system (using only one panel) may be as high as 2kW at that same point in time. This is due to the conservation of energy throughout the system, due in large part to an effective energy recovery device which recycles energy within the system.
Chapter 1: Introduction
15
1.1.4 The Need for Small-Scale Variable Energy Recovery
Because solar processes are naturally stochastic, it is necessary for a PVRO system to respond to natural changes in power so that it operates in an optimal way. The system concept considered here does not include batteries. Batteries are heavy and need replaced often, so they do not fit the mold for a portable, autonomous system requiring little maintenance. Hence, the available power is constantly changing throughout the day based on environmental conditions. One way to exploit the opportunities for power control in PVRO systems is to control the brine stream exiting the RO membrane. As mentioned previously, more power is required to desalinate water with a high salt concentration. Since the amount of solar power coming into the system is not a controllable variable, one option to maximize the output of clean water is to use the available power and incoming water characteristics to define how the system operates.
In the majority of current small-scale PVRO systems, the recovery ratio, r, the ratio of clean water to feed water, is fixed, thereby fixing the ratio of brine water to feed water. The fixed recovery ratio setup does not allow for the control of the brine stream to attempt to exploit the power and water characteristics of the system. The recovery ratio, r, is given by:
r==QPQF-QB =1 Q
1
QF QF QF
where QF is the feed water flow rate into the RO membrane, Qp is the clean product water flow rate out of the membrane, and QB is the concentrated brine flow rate out of the membrane. The solution to the control problem presented in this thesis is referred to as "variable energy recovery." A variable energy recovery method has the ability to vary a system's recovery ratio through control of the flows entering or exiting the membrane. One motivation for the use of variable energy recovery relates to the feed water characteristics of a system. Because the osmotic pressure varies with salinity, the optimal recovery ratio will also vary with salinity.
Also, if the salt concentration of the brine stream becomes too high, the membrane risks possible
scale formation which decreases the effectiveness of the membrane
[5].
A variation in recovery
ratio can be used to control this concentration buildup in the brine stream. For example, in a
location where the feed water is mostly brackish ground water (low salinity), a higher recovery
ratio can be used without risking a buildup of highly concentrated brine water in the RO
membrane which may lead to membrane scaling. Figure 1-2 shows salinity variations by
location in the Mediterranean and South Asia, where water properties can vary significantly [6].
Low
Salinity
High
Salinity
30
31
32
33
34
35
36
37
38
39
Parts per Thousand (ppt) of Salt
Figure 1-2: Salinity variation by location -Mediterranean and South Asia [6]
Feed water coming from the Mediterranean region would have a much higher salt concentration
than feed water from Indonesia. Also, feed water characteristics vary over the course of a
calendar year. Figure 1-3 shows the salinity variation over one calendar year for a given location
in the Mediterranean [7].
Chapter 1: Introduction
17
41 D38 -Ct)
~37
35, 34 33 MJan March May Juy Sept Nov Jan
Month
Figure 1-3: Salinity variation by time of year (single location) [7]
It is clear that the feed water characteristics for a reverse osmosis system are highly dependent on
both location and time of year. One of the advantages of a small-scale desalination unit is its
mobility; therefore, it is necessary to study the variations in water quality based on location and
time of year, as a system could potentially be deployed anywhere in the world at any time of the
year.
This thesis explores one variable energy recovery method in depth with conceptual models and
experimental validation that are appropriate for implementation on a small-scale PVRO system.
Research into the overall power control of a PVRO system is beyond the scope of this thesis, but
is the motivation for variable energy recovery.
The controllable device designed and tested here consists of a variable nozzle and a Pelton wheel
used to control the pressure of the brine stream and recover the energy from the high pressure
brine water in the form of electrical energy with the use of a generator. This
nozzle-turbine-generator concept was chosen due to its ease of modeling using fundamental engineering
Chapter 1: Introduction
18
principles. Also, as discussed in the literature review in Chapter 2, there is a very limited selection of small-scale energy recovery devices commercially available.
1.2
Research Objective
The research objective is to design, build, and test a variable energy recovery concept for application in small-scale PVRO. The concept must be able to be well-modeled using fundamental engineering principles. The practicality and effectiveness of the variable energy recovery concept explored in this work is seen in the design method for the concept and the
experimental results presented in this thesis. The energy recoveryconcept developed and experimentally validated is suitable for inclusion in an analysis of the energy flow within a PVRO system.
1.3
Summary of Approach
A literature review was completed to understand the basics of small-scale PVRO, the current
state-of-the-art in energy recovery for RO systems, and the fundamentals of the Pelton wheel. The literature review focuses on current energy recovery devices and their performance in small-scale and larger systems. After compiling the relevant background information, an appropriate concept for the analytical modeling, design and experimental validation of a variable energy recovery device was developed. Analytical models based on fundamental engineering principles were created to represent the functioning of the variable nozzle and Pelton wheel setup. An appropriate experimental size was selected, which can be scaled to represent larger or smaller systems, and a variable nozzle was designed and manufactured. The Pelton wheel was sized appropriately for the experimental bounds of the flow and pressure and a Pelton-like bucket was manufactured to test the efficiency of the momentum transfer between the flow and the wheel.
Pelton bucket and wheel designs were created using computer aided design. The Pelton design was not the focus of this thesis; the wheel is simply a mechanical tool used to attempt to achieve a controllable configuration for energy recovery. Therefore, the design of the bucket and wheel used for experimentation discussed in this thesis was largely based on a published design [8]. Experimental efforts to validate the nozzle and Pelton bucket models were conducted. The experimental data was then analyzed and it was determined that this device and concept has the potential to be used for variable energy recovery in small-scale PVRO. A complete Pelton wheel was designed and manufactured, but the experimental testing is not yet complete. Therefore, the conclusions to this work consider only the variable nozzle and Pelton bucket results.
Chapter 1: Introduction
20
CHAPTER
2
BACKGROUND AND LITERATURE REVIEW
2.1
PVRO Overview
2.1.1 Reverse Osmosis
Reverse osmosis is one of several processes used to separate a solvent and solute. In the case of
desalination, the solvent is water and the solute is salt
-
contained in either seawater or brackish
groundwater. In reverse osmosis, the complete solution is pressurized to a pressure greater than
the osmotic pressure of the solution. When this occurs, some of the solvent passes through a
membrane, which prevents the passage of salt. The remaining solution (concentrated brine)
remains pressurized. As mentioned in the previous section, reverse osmosis is an energy
intensive process. However, it is also the desalination method most effective at particulate
separation when compared to other filtration methods for desalination [9]. Figure 2-1 shows the
comparison between reverse osmosis and different filtration methods by comparing the pressure
difference required for each method and the particle size inhibited from permeating through the
filter or membrane into the product water. Common particulates and their sizes are also plotted
in Figure 2-1. The fact that reverse osmosis requires the largest pressure difference out of any of
the methods makes it clear that it is the most energy intensive method.
Chapter 2: Literature Review
21
200 Visible Particulate
. .Endotoxins--. -Clay Silt Fine Sand
.ueo Viruses Bacteri
SaltI CL e-insecticide DustsA e-Protozoan
Cysts-010
MicrofiltrationFiltration
01
I-0.0001
0.001
0.01
0.1
1
10
100
Particle and Molecular Size [pm]
Figure 2-1: Comparison of differential pressure requirement for various purification methods [9], [10]
2.1.2
Photovoltaics
It has been shown that harnessing solar energy to power a small-scale reverse osmosis
desalination unit can be more cost effective over the lifetime of a system than using common
fossil fuels in many regions of the world due to favorable solar resources [3]. However,
photovoltaics themselves are inefficient at converting solar energy into electrical energy. The
National Renewable Energy Laboratory has compiled data for what it considers the best research
in the solar cell field, and the top efficiencies reach only 42% [11]. These technologies are not
yet available on the commercial market. Most commercially available PV panels have
conversion efficiencies close to 18% [11]. While the solar radiation itself doesn't
cost
consumers anything, there is an up-front capital cost associated with using PV in order to convert
the solar energy into a usable form. When using PV to energize the reverse osmosis process, an
energy recovery device has the potential to offset this capital cost by recycling energy within the system and producing more clean water per kilowatt than the amount of kilowatts actually coming into the system as solar radiation.
2.1.3 Small-Scale PVRO
Since reverse osmosis is an energy intensive process, and solar panels have low energy conversion efficiencies, it is important to maximize each component's efficiency in a PVRO system. Many PVRO setups use batteries to store energy and operate the system at a steady state throughout the day [12], [13]. A setup with batteries eliminates the need for real-time control over the components' operating points; however, batteries also lead to further energy losses in the system and add to the capital and maintenance costs of utilizing the technology. Also, the portability and reliability of the system are diminished with the use of heavy lead acid batteries with short life spans [13]. A representative figure for a conceptual PVRO system without batteries is shown in Figure 2-2.
Motor Opmodeut Clean Poduct
Water PWawer Variable Nozzle Energy L --- --- Generator Recovery Turbine Brine Exhaust Figure 2-2: Representative PVRO system
This thesis focuses on small-scale PVRO systems, also referred to as community scale. The water produced by one system would be sufficient for a group of anywhere from 10 to 50 people
to survive on, using the water for domestic uses such as sanitation and drinking. The amount of water used per person depends on the specific water demand, which is a function of location. People in the United States use more water per capita (35.6 liters/day/person) than people in Guatemala (16.4 liters/day/person) [14], [15]. These statistics focus the system size considered here to have a capacity of between 300 liters/day and 5,000 liters/day to be sufficient for a community-sized group of people at a given location.
2.2 Energy Recovery Options
An energy recovery device (ERD) in any reverse osmosis system takes the energy in the high pressure brine waste water from the membrane and converts it to a form of usable energy for the system. Many different energy recovery devices are commercially available, but the options become limited as system size decreases.
2.2.1 Pressure Exchange
An isobaric pressure exchange device directly pressurizes the feed water with the high pressure brine stream. These devices are very efficient, but are difficult to use to actively control a PVRO system. If an RO plant has constant power input and the feed water quality has little variation, then a pressure exchange device may be the best option. However, because of the stochastic nature of PVRO, the pressure exchange device may not be the most suitable option for an energy recovery device in the type of system considered in this thesis; there are no batteries to hold the incoming power constant, which means that the system must adapt to real-time changes in solar radiation. Instead of storing energy in batteries which add additional discharge losses to the
system, the concept studied here stores the energy in the clean water - all energy coming into the
system is used to produce clean water.
The operation of a pressure exchange ERD is most clearly explained through a drawing of the flows into and out of the device. The basic premise of the operation is shown in Figure 2-3.
High Pressure Feed Water High Pressure Brine Water Pressure Exchange Device Low Pressure Feed Water Low Pressure Brine Water
Figure 2-3: Pressure exchange conceptual figure
There are several pressure exchange devices on the market, but due to lack of scaling in size some are not suitable for small-scale RO. Energy Recovery Incorporated (ERI) makes a ceramic rotary pressure exchange device called the PX Pressure Exchanger (Figure 2-4). These devices require little maintenance because they are lubricated by the water flowing through the device
and have few moving parts.
However, they are only made to handle flow rates from 20-300 gal/min [16]. While these devices increase the efficiency and decrease the cost of operation in some of the largest RO plants in the world, this range of flows is not suitable to handle the brine flows in a small-scale system. Brine flow rates of 20 gal/min will not be seen in a community scale PVRO system.
Chapter 2: Literature Review
25
Figure 2-4: PX Pressure Exchanger [16]
A second company offering a different, non-rotary type of pressure exchange device is Spectra
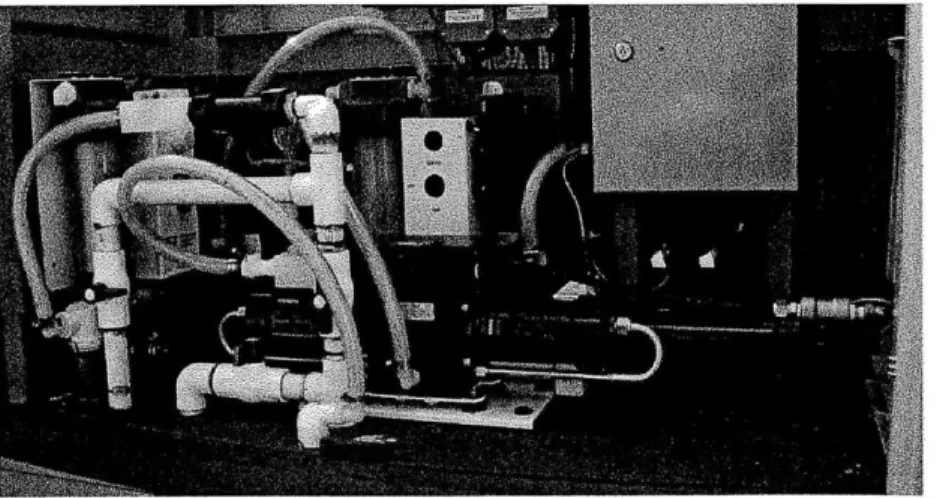
Watermakers. Spectra manufactures two pressure exchange devices that is made specifically for small-scale systems, the Clark Pump and the Pearson Pump. Between the two devices, feed water flow rates up to 6.5 gal/min can be handled by the systems [17]. While the company's main market is the marine industry, their products can be utilized in a land-based PVRO system as well. An experimental PVRO system currently at MIT uses Spectra's Clark Pump as the primary ERD, shown in Figure 2-5.
Figure 2-5: Components of MIT Experimental PVRO system with Clark Pump
However, because the Clark Pump is a fixed ratio pressure exchanger (the pressure chamber volume and piston size is constant), there is no way to actively control the recovery ratio without
adding additional mechanical components to the overall system. The function of the Clark Pump is illustrated in Figure 2-6 [18].
Pro-duct
Mernbrane
Pressur zing
DrBang
Feed
-T+
Water
Figure 2-6: Clark Pump operation [18]
Sea Recovery Corporation also manufactures an integrated RO unit and fixed ratio pressure exchange device for small-scale applications. Danfoss, a Denmark-based company, also makes a fixed recovery ratio pressure exchanger called the RO-Boost. The RO-Boost operates at a 13% recovery ratio and can operate in systems producing up to 3,000 liters/day of clean water [19].
2.2.2
Hydro-machinery for Variable Recovery Ratio
While pressure exchange devices offer high reliability and efficiencies as ERDs, they require the RO system to operate at a fixed recovery ratio, determined by the size of the chamber of the device. By adding a positive displacement pump in parallel with Clark pump (Figure 2-7), it is possible to control the ratio of flows into and out of the RO membrane [20]. Power supplied to the high pressure feed water pump is varied in order to vary the total flow rate into the RO membrane, which varies the recovery ratio. This method works well for varying the recovery ratio. The disadvantage of this configuration is the addition of a high pressure pump to the system, which is not trivial and adds additional losses in mechanical efficiency.
Chapter 2: Literature Review
27
HP Feed Water Pump LP Feed Reverse Water Osmosis Pump Membrane Clean Water Clark Pump .. HP Brine LP Brine
Figure 2-7: Setup with high pressure pump in parallel configuration with Clark Pump [20]
A second approach to using hydro-machinery to control the recovery ratio is presented by FedCo
in their Hydraulic Pressure Booster (HPB). The HPB is a single piece of machinery that acts to turbocharge the feed water using the high pressure brine water. It can be visualized as a turbine and a centrifugal pump acting on a common shaft [21]. However, the most current device on the commercial market is still ten times larger than needed for a small-scale system. Figure 2-8 shows the flows and proposed control mechanism for the HPB .
Main ""one
Aux volve
AuXdihay norits
Tutine Ivesem /ig
impener rin (a
position
Figure 2-8: Hydraulic Pressure Booster with valve control [21]
Chapter 2: Literature Review 28
2.3
The Pelton Wheel
The Pelton wheel is an impulse turbine designed to produce power from fluid striking the vanes of the turbine rotor, or runner. The Pelton wheel was designed by Lester Pelton in the 1880's
and has primarily been used to generate hydroelectric power, on both large and small-scales [22]. An impulse turbine uses the conservation of momentum to describe the turbine's operation and mechanical power transfer [23]. Typically, a high pressure, low flow water source will be
accelerated through a nozzle; the high velocity jet then strikes the turbine rotor, causing the wheel to rotate and generating power. An original sketch from Pelton's patent application is included in Appendix A [24]. A drawing of the Pelton wheel that will be manufactured for use in future experiments is shown in Figure 2-9. The design for this particular wheel followed the design suggestions in [8].
Figure 2-9: Computer drawing of Pelton runner for future experimental work
Much research has been done on the operation of Pelton wheels in conjunction with power generation components, such as synchronous AC generators, but the research done here focuses only on the modeling and validation of a controllable nozzle and a Pelton bucket. However, the fundamentals of the motion of a full Pelton wheel are integral to the control of the energy recovery device concept presented in this work. Therefore, Appendix A presents the
mathematical relationships between jet velocity and bucket tangential velocity and their effect on the mechanical efficiency of the wheel. The most important piece of information in the
fundamental analysis is that the Pelton wheel has its maximum mechanical efficiency when the ratio of jet velocity to bucket velocity is equal to one half [25]. This ideal speed ratio can be used in a proposed control method to operate the energy recovery device at maximum efficiency, no matter what the upstream flow rate or pressure may be.
Research that attempts to control the flow coming into the Pelton wheel by using an adjustable nozzle has been documented as early as 1905, and the use of a needle valve to control the flow has been documented as early as 1922 [26], [27]. However, there is little scalable information available on needle valves themselves. Most valve resistance coefficients presented in the literature are form common valve types such as gate, disk and globe valves [28]. It is important to note than the literature showed some hesitancy with using needle valves due to the possibility of cavitation within the nozzle [29]. The design of the nozzle with needle valve for
experimentation addresses the problem of cavitation and is discussed further in Appendix B.
Chapter 2: Literature Review
30
CHAPTER
3
CONCEPTUAL AND ANALYTICAL DEVELOPMENT
3.1
Concept Development
This thesis presents a practical and verifiable method for variable energy recovery in PVRO.
This solution consists of a controllable nozzle and a Petlon turbine. The physics of the Pelton
wheel are well established and can be experimentally verified in a lab setting. However, a
variable nozzle requires some design effort in order to suit the application, in this case,
small-scale PVRO. Therefore, a variable nozzle design used to control the brine flow exiting a reverse
osmosis membrane is presented. A Pelton wheel is studied and designed, using published design
resources, so as not to "reinvent the wheel." The designed components are modeled and
experimentally tested to validate the concept of using a variable nozzle in conjunction with a
Pelton wheel for controllable energy recovery in a small-scale PVRO system.
In the conceptual model, the brine stream is simulated by defining a flow rate and nozzle
diameter; from the relationships presented in this chapter, it can be seen that the nozzle diameter
corresponds to a particular pressure for a given flow. Because the flows and pressures in an
actual PVRO system vary throughout the day, the simulated flows and pressures correspond to
operating points for a representative system defined by its water production. This will be
explored in detail in Chapter 4. In a physical system, it is feasible to believe that the flow rate of
high pressure brine exiting the RO membrane can be easily measured. The goal of the models is
to determine how the nozzle efficiency and Pelton bucket efficiency will be affected by changes
in system parameters, namely brine flow rate and pressure. Nozzle efficiency is a measure of how well the nozzle converts the energy in the pressurized brine water into kinetic energy in the
form of a water jet. Pelton bucket efficiency is a measure of the effectiveness of the momentum transfer between the high velocity jet and the Pelton wheel. This chapter presents the analytical models developed for both the variable nozzle and the Pelton bucket.
3.2
Controllable Nozzle Analytical Model
3.2.1 Nozzle selection
The first step in modeling the controllable nozzle is to choose a design that is most effective for the application of brine flow control. Fluid mechanics literature presents several options for converting high pressure fluid to a high velocity jet [28]. Cross sections of three options are shown in Figure 3-1. The three nozzle designs can be compared using their respective nozzle discharge coefficients, Cd. A higher discharge coefficient is associated with lower losses as the high pressure fluid is converted into a high velocity jet due to the pressure difference across the nozzle, AP. The relationship between the discharge coefficient, fluid density (p), nozzle outlet area (AN) , 8, the pressure difference between the nozzle inlet and outlet, and the flow through the
nozzle (QN) is given by:
[QNP/d
N
QN =CdAN
[
l-&PJ
wher
/ N(2)
1,-T_ where di
The ratio
fl
is defined as the ratio of the nozzle outlet diameter (dN) to the nozzle inlet diameter
(di) [28].
Chapter 3: Conceptual and Analytical Development
32
Figure 3-1: Nozzle options, Left to Right; (a) Long radius nozzle, (b) Orifice, (c) Converging conical nozzle
A long-radius nozzle (Figure 3-la) could be used for this application, but due to the very high
pressure difference, a more gradual change in cross-flow area proves to be more effective and
result in a lower nozzle discharge coefficient [28]. The same argument exists against using an
orifice (Figure 3-ib). The orifice option is simple to produce, but the conversion of high
pressure brine to a concentrated jet is much less efficient using this design than the other two
designs presented here. Literature suggests that a converging conical nozzle results in the highest
Cd
value, and would therefore be most effective for the purpose of this work (Figure 3-1c) [28].
The more gradual convergence of the nozzle, the lower the loss associated with the flow through
the nozzle. Typical
Cd
values for the three nozzle designs presented here are compiled in Table
1. Expected brine flow values were used to calculate each coefficient from correlations in [28].
Table 1: Typical coefficients of discharge for three nozzle designs
Nozzle Type
Typical Coefficient
of Discharge, CdLong-radius nozzle
0.975
Flat plate orifice
0.596
Converging conical nozzle
0.986
A mechanism to control the nozzle cross-section and fluid flow also needs to be selected.
Needle valves have been used to throttle high pressure fluid to create a high velocity jet for
Pelton wheels [27]. Figure 3-2 shows a nozzle head containing a needle valve; the valve moves
Chapter 3: Conceptual and Analytical Development
33
axially within the nozzle to adjust the effective nozzle exit area and therefore the velocity of the
jet exiting the nozzle.
Figure 3-2: Converging conical nozzle with needle valve
To be complete, other types of valves are considered. The valve performance can be compared using the valve resistance coefficient, K,. The head loss associated with a valve (AP) is given
by:
1
AP, =-KpV2 (3)
2v
where p is the fluid density and Vis the fluid velocity as it flows through the valve [28].
However, the valve resistance coefficient will vary with the fractional opening of the nozzle exit. The more the valve is utilized, the greater the resistance coefficient. The resistance coefficients for gate, disk and globe valves are all examined and compared to the needle valve's estimated resistance coefficient. This correlation for a needle valve is presented in Section 3.3.
The needle valve has the lowest expected valve resistance coefficient for use in a converging conical nozzle, and therefore is the best choice, resulting in the lowest losses as the valve is used to control the flow through the nozzle. Needle valves have also been called throttle, cone, or
spear valves [29].
Chapter 3: Conceptual and Analytical Development 34
There are several drawbacks to the selected design. First, the converging nozzle with needle valve configuration is very expensive to manufacture. Second, the needle valve can be easily damaged in the event of cavitation due to its frail design at its tip. After considering all factors, the converging nozzle was deemed the best option due to the fact that the flow would gradually be directed to the nozzle exit, as opposed to the flow abruptly meeting the exit as in a long-radius nozzle or orifice. Also, a needle valve tip can be designed using an angle equal to the angle of convergence of the nozzle in order to minimize turbulence within the nozzle and provide a mechanism to control the nozzle exit area and jet velocity.
3.2.2 Nozzle calculations
After selecting the most appropriate nozzle and flow control mechanism for the application, the fluid calculations and principles governing the flow through the nozzle are applied. The governing equations of the converging nozzle are presented here, along with the fundamental equations associated with the use of a needle valve. The nozzle shown in Figure 3-3 includes labels that will be referred to for the remainder of this thesis.
Figure 3-3: Labeled nozzle diagram
Chapter 3: Conceptual and Analytical Development
35
The nozzle's angle of convergence, which is also equal to the needle valve's angle of
convergence at its tip is labeled as c. The diameter of the nozzle at its exit plane is d0, and the
diameter of the valve at the same plane is d,. The upstream pressure (P), volumetric flow rate (QI), flow velocity (VI), and nozzle diameter (dI) are also shown. The flow characteristics just downstream of the nozzle exit area also labeled: pressure (P,), volumetric flow rate (QN), and jet velocity (V).
Several assumptions are made in order to model the fluid flow through the nozzle using
fundamental engineering principles. The first assumption is that water is incompressible. There may be some small compressibility factor associated with flows at high pressures, but it will be negligible and can be disregarded. This assumption means that Qi and QN are identical. A second assumption is that the water upstream of the nozzle has a negligible velocity which is set to zero. This is a simplification, since water must be flowing at some speed to actually exit the membrane. However, if Bernoulli's principle, see Equation (4), is applied and no losses are considered, it can be seen that the term associated with the upstream velocity is insignificant because the pressure difference is so large for reverse osmosis, which uses pressures as high as
70 bar to desalinate seawater [30].
1
1
- pV2 + pgz1+P =-pV2 +pg+P, (4)
2 2
In Equation (4), State 1 is just upstream of the nozzle entrance and State 0 is at the nozzle exit. Just downstream of the nozzle exit, P0 is equal to atmospheric pressure. In this model, it is also
assumed there is no change in pressure head (z is constant). Using all of the assumptions mentioned, Bernoulli's equation simplifies to:
P=4 !pV2+ P
(5)
A final assumption is that jet divergence will be neglected until the motion of the wheel is
considered. This simplifying assumption is necessary in order to make some key assumptions
when the Pelton wheel fundamentals are examined. While the nozzle can be simply modeled
using only Bernoulli's principle, a realistic model incorporating both nozzle design and valve
operation requires more in depth mathematical analysis, which is presented in this thesis.
The objective of this model is to clearly identify the effects of pressure and flow on nozzle
efficiency. Two factors account for the major losses in efficiency when considering solely the
flow through the nozzle. The first factor is the nozzle design. Any nozzle will have a discharge
coefficient specific to its design and flow parameters; the discharge coefficient accounts for the
reduction in flow area related to the pressure and flow through the nozzle (see Equation (2)).
The International Organization of Standards has compiled formulas for discharge coefficients
relating to different nozzle types [31]. A converging conical nozzle can be thought of as a
venturi meter without the diverging section. The discharge coefficient can be calculated by:
Cd
=0.9858-0.196(fl)
4 5(6)
and is dependent on the ratio of the nozzle entrance diameter to the nozzle exit diameter (ratio
f)
[31]. This equation is valid when the Reynolds number for the flow is 1.5 x
105< ReD <2.0 x10⁶. The Reynolds number is a non-dimensional parameter that characterizes the turbulence of a
given flow, and for pipe flow can be calculated by:
Chapter 3: Conceptual and Analytical Development
37
DV
Re = (7)
V
where D is the diameter of the pipe, V is the velocity of the fluid, and v is the fluid's kinematic viscosity. The Reynolds numbers of the flow through the nozzle considered in this work fall in the relevant range, so this correlation is applicable.
Equation (2) also shows that pressure is dependent on the area at the exit of the nozzle (AN). Due to the use of the needle valve, AN is the effective exit area of the nozzle. This effective area
is calculated using the diameter dN:
dN 4d N= v(8)2
where d0 is the machined diameter at the nozzle exit and d, is the diameter of the valve at the
nozzle exit plane (see Figure 3-3).
Therefore, the effective area at the nozzle exit plane is given by:
AN =-(d~ d) (9)
4
With the effective nozzle exit area (AN) known and the flow defined (QN), it is possible to calculate the theoretical jet velocity leaving the nozzle using:
V =
AN
(10)
The second factor that significantly affects the nozzle efficiency is the valve position in the nozzle. Valve losses are considered "minor losses" when evaluating pipe flow in fluid mechanics, which can be deceiving since the needle valve position has a major affect on the overall nozzle efficiency in this work. The energy loss due to the valve can be calculated in the form of a pressure loss (see Equation (3)) and is dependent on the valve resistance coefficient, Ky. Furthermore, the valve resistance coefficient is dependent on the valve position (i.e. how
much of the needle is protruding through the nozzle exit). The ratio, x, between the actual nozzle exit area (AN) and the available nozzle exit area (A,) is used to calculate the valve resistance coefficient, Ky.
_AN d'
__ N
A, d (11)
The relationship between the area ration and valve flow resistance coefficient is:
K, = 2.225x4 -6.674x 3 +7.485x 2 - 3.800x+0.7634
(12) This correlation for the resistance coefficient of a needle valve was developed based on
correlations for other valve types [28]. The needle valve is assumed to be more efficient than ball and globe valves due to its converging design used to throttle the flow.
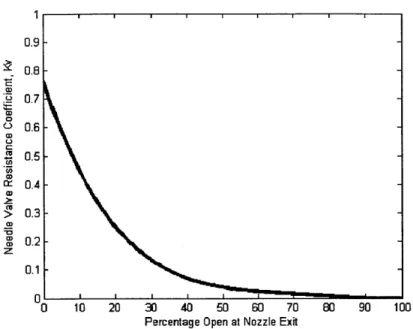
The flow resistance decreases exponentially as more of the nozzle exit area is opened. Figure 3-4 shows the relationship between the valve flow resistance coefficient and the percentage of the nozzle exit area that is open. The figure shows that the valve losses are most significant when the valve is positioned so that the effective nozzle area is less than 30% of the original nozzle exit area. These losses are important to understand because they contribute to the overall efficiency of the nozzle.
Chapter 3: Conceptual and Analytical Development 39
0.9- 0.8-0.7 0.6 0.5-0.4 -cc > 0.3 -a 0.2-z 0.1 -0 ' 0 10 20 30 40 50 60 70 80 90 100
Percentage Open at Nozzle Exit
Figure 3-4: Variation of needle valve resistance coefficient vs. Percentage of nozzle open at its exit plane
In order to maintain a constant pressure upstream of the nozzle at various flows for a given converging nozzle design, the relationship between flow rate and the ratio x is shown in Figure
3-5. The ratio x is equal to 1 when the nozzle is 100% open.
100 90 80 70 3: 0-LOL60 50 0
~30
20 10 O 10 20 30 40 50 60 70 80 90 100Percentage Open at Nozzle Exit
Figure 3-5: Flow rate variation with changing nozzle opening at exit
In a complete PVRO system model, the valve is positioned based on the flow of the brine stream in order to control both the pressure upstream (in the membrane), and the velocity of the jet exiting the nozzle to operate the Pelton wheel at an optimal speed. By controlling the pressure in the membrane, the needle valve can actively control the recovery ratio of clean water to feed water and optimize the overall PVRO system performance, which is the end goal of the work presented in this thesis. A needle valve is effective at varying flow, but it does have associated losses which are most significant when the valve is almost closed; the losses are minimized when the valve is not being utilized to vary the brine flow. The valve losses are quantified in terms of pressure losses, APV, presented earlier in this chapter (see Equation (3)). This pressure loss can be easily translated into efficiency losses as the brine flows through the nozzle. The nozzle efficiency is calculated in terms of power:
Power out
= Power in (13)
The Power out term is the power in the high velocity fluid jet exiting the nozzle:
1 21
Power out = -rhV (Cd -K, )=-pQNV (d-K,) (14)
2 J V 2 V
where p is the fluid density, QN is the flow through the nozzle, V is the jet velocity when exiting the nozzle, Cd is the discharge coefficient of the nozzle and K, is the valve resistance coefficient. The Power in term is the power in the high pressure fluid upstream of the nozzle, exiting the reverse osmosis membrane as high pressure brine, given by:
Power in = PQi (15)
where P is the pressure of the brine exiting the membrane and
Q,
is the brine flow rate. The nozzle efficiency is then calculated using:Chapter 3: Conceptual and Analytical Development 41
--pONV2 ( C - K, )
1N
7= 2
P
2 (d 'J (16)Because the brine is assumed to be incompressible in this model (i.e. QI=QN), Equation (16) can be further simplified to yield the overall nozzle efficiency:
pV (C
-K)
(17)
ilN
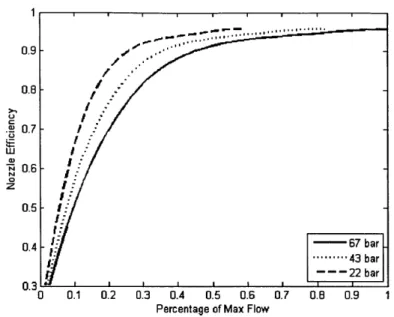
It can be seen from Equation (17) that the nozzle efficiency is dependent on the pressure of the incoming flow and on the nozzle discharge and valve resistance coefficients. The discharge coefficient depends on the design of the nozzle, and the valve resistance coefficient depends on the valve position within the nozzle. The effects of varying flow rate through the nozzle and upstream pressure are shown in Figure 3-6. The efficiency is plotted against the percentage of maximum flow for a given nozzle design fitting a specific size of PVRO system. Specific flow rates for the target application are considered in Chapter 4, which describes the process and results of experimentally validating this analytical model.
The variation in efficiency with respect to pressure can also be seen in Figure 3-6. The pressures were chosen based on RO system operating characteristics. Most commercially available reverse osmosis membranes are rated for a maximum pressure of 70 bar. There is a small pressure drop
across the membrane, resulting in a brine pressure slightly below the inlet pressure. A typical value of 67 bar was chosen for evaluation. At the other end of the spectrum, the osmotic pressure of average ocean salt water (at 36,000 ppm) is roughly 26 bar; an RO system operated below this pressure will not produce any water [32]. In order to account for operating conditions for brackish input water, the 22 bar case was evaluated. The third pressure evaluated was 43 bar; this was an intermediate pressure which would occur during transient system operation.
/ >1I L)f .1 0.7 -
-~0.6
, 0.4 - 1: 67 bar ... 43 bar --- 22 bar 0.3 0 0.1 0.2 0.3 0.4 0.5 0.6 0.7 0.8 0.9 1Percentage of Max Flow
Figure 3-6: Nozzle efficiency variation with changing pressure and flow rate
It is clear that the nozzle itself has the potential to be very efficient at converting the energy in the high pressure brine into a high velocity jet which can be utilized to move a Pelton wheel. However, the system parameters (max flow, pressure) must be identified and the nozzle designed accordingly for the nozzle to be most efficient. For example, if a system was to run primarily at
67 bar and 90% of its max flow, then the nozzle should be designed such that the valve is not
utilized at these given parameters so that the losses are minimized.
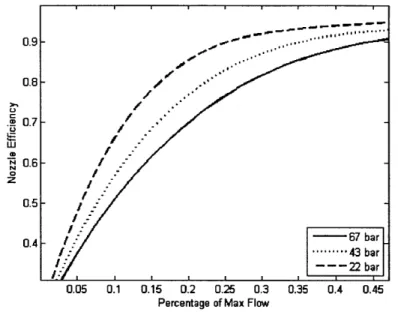
Figure 3-7 is a close up of the plot in the region where the rate of efficiency change with respect to flow rate is largest. This characteristic is of particular interest during design, as it is important to ensure the system normally operates in a region of high efficiency. It is also important that the model accurately describes the behavior of the nozzle in this region, especially when the
efficiency is going to be changing most drastically. Ideal system operatation is when the brine flow rate is at a maximum. However, when the system's incoming power decreases, the feed water flow rate will also decrease, therefore decreasing the brine flow rate unless the recovery ratio is varied appropriately. The model predicts that a drop in brine flow rate will not affect the
efficiency of the nozzle significantly until the flow rate drops below roughly 45% of its maximum design flow. Above this limit, the nozzle efficiency can be as high as 96% for the pressures expected to be seen in a brine stream exiting an RO membrane. The region of changing efficiency for the nozzle shown in Figure 3-7 will be explored in Chapter 4 with experimental data. 0.9- 0.8- /..-z .6--0.5- -0.4 - - 67 bar ...''43 bar --- 22 bar 0.05 0.1 0.15 0.2 0.25 0.3 0.35 0.4 0.45 Percentage of Max Flow
Figure 3-7: Close up view of region of most efficiency variation with flow rate
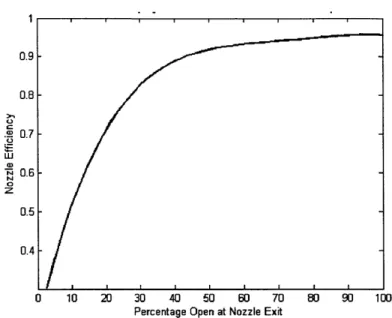
Figure 3-8 shows the effect of varying the nozzle exit area on nozzle efficiency (at a constant pressure of 67 bar). For this case, the water flow varies with nozzle area. These results are for a perfectly designed nozzle, where the maximum flow rate would be achieved when the nozzle is at its highest pressure and 100% open at the nozzle exit.
Chapter 3: Conceptual and Analytical Development 44
0.9- 0.8-0. -7 S0.6-Z 0.5 0.4-U 10 20 30 40 50 60 70 80 90 1U0 Percentage Open at Nozzle Exit
Figure 3-8: Effect of varying nozzle exit are on nozzle efficiency
3.3
Pelton Bucket Analytical Model
The second major component model presented in this chapter is the Pelton bucket. The model describes the flow of water through the Pelton bucket's internal surface and the momentum transfer between the water and the bucket. Some key assumptions are made in order to simplify the model. Again, the brine flow is assumed to be incompressible; the flow considered here is all in the form of a high velocity jet at atmospheric pressure (downstream of the nozzle). The second assumption is that flow over the surface of the bucket can be modeled as inviscid flow over a semi-infinite surface with characteristic length equal to the inside curvature of a given Pelton bucket. It will also be assumed that the water is split perfectly by the splitter ridge of the bucket; i.e. flow on both sides of the bucket is identical. A labeled cross section of a Pelton bucket is shown in Figure 3-9. V is the jet of fluid exiting the nozzle; this jet hits the Pelton bucket at the tip of the splitter ridge, which splits the flow equally between the two sides of the bucket. The V2vectors represent the redirected flow exiting the Pelton bucket. Theoretically, if
![Figure 1-2: Salinity variation by location - Mediterranean and South Asia [6]](https://thumb-eu.123doks.com/thumbv2/123doknet/14683944.559821/17.918.74.827.408.798/figure-salinity-variation-location-mediterranean-south-asia.webp)
![Figure 1-3: Salinity variation by time of year (single location) [7]](https://thumb-eu.123doks.com/thumbv2/123doknet/14683944.559821/18.918.290.614.128.441/figure-salinity-variation-time-year-single-location.webp)
![Figure 2-1: Comparison of differential pressure requirement for various purification methods [9], [10]](https://thumb-eu.123doks.com/thumbv2/123doknet/14683944.559821/22.918.141.753.154.558/figure-comparison-differential-pressure-requirement-various-purification-methods.webp)

![Figure 2-7: Setup with high pressure pump in parallel configuration with Clark Pump [20]](https://thumb-eu.123doks.com/thumbv2/123doknet/14683944.559821/28.918.204.740.135.445/figure-setup-high-pressure-parallel-configuration-clark-pump.webp)