HAL Id: hal-00318088
https://hal.archives-ouvertes.fr/hal-00318088
Submitted on 23 Dec 2005
HAL is a multi-disciplinary open access
archive for the deposit and dissemination of
sci-entific research documents, whether they are
pub-lished or not. The documents may come from
teaching and research institutions in France or
abroad, or from public or private research centers.
L’archive ouverte pluridisciplinaire HAL, est
destinée au dépôt et à la diffusion de documents
scientifiques de niveau recherche, publiés ou non,
émanant des établissements d’enseignement et de
recherche français ou étrangers, des laboratoires
publics ou privés.
Daily ionospheric forecasting service (DIFS) III
N. Butcher
To cite this version:
N. Butcher. Daily ionospheric forecasting service (DIFS) III. Annales Geophysicae, European
Geo-sciences Union, 2005, 23 (12), pp.3591-3598. �hal-00318088�
Annales Geophysicae, 23, 3591–3598, 2005 SRef-ID: 1432-0576/ag/2005-23-3591 © European Geosciences Union 2005
Annales
Geophysicae
Daily ionospheric forecasting service (DIFS) III
N. Butcher
BAE SYSTEMS, Advanced Technology Centre (ATC), Great Baddow, Chelmsford, Essex, CM2 8HN, UK
Received: 25 February 2005 – Revised: 27 June 2005 – Accepted: 20 August 2005 – Published: 23 December 2005
Abstract. The daily variability of the ionosphere can greatly
affect HF or SATCOM communications. HF skywave oper-ators plan frequency schedules months in advance, however, they also require daily knowledge of the ionospheric condi-tions in order to modify assignments. SATCOM operators also require daily information about the levels of scintilla-tion, which are variations in phase, amplitude, polarisation and angle of arrival that can cause severe degradation of the received signal.
Using a number of ionosonde measurements and geomag-netic and solar values, a Daily Ionospheric Forecasting Ser-vice (DIFS) has been developed, which provides HF and SATCOM operators with daily forecasts of predicted iono-spheric conditions. The system uses in-house algorithms and an externally developed Global Ionospheric Scintilla-tion Model (GISM) to generate HF and SATCOM forecasts. HF forecasts consist of a past summary and a forecast sec-tion, primarily displaying observed values and predicted cat-egories for the Maximum Usable Frequency (MUF), as well as an Ionospheric Correction factor (ICF) that can be fed into the ionospheric propagation prediction tool, WinHF. SAT-COM forecasts give predictions of global scintillation levels, for the polar, mid and equatorial latitude regions. Thorough analysis was carried out on DIFS and the results conclude that the service gives good accuracy, with user feedback also confirming this, as well.
Keywords. Ionosphere (Ionospheric disturbances;
Mod-elling and forecasting) – Radio science (Radio-wave prop-agation)
1 Introduction
This paper describes the development of a Daily Ionospheric Forecasting System (DIFS) that may be used to enhance the planning and operation of HF and satellite communication
Correspondence to: N. Wheadon
systems. The work was carried out under the ESA Pilot Project for Space Weather Applications. BAE Systems ATC is a member of one of the co-funded Service Development Activity (SDA) groups on this project; it is a member of the SWENET group, and it was one of first SDA groups to suc-cessfully integrate their service with the SWENET.
1.1 HF communications
The F2-layer of the ionosphere is the most important for HF radio communications due to its constant presence, its high altitude, which allows for longer communication paths, and the fact that it usually refracts the highest frequencies in the HF range (Davies, 1990). However the day-to-day variabil-ity of the critical frequencies (foF2) is unpredictable, with a 20% variability about the monthly median (CCIR, 1990) and greater than 40% variability during ionospheric storms. This directly affects the HF communications by altering the Max-imum Usable Frequency (MUF). This is the frequency limit, where radio waves above will not be refracted back down to Earth and therefore cannot be used for HF communications.
For HF skywave operators’ frequency schedules are very important, and are planned several months in advance. Prop-agation prediction tools are used to assign frequencies based on the analysis of expected normal conditions, and with addi-tional assignments to cover ionospheric storms. On a day-to-day basis a user must cope with the normal variations which will affect the frequency and the prediction of storms and ionospheric disturbances. WinHF is one such HF propaga-tion forecast modelling tool, based on cyclic space weather trends, diurnal, seasonal and geographic information and the ITU-R REC533 algorithms (ITU-R 2001), which helps to es-tablish and maintain good communications. It may be fed with daily inputs of ionospheric correction factors, obtained from the Daily Ionospheric Forecast Service (DIFS), which thereby modifies the model on a daily basis, to take into ac-count current ionospheric conditions.
Figure 1 shows a propagation prediction graph for me-dian conditions. The graph shows the predicted operating
3592 N. Butcher: Daily ionospheric forecasting service (DIFS) III 1 Introduction
This paper describes the development of a Daily Ionospheric Forecasting System (DIFS) that may be used to enhance the planning and operation of HF and satellite communication systems. The work was carried out under the ESA Pilot Project for Space Weather Applications. BAE Systems ATC is a member of one of the co-funded Service Development Activity (SDA) groups on this project, it is a member of the SWENET group, and it was one of first SDA groups to successfully integrate their service with the SWENET.
1.1 HF Communications
TheF layer of the ionosphere is the most 2 important for HF radio communications due to its constant presence, its high altitude which allows for longer communication paths and the fact that it usually refracts the highest frequencies in the HF range (Davies 1990). However the day-to-day variability of the critical frequencies (foF2) is unpredictable, with a 20% variability about the monthly median (CCIR 1990) and greater than 40% variability during ionospheric storms. This directly affects the HF communications by altering the
Maximum Usable Frequency (MUF). This is the frequency limit, which radiowaves above will not be refracted back down to earth and therefore cannot be used for HF communications.
For HF skywave operators frequency schedules are very important, and are planned several months in advance. Propagation prediction tools are used to assign frequencies based on analysis of expected normal conditions, and with additional assignments to cover ionospheric storms. On a day-to-day basis a user must cope with the normal variations which will affect the frequency and the prediction of storms and ionospheric disturbances.
WinHF is one such HF propagation forecast modelling tool, based on cyclic space weather trends, diurnal, seasonal and geographic information and the ITU-R REC533 algorithms (ITU-R 2001), which helps to establish and maintain good communications. It may be fed with daily inputs of ionospheric correction factors, obtained from the Daily Ionospheric Forecast Service (DIFS), which thereby modifies the model on a daily basis to take into account current ionospheric conditions.
Fig 1-1 - Channel Assignment for Median Conditions (a)
Fig 1-2 - Channel Assignment for Storm Conditions Fig 1-1 shows a propagation prediction graph
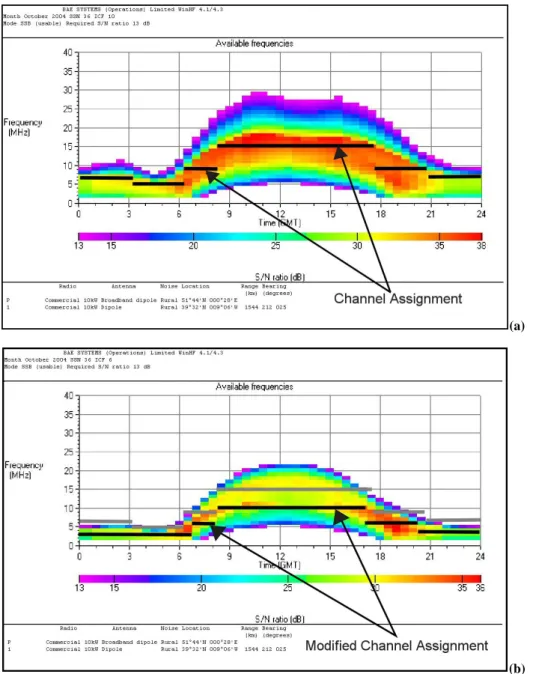
for median conditions. The graph shows the predicted operating frequency as a function of time of day for a point-to-point link with specific equipment and location parameters. The coloured region shows the predicted operating frequency window for the grade of service (mode) required, in this case Single Side Band (SSB). The colour scale represents the S/N ratio expected on this link. Red corresponds to the highest S/N ratio and is therefore the most desirable, whilst purple represents the lowest S/N ratio that will make the circuit viable. The black lines show the frequencies allocated for the different time periods.
In storm conditions the range of usable frequencies will decrease and therefore the channel assignments must be modified to take account of this, as shown in Fig 1-2. This is achieved by forecasting the ionospheric conditions and calculating an ionospheric correction factor (ICF) see section 2, which can then be input into WinHF.
1.2 SATCOM
A radio signal which is traversing the ionosphere will be modified by irregularities in the electron density. The irregularities cause scintillations, which are variations of phase, amplitude, polarisation and angle of arrival. These variations have adverse affects on satellite communications and cause amplitude fading, where the signal becomes buried in noise when the fade depth exceeds the fade margin of the receiver (Davies 1990). Peak scintillation activity occurs in equatorial latitudes from post sunset to midnight and in auroral latitudes from post midnight to early morning. In some cases fading depths can exceed 20dB, when a signal is traversing the peaks of the equatorial anomaly in the early evening (McNamara 1991).
2 Forecasting
HF Forecasting can inform an operator of the day-to-day ionospheric conditions and provide them with an Ionospheric Correction Factor (ICF). The ICF is a scaling factor which is calculated using the percentage deviations over the last 24 hours of foF2 from the median
(b) Fig. 1. (a) Channel assignment for median conditions; (b) Channel assignment for storm conditions.
frequency as a function of time of day for a point-to-point link with specific equipment and location parameters. The coloured region shows the predicted operating frequency window for the grade of service (mode) required, in this case, the Single Side Band (SSB). The colour scale represents the S/N ratio expected on this link. Red corresponds to the high-est S/N ratio and is therefore the most desirable, whilst purple represents the lowest S/N ratio that will make the circuit vi-able. The black lines show the frequencies allocated for the different time periods.
Under storm conditions the range of usable frequencies will decrease and therefore the channel assignments must be modified to take this into account, as shown in Fig. 1b. This is achieved by forecasting the ionospheric conditions and cal-culating an ionospheric correction factor (ICF) (see Sect. 2), which can then be input into WinHF.
1.2 SATCOM
A radio signal which is traversing the ionosphere will be modified by irregularities in the electron density. The irreg-ularities cause scintillations, which are variations of phase, amplitude, polarisation and angle of arrival. These variations have adverse affects on satellite communications and cause amplitude fading, where the signal becomes buried in noise when the fade depth exceeds the fade margin of the receiver (Davies, 1990). Peak scintillation activity occurs in equato-rial latitudes from post-sunset to midnight and in auroral lat-itudes from post-midnight to early morning. In some cases fading depths can exceed 20 dB, when a signal is traversing the peaks of the equatorial anomaly in the early evening (Mc-Namara, 1991).
N. Butcher: Daily ionospheric forecasting service (DIFS) III 3593 values. It indicates the daily ionospheric
conditions and can be used in WinHF, a propagation prediction tool, to scale assigned frequencies. Under normal conditions the value of the ICF is defined to be 10, in geomagnetic storms this can drop to as low as 6 or in very good conditions can be as much as 14.
A SATCOM operator is also interested in a day-to-day overview of the ionospheric conditions, and forecasts can provide informative global categorisations.
3 The System
BAE Systems ATC has been providing an HF prediction service for many years. From mid 1970s to 1988 it supplied an HF skywave prediction service which was manually generated; between 1989 to 1991 it developed the world's first automated Daily Ionospheric Forecasting Service (DIFS); during 1990s an HF propagation prediction tool was developed (WinHF) with HF frequency assignment algorithms; from 2000 to present the HF propagation prediction applications and DIFS were enhanced.
The current version of DIFS v3.5 has been enhanced to provide a flexible, multi-regional, automated forecasting service. The previous version could only generate a single daily HF forecast for Western Europe and used a limited number of data sources to compile the forecast. Through a complete redesign of the database and User Interface, the functionality of the system has now increased to support more flexible data importing and exporting; the generation of SATCOM forecasts; more accurate, globally dispersed HF forecasts; multiple forecasts, both at 24 and 6 hourly intervals, at any time; and the incorporation of deployable ionospheric sounder data into HF forecasts.
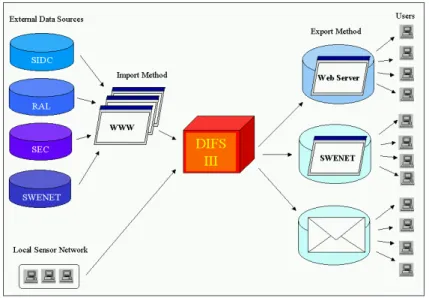
A high-level view of the system can be seen in Fig 3-1. Data are imported into the DIFS database via FTP from web servers such as the Solar Influences Data analysis Centre (SIDC), Space Environment Centre (SEC), Rutherford Appleton Laboratory (RAL) and the ESA Space Weather European Network (SWENET) and also transferred across the LAN from local sensors.
Fig 3-1 -High Level View of DIFS System
Fig. 2. Scatter plot showing ICF comparison from 14 October 2004 to 1 February 2005.
2 Forecasting
HF Forecasting can inform an operator of the day-to-day ionospheric conditions and provide them with an Ionospheric Correction Factor (ICF). The ICF is a scaling factor which is calculated using the percentage deviations over the last 24 h of foF2 from the median values. It indicates the daily iono-spheric conditions and can be used in WinHF, a propagation prediction tool, to scale assigned frequencies. Under normal conditions the value of the ICF is defined to be 10, in geo-magnetic storms this can drop to as low as 6 or in very good conditions it can be as much as 14.
A SATCOM operator is also interested in a day-to-day overview of the ionospheric conditions, and forecasts can provide informative global categorisations.
3 The system
BAE Systems ATC has been providing an HF prediction ser-vice for many years. From the mid 1970s to 1988 it supplied an HF skywave prediction service which was manually gen-erated; between 1989 to 1991 it developed the world’s first automated Daily Ionospheric Forecasting Service (DIFS); during the 1990s, an HF propagation prediction tool was de-veloped (WinHF) with HF frequency assignment algorithms; from 2000 to present the HF propagation prediction applica-tions and DIFS were enhanced.
The current version of DIFS v3.5 has been enhanced to provide a flexible, multi-regional, automated forecasting ser-vice. The previous version could only generate a single daily HF forecast for Western Europe and used a limited number of data sources to compile the forecast. Through a complete redesign of the database and user interface, the functional-ity of the system has now increased to support more flexible data importing and exporting; the generation of SATCOM forecasts; more accurate, globally dispersed HF forecasts;
multiple forecasts, both at 24- and 6-h intervals, at any time; and the incorporation of deployable ionospheric sounder data into HF forecasts.
A high-level view of the system can be seen in Fig. 2. Data are imported into the DIFS database via FTP from web servers, such as the Solar Influences Data analysis Centre (SIDC), Space Environment Centre (SEC), Rutherford Ap-pleton Laboratory (RAL) and the ESA Space Weather Eu-ropean Network (SWENET) and also transferred across the LAN from local sensors.
When a forecast is generated, the relevant data are pulled from the DIFS database and processed through algorithms. Most of these have been developed in-house, though some were created from external applications like the Global Iono-spheric Scintillation Model (GISM) (Beniguel, 2004) (see Sect. 4.2). The forecast is then exported to the required users through email or via FTP onto servers, where it can be viewed though web portals.
4 Database and algorithms
The following lists the principal data types currently being stored in the DIFS database:
– foF2 critical values – from many different stations and
sources:
– IPS Australia (http://www.ips.gov.au) – RAL (http://www.wdc.rl.ac.uk) – SEC (http://sec.noaa.gov)
– ITEC (Integrated Total Electron Content) – from many
different stations from SEC (http://sec.noaa.gov)
– Space Environment Services Centre (SESC) daily
Sunspot number index – SIDC RWC-Belgium (http: //sidc.oma.be/products/xut/index.php3)
3594 N. Butcher: Daily ionospheric forecasting service (DIFS) III
– 10.7 cm radio flux – SIDC RWC-Belgium (http://sidc.
oma.be/products/xut/index.php3)
– Geomagnetic A Index – SIDC RWC-Belgium (http://
sidc.oma.be/products/xut/index.php3)
– Monthly mean international relative sunspot
num-ber – ITU (http://www.itu.int/ITU-R/study-groups/ rsg3/indices/index.html)
– Number of sunspot groups of each type (quiet, eruptive,
active and proton) – SIDC RWC-Boulder (http://sidc. oma.be/products/geo/index.php3)
– Sudden Storm Commencement’s (SSC) start time –
SIDC Wingst (Germany) (http://sidc.oma.be/products/ wng/index.php3)
– X-ray flares class, start time, end time, region of the Sun
and X and Y co-ordinates – SEC RWC-Boulder (http: //sidc.oma.be/products/geo/index.php3)
– Ionospheric absorption, type of phenomena, type of
measurement, start time, maximum of event, end time, and number of decibels of maximum absorption – SIDC RWC Moscow (http://sidc.oma.be/products/mos/index. php3)
– 3-day predicted AP index – SIDC RWC-Belgium (http:
//sidc.oma.be/products/xut/index.php3)
– K indices – SIDC RWC-Belgium (http://sidc.oma.be/
products/xut/index.php3) 4.1 HF algorithms
The algorithms (Wheadon et al., 1991a) which generate the HF forecasts use many of the data types that are stored in the database. Below is a description of the primary modules which are involved in creating an HF forecast.
Calculate MUF
This module determines the range of observed MUF vari-ations in the past summary section of the forecast. It does this through calculating the percentage deviations of the last 24 h of foF2 data from the median foF2 data. It then deter-mines the overall MUF condition for each period, based on a set of thresholds, where UP, NORMAL and DOWN indi-cate whether the frequencies are going to be greater than, the same as or less than the median conditions (Wheadon et al., 1991b).
Calculate ICF
This module determines the Ionospheric Correction Factor (ICF) using calculations involving the foF2 percentage devi-ations (which were generated in the Calculate MUF module) (Wheadon et al., 1991b).
MUF forecast
This module calculates the forecast MUF category for each period, based on the observed MUF conditions. These are translated to a score and modified to take into account the occurrence of cyclic solar effects, SSCs, very high or low
SSN and 10 cm flux deviations, X-ray flares and geomagnetic Apand K indices.
After the forecast ICF has been determined, this module also checks for consistency between the forecast MUF and ICF values. If they are inconsistent, it alters the MUF score and re-calculates the forecast MUFs.
ICF forecast
In this module the forecast ICF is computed, based on the observed ICF. These are then modified to take into account the occurrence of cyclic solar effects, SSC, X-ray flares and geomagnetic Ap and K indices.
LUF forecast
This module determines the LUF based on the sum of the Kindices for the day before the forecast, the current month number and any strong absorption events that may have oc-curred.
4.2 SATCOM algorithms
The functionality to create a SATCOM forecast is all con-tained within the SATCOM Interface module. This makes use of a Global Ionospheric Scintillation Model (GISM), a program which has been developed by IEEA under contract with ESA (Beniguel, 2004). The GISM model’s scintillation occurs in the ionosphere due to solar activity. It is composed of two models, one providing the mean errors, based on a so-lution of ray tracing equations, and the second model (the fo-cus of this report) which is based on a multiple phase screen (MPS) technique and provides estimates of the signal scin-tillations (S4), which is the root-mean-square of the power P divided by the average power ¯P (see equation below):
S4=
[P (P − ¯P )2] 1 2
¯
P (Briggs and Parkin, 1963). The GISM takes several input parameters, including the geophysical parameters (solar 10-cm flux and date), the op-erating or carrier frequency and the inhomogeneity data (a measure of the irregularity structure of the electron density). Statistical characteristics, such as scintillation index, fade du-ration, and cumulative probability of the signal, are provided from the GISM, as well as maps of scintillation index S4.
For the purposes of DIFS a scintillation chart was devel-oped from numerous GISM trials. Each trial generated the scintillation at each point on a global map, from −90◦to 90◦ latitude, in steps of 5◦and from −180◦to 180◦longitude, in steps of 15◦(which corresponds to each hour LT). The UT was set to 00:00 h and the frequency to 400 MHz. Only the month and the 10-cm flux parameters were altered for each trial, to provide a data reference set for which any values in-between could be interpolated.
The results obtained were S4 values for 37 different lat-itudes and 25 longlat-itudes (which corresponded to 12:00– 12:00 LT), for every month, for each 10 cm flux value (80, 120 and 190). The data from predominant latitudes were grouped into high, mid or low categories, where:
N. Butcher: Daily ionospheric forecasting service (DIFS) III 3595 each month and 10cm flux value and placed in
the spreadsheet.
The SATCOM forecast predicts the disturbance categories for the next 24 hours, split into four 6 hourly time periods. Extensive evaluation of GISM showed that the scintillation levels exceed the Quiet category only between LT 2000 to 0300 hours. This is consistent with observations, as most equatorial scintillation occurs during the night. Unfortunately the GISM has some limitations for auroral regions, however this is not the users’ primary area of interest therefore for this work it is of secondary importance. As the scintillation levels only exceeds the Quiet category between LT 2000 to 0300 hours, only two of the 6 hourly time periods are affected by the scintillation chart and forecast any category other than Quiet. A 24-hour forecast however is supplied for the users’ benefit.
The process of calculating the SATCOM forecast is as follows:
Predicting Disturbance Categories
• Calculate the estimated monthly 10cm flux value from the monthly mean international relative Sunspot number.
• Collect the observed daily 10cm flux value for the forecast date.
• Extract all the data from the GISM scintillation spreadsheet for the specified month and nearest two flux values.
• Using either the observed daily flux value or if not available the estimated monthly flux, interpolate the scintillation chart to give a map of best estimate of current S4 values.
• Classify the values into categories Quiet (S4≤0.25), Moderate (0.25>S4≤0.5),
Disturbed (0.5>S4≤1), or Severe (S4>1).
Fig 4-1 -HF Forecast for 24th January 2005
BAE SYSTEMS ADVANCED TECHNOLOGY CENTRE DAILY IONOSPHERIC FORECAST
===================================== Mid Latitude Forecast 11:30 CONTACT: NIGEL WHEADON TEL: 01245 242143 REGION (90N-90S 180W-180E)
FORECAST ISSUED 12:00UT : 25 Jan 2005 PAST SUMMARY 11-11 UT 24 Jan-25 Jan =====================
HF SKYWAVE MUF VARIATIONS
UT 11-17 17-23 23-05 05-11 MUFs 110-130 100-135 90-115 90-120 Past ICF 12 11 10 11 Past 24 Hour ICF : 11
DAYTIME LUF : NORMAL POSSIBLE SHORTWAVE FADES : NONE A (24 Jan) : 6 (ACTIVE TO QUIET) SUNSPOT NUMBER INDEX : NO DATA 10 CM FLUX VALUE (23 Jan) : 96
NORMAL HF RADIO CONDITIONS PREVAILED FOR THE PAST 24 HOURS. FORECAST 11:00-11:00 UT, 25 Jan-26 Jan
======================
UT 11-17 17-23 23-05 05-11 MUFs UP NORMAL NORMAL NORMAL ICF 12 11 10 11 DAYTIME LUF : NORMAL SWF PROBABILITY : 3 PERCENT GEOMAGNETIC ACTIVITY : 24-26 Jan A = 11/11/8 (UNSETTLED) 24 HOUR ICF: 11
GOOD HF RADIO CONDITIONS ARE EXPECTED UNTIL 17:00 WITH SLIGHT DETERIORATION LATER. ---Daily Ionospheric Forecasting Service (DIFS)----
BAE SYSTEMS Advanced Technology Systems, Gt Baddow, Chelmsford, Essex, UK, CM2 8HN Tel: +44 1245 242143
(a)
Fig 4-2 - SATCOM Forecast for 10th January 2005
Supplementary Geomagnetic Data
•
Collect the extra geomagnetic data which
will be displayed on the SATCOM forecast.
5 The DIFS Service
DIFS is an automated system which is capable
of generating multi-regional, frequent (6-hourly
and 24-hourly) forecasts for different users.
5.1 HF Service
HF Forecasts, see Fig 4-1, are made up of two
parts, the Past Summary which covers the
period of the last 24-hours and the Forecast
which looks at the next 24-hours. The Past
summary comprises 6-hourly observed
Maximum Usable Frequency (MUF) ranges,
6-hourly ICF, 24-hour ICF, observed daytime
Lowest Usable Frequency (LUF), the times of
possible Short-wave Fades (SWF), observed A
Index, observed daily Sunspot Number Index
(SSN), observed 10cm flux value and some free
text describing the past conditions. The Forecast
contains the 6 hourly predicted MUF categories
DOWN, NORMAL or UP, the predicted 6
hourly ICFs, the predicted 24 hour ICF, the
predicted daytime LUF, the SWF probability,
the 3 day predicted AP Indices and some free
text describing the predicted conditions
5.2 SATCOM Service
The SATCOM forecast, see Fig 4-2 comprises
categories QUIET (Low probability of fading
expected on SATCOM Circuits), MODERATE
(Moderate fading possible on circuits),
DISTURBED (Reasonably high fading probable
on circuits), or SEVERE (High probability of
outages) for 6-hourly periods, for the polar, mid
and equatorial regions. The categories indicate
the global conditions of scintillation, and other
geomagnetic data such as the A index and Kp
indices are shown to support the forecast.
6 ValidationThe results presented in this section are from an
initial semi-quantitative analysis of the accuracy
of the forecasts over a 2 month (for MUF
analysis), 3 1/2 month (for ICF analysis) and 1
week (for SATCOM analysis) period. Further
work will be needed over a longer period and
for a variety of different ionospheric conditions
to establish the metrics.
DAILY SATCOM IONOSPHERIC FORECAST
===================================== SATCOM Forecast 12:00
CONTACT: NIGEL WHEADON TEL: +44 (0) 1245 242143
FORECAST ISSUED AT 09:47UT : 25 Jan 2005
FORECAST FOR 12:0UT : 15/11/2004
15 Nov 16 Nov LT 12-18 18-00 0-6 6-12 Polar Q D D Q Mid Q Q Q Q Equator Q S S Q
Q - Quiet. Low probability of fading expected on SATCOM Circuits M - Moderate. Moderate fading possible on circuits
D - Disturbed. Reasonably high fading probable on circuits S - Severe. High probability of outages
K - 3 hourly values (15/11):2 2 3 4 3 4 2 1 (Baddow K) A Index (15/11) : 3 (GEO BOULDER A)
Predicted A Index (15-17):6/4/5
---Daily Ionospheric Forecasting Service(DIFS--- BAE SYSTEMS Advanced Technology Systems, Gt Baddow, Chelmsford, Essex, UK, CM2 8HN Tel: +44 1245 242143
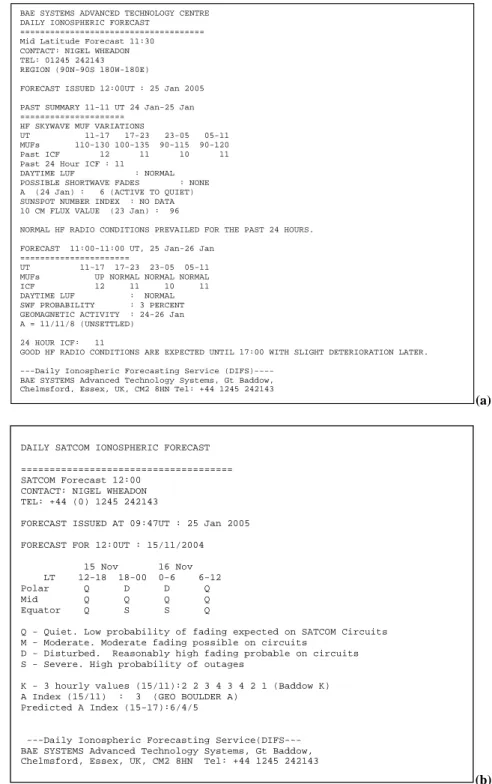
(b) Fig. 3. (a) HF Forecast for 24 January 2005; (b) SATCOM Forecast for 10 January 2005.
– high latitudes were those 70◦ or greater and −70◦ or less;
– low latitudes were those between 25◦and −25◦;
– mid latitudes were those in between the above.
The maximum S4values in each local time period and lat-itude group were identified for each month and 10-cm flux value, and placed in the spreadsheet.
The SATCOM forecast predicts the disturbance categories for the next 24 h, split into four, 6-h time periods. Exten-sive evaluation of GISM showed that the scintillation levels exceed the quiet category only between 20:00 to 03:00 LT. This is consistent with observations, as most equatorial scin-tillation occurs during the night. Unfortunately, the GISM has some limitations for auroral regions, however, this is not the users’ primary area of interest; therefore, for this work it is of secondary importance. As the scintillation levels only
3596 N. Butcher: Daily ionospheric forecasting service (DIFS) III
exceeds the quiet category between 20:00 LT to 03:00 LT, only two of the 6-h time periods are affected by the scintilla-tion chart and forecast any category other than quiet. A 24-h forecast, however, is supplied for the users’ benefit.
The process of calculating the SATCOM forecast is as fol-lows:
Predicting disturbance categories
– Calculate the estimated monthly 10-cm flux value from
the monthly mean international relative sunspot number.
– Collect the observed daily 10-cm flux value for the
fore-cast date.
– Extract all the data from the GISM scintillation
spread-sheet for the specified month and the closest two flux values.
– Using either the observed daily flux value or, if not
available, the estimated monthly flux, interpolate the scintillation chart to give a map of the best estimate of current S4values.
– Classify the values into categories quiet (S4≤0.25), moderate (0.25>S4≤0.5), disturbed (0.5>S4≤1), or se-vere (S4>1).
Supplementary geomagnetic data
– Collect the extra geomagnetic data which will be
dis-played on the SATCOM forecast.
5 The DIFS service
DIFS is an automated system which is capable of generating multi-regional, frequent (6-h and 24-h) forecasts for different users.
5.1 HF service
HF Forecasts (see Fig. 3a) are made up of two parts, the past summary, which covers the period of the last 24-h, and the forecast, which looks at the next 24-h. The past summary comprises 6-h observed Maximum Usable Frequency (MUF) ranges, 6-h ICF, 24-h ICF, observed daytime Lowest Usable Frequency (LUF), the times of possible Short-Wave Fades (SWF), observed A Index, observed daily Sunspot Number Index (SSN), observed 10-cm flux value and some free text describing the past conditions. The forecast contains the 6-h predicted MUF categories DOWN, NORMAL or UP, t6-he predicted 6-h ICFs, the predicted 24-h ICF, the predicted daytime LUF, the SWF probability, the 3-day predicted AP Indices and some free text describing the predicted condi-tions.
5.2 SATCOM service
The SATCOM forecast (see Fig. 3b) comprises categories QUIET (low probability of fading expected on SATCOM Circuits), MODERATE (moderate fading possible on cir-cuits), DISTURBED (reasonably high fading probable on circuits), or SEVERE (high probability of outages) for 6-h periods, for t6-he polar, mid and equatorial regions. T6-he categories indicate the global conditions of scintillation, and other geomagnetic data, such as the A index and Kpindices, are shown to support the forecast.
6 Validation
The results presented in this section are from an initial semi-quantitative analysis of the accuracy of the forecasts over a 2 months (for MUF analysis), 3 1/2 months (for ICF anal-ysis) and a 1-week (for SATCOM analanal-ysis) period. Further work will be needed over a longer period and for a variety of different ionospheric conditions to establish the metrics.
The DIFS application includes a number of quantitative analysis tools which are used to generate results that show the quality and the accuracy of the forecasts. It must be noted that the forecasts are just that, predictions based on an inter-pretation of currently observed effects combined with empir-ical relationships between the observations and the expected effects. Therefore, achieving a perfect forecasting accuracy is unrealistic, however, the establishment of a set of quanti-tative metrics will enable an initial benchmark to be estab-lished against which future improvements to the forecasting services can be compared.
6.1 HF forecast
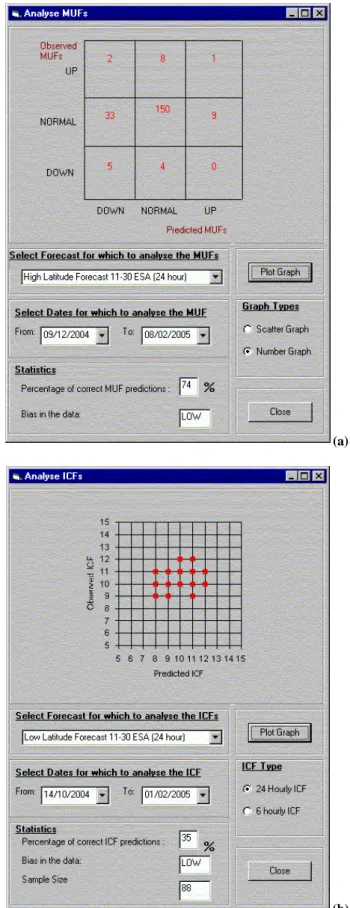
The analysis tool for the HF forecasting part of DIFS in-cludes an MUF analyser and an ICF analyser. The MUF analyser is shown in Fig. 4a. This tool’s output shows the comparison between the forecast values of the MUF devia-tion (deviadevia-tion from the median) and the observed MUF de-viations (derived from the dede-viations of foF2 observations from the median). The analysed data are displayed in a scat-ter diagram and grouped into categories using the definitions for UP, NORMAL and DOWN. The lower part of the anal-yser user interface is used to enter information about which the forecast will be analysed, the period over which metrics will be determined and the type of output report required.
In the example shown in Fig. 4a, the forecasts between 9 December 2004 and 8 February 2005 have been analysed. Ideally, the observed and predicted deviations would coin-cide, for example, if the MUF deviation was predicted to be down, i.e. a deviation greater than 20% below the median value, and the observed MUF deviation was more than 20% below the median value, then an entry would appear in the lower left-hand box on the display. It can be seen that 74% of the observed data lie in the same category as predicted. The percentage of correct MUF predictions appears in the statistics display. The data bias is low, which means that the
N. Butcher: Daily ionospheric forecasting service (DIFS) III 3597
predicted MUF deviations are, on average, lower than the ac-tual data, i.e. the forecasts tend to predict that the MUFs are lower than those observed.
The ICF analyser (Fig. 4b) is used to compare the actual ICF with the ICF distributed with the forecasts. This tool is similar to the MUF analyser in that the ICFs are analysed for a user input period. The user can select either to analyse the daily ICFs or the ICFs produced for a 6-h period. The percentage of correct ICF predictions is calculated as a per-centage of all the samples in which the observed ICF is the same as the predicted ICF. The example shows a rather low result, 35%. However, the sample points do not appear at the extremities of the graph, which is encouraging. In fact, most of the scatter values are within a distance of 1 unit, indicating a close match between prediction and observation.
Feedback from the users over the same period has been positive and provided a qualitative assessment. Users have reported that on a day-to-day basis, the predictions do provide operators with the level of fidelity and required accu-racy to improve their frequency management process and are better able to adapt communications operations to the chang-ing environment. The 6-h forecasts are better suited to their needs and meet their operational requirements.
6.2 SATCOM forecast
SATCOM forecasts are more difficult to validate, as less real-time scintillation data are available for direct compar-ison. Estimated Scintillation Index data, from GPS phase fluctuations, were used to validate the SATCOM forecasts (private communications – CLS {http://scintillations.cls.fr}). This data are presented in maps, where the value of S4(and therefore the scale of disturbance) in an area is indicated through a number of coloured points. Data are only avail-able in areas where there is a line-of-sight between a ground-based GPS receiver and a GPS satellite; therefore, the data are limited in certain latitudinal regions. Over a period of a week, from 10 January 2005–18 January 2005, the forecasts and daily scintillation maps were compared. The scintillation maps showed increasing disturbance throughout each day, especially in the low and high latitude regions. The SAT-COM forecasts for this period reflect these conditions, with the forecast categories changing from Disturbed to Severe in some of those areas. This initial analysis demonstrates that the SATCOM forecasts compare well with real-time data and offer the user potential benefits in predicting communi-cations disturbances on transionospheric paths. Further vali-dation and user feedback is required before this work reaches any firm conclusions, but the results are encouraging that the approach is valid.
7 Conclusions
A real-time system has been presented for forecasting iono-spheric conditions for both HF skywave and SATCOM users. DIFS is based on real-time data, such as ionosonde
The DIFS application includes a number of
quantitative analysis tools which are used to
generate results that show the quality and the
accuracy of the forecasts. It must be noted that
the forecasts are just that, predictions based on
an interpretation of currently observed effects
combined with empirical relationships between
the observations and the expected effects.
Therefore, achieving a perfect forecasting
accuracy is unrealistic, however the
establishment of a set of quantitative metrics
will enable an initial benchmark to be
established against which future improvements
to the forecasting services can be compared.
6.1 HF
Forecast
The analysis tool for the HF forecasting part of
DIFS includes an MUF analyser and an ICF
analyser.
The MUF analyser is shown in Fig 6-1. This
tool’s output shows the comparison between the
forecast values of MUF deviation (deviation
from the median) and the observed MUF
deviations (derived from the deviations of foF2
observations from the median). The analysed
data are displayed in a scatter diagram and
grouped into categories using the definitions for
up, normal and down. The lower part of the
analyser user interface is used to enter
information about which forecast will be
analysed, the period over which metrics will be
determined and the type of output report
required.
In the example shown in Fig 6-1, the forecasts
between 09/12/04 and 08/02/05 have been
analysed. Ideally, the observed and predicted
deviations would coincide e.g. if the MUF
deviation was predicted to be down, i.e. a
deviation greater than 20% below the median
value, and the observed MUF deviation was
more than 20% below the median value, then an
entry would appear in the lower left hand box
on the display. It can be seen that 74% of the
observed data lie in the same category as
predicted. The percentage correct value appears
in the statistics display. The data bias is low,
which means that the predicted MUF deviations
are on average lower than the actual data, i.e.
the forecasts tend to predict that the MUFs are
lower than those observed.
Fig 6-1 - Number graph showing MUF comparison from 9th Dec. 2004 to 8th Feb. 2005
Fig 6-2 - Scatter plot showing ICF comparison from 14th Oct. 2004 to 1st Feb. 2005
(a)
The DIFS application includes a number of
quantitative analysis tools which are used to
generate results that show the quality and the
accuracy of the forecasts. It must be noted that
the forecasts are just that, predictions based on
an interpretation of currently observed effects
combined with empirical relationships between
the observations and the expected effects.
Therefore, achieving a perfect forecasting
accuracy is unrealistic, however the
establishment of a set of quantitative metrics
will enable an initial benchmark to be
established against which future improvements
to the forecasting services can be compared.
6.1 HF
Forecast
The analysis tool for the HF forecasting part of
DIFS includes an MUF analyser and an ICF
analyser.
The MUF analyser is shown in Fig 6-1. This
tool’s output shows the comparison between the
forecast values of MUF deviation (deviation
from the median) and the observed MUF
deviations (derived from the deviations of foF2
observations from the median). The analysed
data are displayed in a scatter diagram and
grouped into categories using the definitions for
up, normal and down. The lower part of the
analyser user interface is used to enter
information about which forecast will be
analysed, the period over which metrics will be
determined and the type of output report
required.
In the example shown in Fig 6-1, the forecasts
between 09/12/04 and 08/02/05 have been
analysed. Ideally, the observed and predicted
deviations would coincide e.g. if the MUF
deviation was predicted to be down, i.e. a
deviation greater than 20% below the median
value, and the observed MUF deviation was
more than 20% below the median value, then an
entry would appear in the lower left hand box
on the display. It can be seen that 74% of the
observed data lie in the same category as
predicted. The percentage correct value appears
in the statistics display. The data bias is low,
which means that the predicted MUF deviations
are on average lower than the actual data, i.e.
the forecasts tend to predict that the MUFs are
lower than those observed.
Fig 6-1 - Number graph showing MUF comparison from 9th Dec. 2004 to 8th Feb. 2005
Fig 6-2 - Scatter plot showing ICF comparison from 14th Oct. 2004 to 1st Feb. 2005
(b) Fig. 4. (a) Number graph showing MUF comparison from 9 De-cember 2004 to 8 February 2005; (b) Scatter plot showing ICF com-parison from 14 October 2004 to 1 February 2005.
3598 N. Butcher: Daily ionospheric forecasting service (DIFS) III
measurements, geomagnetic indices and solar data, which are processed by a number of algorithms to produce a 6-h or 24-h forecast. For HF forecasts the percentage devia-tion from the median measured foF2 is used to determine the MUF and ICF values, while other algorithms take into account other magnetic and solar data. For SATCOM, the daily 10-cm solar flux value is used to as the input parame-ter to the Global Ionospheric Scintillation Model (GISM), to determine the forecast categories for each region.
An initial semi-quantitative analysis of the HF and SAT-COM forecasts was carried out to determine their accuracy. As stated in the analysis section, achieving a perfect forecast-ing accuracy is unrealistic, as forecasts are just that, predic-tions based on an interpretation of currently observed effects, combined with empirical relationships between the observa-tions and the expected effects. However, the analysis has al-lowed a set of quantitative metrics to be established which act as an initial benchmark against which future improvements to the forecasting services can be compared. Further work will also be needed over a longer period and for a variety of different ionospheric conditions to establish the complete metrics.
For the HF forecasts the MUF and ICF data were analysed by comparing the forecast values with the observed values. The MUF analysis shows that 74% of the observed data lie in the same category as predicted. A low data bias shows that the predicted MUF deviations are, on average, lower than the actual data, i.e. the forecasts tend to predict that the MUFs are lower than those observed. The ICF analysis appears to show a rather low result of 35%, however, the sample points do not appear at the extremities of the graph, which is en-couraging. In fact, most of the scatter values are within a distance of 1 unit, indicating a close match between predic-tion and observapredic-tion.
Feedback from the users over the same period has been positive and provided a qualitative assessment.
For SATCOM forecasts, real-time observational scintilla-tion data were not available for comparison and so the SAT-COM forecasts were validated through comparison with ex-ternal estimated scintillation maps. According to our analy-sis, the forecasts compare well with real-time data and offer the user potential benefits in predicting communications dis-turbances on transionospheric paths. Further validation and user feedback is required before this work reaches any firm conclusions, but the results are encouraging that the approach is valid.
Acknowledgements. This work was carried out under the ESA
Pi-lot Project for Space Weather Applications, Daily Ionospheric Fore-casting Service Contract number 17033/03/NL/LvH. BAE Systems ATC is one of the co-funded SDA groups on this project. The author thanks ESA for their support throughout this project and also thanks J. J. Valette for access to estimated scintillation data and Y. Beniguel for the use of the Global Ionospheric Scintillation Model (GISM).
Topical Editor M. Pinnock thanks R. A. van der Linden and another referee for their help in evaluating this paper.
References
Beniguel, Y. and IEEA: Global Ionospheric Scintillation Model (GISM) Technical Manual v 5.1, ITU-R RP 257 2004-10-03, 2004.
Briggs, B. H. and Parkin, J. A.: On the Variation of Radio Star and Satellite Scintillation with Zenith Angle, J. Atmosphere. Terr. Phys., 40, 339–365, 1963.
CCIR: Report 888-2, Short Term Forecasting of Critical Frequen-cies, Operational Maximum Usable Frequencies and Total Elec-tron Content, Reports of the CCIR, 1990, Annex to Volume VI, Propagation in Ionized Media, Geneva, 1990.
Davies, K: Ionospheric Radio, IEE Electromagnetic Waves Series, London, 1990.
McNamara, L. F.: Orbit A Foundation Series, The Ionosphere: Communications, Surveillance, and Direction Finding, Kreiger Publishing Company, Florida, 1991.
Recommendation ITU-R P.533-7: HF Propagation Prediction Method, Recommendations of the ITU-R, Study Group 3, Ra-diowave Propagation, Geneva 2001.
Wheadon, N. S., Milsom J. D., and Larsen, R.: A Fully Auto-mated Daily Short Term Ionospheric Forecasting Service, IEE Seventh International Conf. on antennas and propagation, York, UK, 1991a.
Wheadon, N. S., Milsom J. D., and Larsen, R.: The Research and Development of a Fully Automatic Daily Short Term Ionospheric Forecasting Service, IEE HF Radio Systemd and Techniques Conference, Herriott-Watt Univ., Edinburgh, UK July, 1991b.