HAL Id: insu-00619326
https://hal-insu.archives-ouvertes.fr/insu-00619326
Submitted on 22 Dec 2011
HAL is a multi-disciplinary open access
archive for the deposit and dissemination of sci-entific research documents, whether they are pub-lished or not. The documents may come from teaching and research institutions in France or abroad, or from public or private research centers.
L’archive ouverte pluridisciplinaire HAL, est destinée au dépôt et à la diffusion de documents scientifiques de niveau recherche, publiés ou non, émanant des établissements d’enseignement et de recherche français ou étrangers, des laboratoires publics ou privés.
Pluton-dyke relationships in a Variscan granitic complex
from AMS and gravity modelling. Inception of the
extensional tectonics in the South Armorican Domain
(France)
Paul Turrillot, Michel Faure, Guillaume Martelet, Yan Chen, Romain Augier
To cite this version:
Paul Turrillot, Michel Faure, Guillaume Martelet, Yan Chen, Romain Augier. Pluton-dyke relation-ships in a Variscan granitic complex from AMS and gravity modelling. Inception of the extensional tectonics in the South Armorican Domain (France). Journal of Structural Geology, Elsevier, 2011, 33, pp.1681-1698. �10.1016/j.jsg.2011.08.004�. �insu-00619326�
Pluton-dyke relationships in a Variscan granitic complex from
AMS and gravity modelling. Inception of the extensional tectonics
in the South Armorican Domain (France)
P. Turrillota, b, , M. Faurea, G. Marteletb, Y. Chena, R. Augiera
aInstitut des Sciences de la Terre d‟Orléans (ISTO), Université d‟Orléans, CNRS/INSU,
Université François Rabelais Tours, UMR6113, 45071 Orléans cedex 2, France
b
BRGM-GEO/G2R, BP 36009, 45060 Orléans cedex 2, France
Abstract
The Carnac granitic Complex (South Armorican Domain, Western France) was emplaced during Late Carboniferous times in the deepest Variscan unit, roofed by two major
extensional shear zones. Through the acquisition and interpretation of field data, Anisotropy of Magnetic Susceptibility and gravity data, emphasized by petrological and structural observations, we address the emplacement model and possible magmatic processes involved between dyking to massive plutonism in a synkinematic context. Gravity modelling highlights an overall eastward thinning of the pluton, and several deep zones in the western part of the complex, interpreted as the pluton feeder zones. The internal granitic fabric, developed in a sub-solidus state, shows marked planar-linear anisotropy, consistent with a vertical shortening in the WNW-ESE regional stretching regime and eastward magma spreading. This study documents the occurrence of numerous NNE-SSW trending dykes within the eastern part of the pluton, suggesting that this granitic Complex formed by the coalescence of dykes oriented perpendicular to the regional stretching direction, and thus interpreted as large-scale “tension gashes”. The synkinematic character of the Carnac Complex intrusion, recently dated at ca. 319 ± 6 Ma, thus times the inception of the late-orogenic extensional deformation experienced in the whole South Armorican Domain.
Keywords: Anisotropy of magnetic susceptibility (AMS); 2D gravity modelling; Synkinematic
intrusion; Pluton-dyke relationships; Variscan belt; Armorican massif
1. Introduction
In many collisional orogens, the thickened crust experiences extensional tectonics during late-orogenic stages, coeval with a widespread crustal melting, responsible for the emplacement of a large volume of granitic magma in the middle to upper crust (e.g. [Le Fort, 1981] , [Harris and Massey, 1994] , [Faure, 1995] , [Whitney et al., 2004] , [Brown, 2005] and [Faure et al., 2008] ). The tectonic framework of the late-orogenic evolution is then dominated by
extensional tectonics leading to the formation of large-scale extensional shear zones that accommodate the stretching of the continental crust (e.g. [Wernicke, 1981] , [Lister et al., 1984] and [Malavieille, 1993] ).
Internal fabrics of granitoids are often regarded as representative strain markers to investigate crustal deformation (e.g. [Cloos, 1925] , [Brun and Pons, 1981] , [Gapais and Barbarin, 1986] , [Paterson et al., 1989] , [Faure and Pons, 1991] , [Faure, 1995] , [Talbot et al., 2005a] and [Talbot et al., 2005b] ). Dyke swarms that may surround the granitic plutons can be used to
provide a minimum estimate of crustal extension (Passchier, 1990). During the last decades, the structural and genetic relationships between plutons and their associated dyke swarm have been widely investigated ( [Clemens and Mawer, 1992] , [Petford et al., 1993] , [Petford et al., 2000] , [Rubin, 1995] , [Petford, 1996] , [Talbot et al., 2005b] and [Bartley et al., 2006] ). It was argued that the dykes are either fed by magma coming from the pluton (e.g. [Baker, 1998] , [Clemens and Mawer, 1992] and [Rubin, 1995] ) or play a significant role in building the pluton (e.g. Petford et al., 2000).
This study focuses on the Variscan Carnac Complex, made of a granitic pluton and its surrounding dyke array that was emplaced in the South Armorican Domain during the late tectonic evolution of the Variscan belt (Turrillot et al., 2009). Using the Anisotropy of Magnetic Susceptibility (AMS), the mineral preferred orientation of the Variscan Carnac granitic pluton and of its surrounding dykes has been determined. Based on geological mapping, recent studies suggested that the Carnac Complex emplacement may record initial stages of the late-orogenic extensional tectonics (Augier et al., in press). The AMS survey enabled us to better understand the late-stage internal structure and fabric orientations developed within the crystallizing magma chamber, which will, in turn, be used to i) determine the principal strain axes that develop during the emplacement of the Carnac Complex and ii) characterize the relationships between the pluton and its dyke swarm. However, the magnetic fabric provides structural information restricted to the exposed level of the complex, but does not inform on the deep structures such as the geometry of the feeder zones or the pluton thickness variations. Therefore, a combined AMS and gravity study of the Carnac Complex is achieved; it will provide new insights on the pluton shape at depth, and will improve the understanding of the complex overall architecture in the context of a
synkinematic emplacement. Combined with microstructural observations, the role of magma dynamics-related deformation and/or regional stretching on the fabric development both in the pluton and in the dyke swarm can be discussed. These new data enable us to propose an emplacement model, which is also discussed in terms of regional implications in the light of the extensional tectonic framework that has been previously proposed for this area of the South Armorican Domain ( [Gapais et al., 1993] and [Turrillot et al., 2009] ).
2. Geological setting
2.1. General framework
The orogenic evolution of the European Variscides includes Ordovician rifting, Silurian subduction, Silurian–Devonian multiple collisions, Late Devonian-Carboniferous intra-continental deformation, and Upper Carboniferous late-orogenic extension ( [Dewey and Burke, 1973] , [Matte, 1986] , [Matte, 1991 , [Matte, 2001] , [Gapais et al., 1993] , [Faure, 1995] , [Cagnard et al., 2004] and [Faure et al., 2005] ). The French Massif Armoricain is classically subdivided into several tectono-metamorphic domains by two major dextral strike-slip shear zones active during the Upper Carboniferous times, namely, the North Armorican Shear Zone (NASZ), and the South Armorican Shear Zone (SASZ) that splits into a WNW-ESE northern branch and a NW-SE southern branch (Fig. 1a; [24 , [Watts and Williams, 1979] and [Jégouzo, 1980] ). However, these Carboniferous shear zones do not represent suture zones or plate boundaries. Concerning the Early Variscan collisional events, the Nort-sur-Erdre fault is considered as the suture zone between Central Armorican and South Armorican Domain (Fig. 1a) ( [Faure et al., 2005] , [Faure et al., 2008] and [Ballèvre et al., 2009] ).
Fig. 1. :(a) Simplified map of the Massif Armoricain. NASZ: North Armorican Shear Zone, SASZ: South Armorican Shear Zone, N. Branch: Northern Branch, S. Branch: Southern Branch; (b) Structural map of the Morbihan area in the South Armorican domain (Modified from Turrillot et al., 2009). The main tectonostratigraphic units and their internal features are depicted. The Intermediate and the Lower units are separated by the extensional Sarzeau Shear Zone (SSZ) in the Rhuys Peninsula, and the Quiberon Shear Zone (QSZ) in the Quiberon Peninsula.
The South Armorican Domain is limited to the north by the southern branch of the SASZ (Fig. 1a; [Berthé et al., 1979] and [Jégouzo, 1980] ). There, several tectono-metamorphic units are recognized from top to bottom (Fig. 1b; e.g. [24] , [Le Corre et al., 1991] and [Ballèvre et al., 1994] ): (1) Upper units characterized by well preserved HP–LT metamorphic rocks in the Bois de Céné, and Ile de Groix blueschist klippes (Bosse et al., 2002), and in Vendée and Belle-Ile-en-Mer porphyroids (Le Hébel et al., 2002); (2) Intermediate units or “Schistes de la Vilaine” group equilibrated upon a MP-MT Barrovian geothermal gradient ( [Triboulet and Audren, 1988] and [36] ; Brown and Dallmeyer, 1996); and (3) Lower unit of HT-MP rocks consisting of migmatites (i.e. metatexites) and migmatitic granites (i.e. diatexites) intruded by large volumes of late to post- migmatitic granites (e.g. [Audren and Le Métour, 1976] and [Marchildon and Brown, 2003] ).
Unlike Central Armorica, the South Armorican Domain underwent extensional tectonics during the last stage of the Variscan orogenic evolution (e.g. [Gapais et al., 1993] , [Cagnard et al., 2004] and [Turrillot et al., 2009] ). The overall tectonic framework of the South Armorican Domain consists of Lower Unit migmatites and granites, exposed in tectonic windows overlain by the Intermediate Unit. At the regional scale, a widespread extension is well documented in the Sables d‟Olonne area where it is accommodated by a pervasive thinning of the entire metamorphic sequence (Cagnard et al., 2004), whereas in the Morbihan area, Lower Unit high-grade rocks are roofed by localized WNW, and
top-to-the-ESE extensional shear zones, namely, the Quiberon Shear Zone (QSZ), and the Sarzeau Shear Zone (SSZ), respectively ( [Gapais et al., 1993] and [Turrillot et al., 2009] ).
2.2. The Morbihan area
In the Morbihan area, the Intermediate Unit forms the SSZ hanging wall. This overlying unit mainly consists of garnet-micaschists belonging to the “Schistes de la Vilaine” group ( [2] , [Triboulet and Audren, 1988] and [4] ). The sub-horizontal foliation and WNW-ESE lineation (Audren, 1987) are interpreted as remnant features of a Devonian thrusting event ( [Brun and Burg, 1982] and [Vauchez et al., 1987] ), equivalent to the D2 event of Faure et al. (2005). In the SSZ footwall, the Lower Unit, which is bounded to the north by the SASZ strike-slip fault, consists of subvertical, NW-SE striking, migmatites derived from metasediments and rare orthogneiss bodies ( [Brown, 1983] , [Peucat, 1983] , [Jégouzo et al., 1986] , [2] , [Jones and Brown, 1990] and [Guerrot et al., 1997] ), dated to Early Ordovician (ca. 463 ± 6 Ma; Peucat, 1983). In the Lower Unit, metamorphic peak-conditions, estimated at ∼9–10 kbar and 750–800 °C ( [2] , [Triboulet and Audren, 1988] , [Jones and Brown, 1989] , [Jones and Brown, 1990] , [Brown and Dallmeyer, 1996] and [Johnson and Brown, 2004] ), were followed by a stepped retrograde P-T path involving decompression and a second episode of melt generation around ∼4 kbar and 700–750 °C ( [Brown and Dallmeyer, 1996] and
[Johnson and Brown, 2004] ).
Crustal melting, dated at 322 ± 3 Ma by monazite U–Th/Pb in-situ method (Turrillot et al., 2009) produced large volumes of anatectic granite all over the migmatitic area. These granitic bodies, with a size from 1 m to more than 3 km, are elongated along the migmatitic foliation. One of these bodies forms a 70 km elongated pluton regionally known as the Ste-Anne
d‟Auray magmatic complex (Fig. 1b; [Le Métour, 1977] and [4] ). The migmatites crossed the solidus at ∼3.5 kbar and 660 °C (Brown and Dallmeyer, 1996). Farther to the south, a WNW-ESE elongated magmatic body of ca. 20 × 50 km, known as the Carnac Complex (Fig. 1b), intrudes into the migmatites (Fig. 2a; [Audren and Le Métour, 1976] and [4] ). Monazite U– Th/Pb time-constraints yielded emplacement ages of the Carnac Complex at 319 ± 6 Ma ( [Turrillot et al., 2009] and [4] ). Conventional 40Ar/39Ar analyses on white micas from the undeformed Carnac Complex granite provided cooling ages at ∼305 Ma (Turrillot, 2010). In the southwest part of the study area, the Quiberon leucogranite also intrudes into the
Fig. 2. : Outcrop pictures of representative dykes of the Carnac Complex, and
microphotographs of the magmatic microstructures. On the right bottom of the thin section pictures c–h, the numbers refer to the sample name and to the AMS sites. Their location is given on Fig. 1. The thin sections are oriented parallel to the WNW-ESE stretching. Qz: quartz; Fk: K-feldspar; Pl: plagioclase; Bt: biotite; Ms: muscovite (a) Structural relationships between a steeply dipping N30 °E striking granitic dyke and its migmatitic host rock (vertical N120 °E-striking foliation). Anatectic granite bodies belonging to the Ste-Anne d‟Auray magmatic complex are intercalated within the migmatitic foliation. Note the sharp contact between the migmatites and the dyke; (b) Gently dipping dyke, with an internal fabric interpreted as magmatic layering; (c) and (d) Microstructures characteristic of undeformed granite; (e) and (f) Microstructures of moderate solid-state deformation; (g) and (h)
Microstructure of significant solid-state deformation.
The Carnac Complex and the Quiberon leucogranitic pluton are ductilely deformed by the Sarzeau and the Quiberon shear zones. The Quiberon leucogranite emplacement is coeval with a top-to-the-WNW shearing along the W-dipping QSZ (Gapais et al., 1993), which has been dated between 310 and 300 Ma (Ruffet in Le Hébel, 2002). East of the study area, the Carnac Complex is mylonitized within the gently eastward dipping SSZ, which is
characterized by a top-to-the-ESE shearing (Turrillot et al., 2009; Fig. 1b). In the SSZ footwall, metre-scale shear bands with top-to-the-ESE sense of shear developed. The ductile shearing along the SSZ has been dated at 302–300 Ma by in-situ 40Ar/39Ar analyses on white mica neo-crystallizations along the shear planes (Turrillot, 2010). At the scale of the
Morbihan area, it has been proposed that during a ductile WNW-ESE stretching, shearing with opposite kinematics along the QSZ and the SSZ allowed the exhumation of the Lower Unit in Late Carboniferous time (Turrillot et al., 2009).
During an overall cooling of the Lower Unit (Carpena, 1979), the deformation evolved into a brittle regime. Within the Lower and Intermediate units, numerous high-angle normal faults developed coeval with joints and tension gashes. Field evidence shows that these brittle structures crosscut the ductile ones. The inversion of fault slip data outlined a WNW-ESE extensional deformation during a late brittle regime that has been dated at 300–298 Ma by in-situ 40Ar/39Ar analyses on white micas crystallized on the fault surfaces (Turrillot, 2010). These ages place the ductile–brittle transition at 300 ± 2 Ma and point to a ∼20 Ma long-lived extensional deformation during the Upper Carboniferous times.
2.3. The Carnac Complex
2.3.1. Overall framework and internal features
The Carnac Complex consists of a granitic pluton developed to the west of the study area, which is surrounded by a pervasive granitic dyke swarm (Augier et al., in press). The geological map (Augier et al., in press) shows that the dyke swarm is more developed to the east, than to the west (Fig. 1b). The Carnac pluton consists mainly of homogeneous fine-to-medium grained biotite isotropic granite with rare cordierite. Locally, and particularly to the East, a two-mica facies can be observed. The dyke swarm is composed of a fine-grained biotite and muscovite facies similar to that of the Carnac pluton, but with a lower proportion of Fe–Mg rich minerals (Augier et al., in press).
The pluton and the dykes yield similar monazite U–Th/Pb ages, considering the analytic uncertainties (Turrillot et al., 2009). Yet, in the field, the relative timing based on intersecting structures between the pluton and its dyke swarm has never been clearly observed. The dyke thickness varies from 50 cm to more than 500 m (e.g. Ile aux Moines). Most of dykes are steeply (i.e. 90–60 °) west dipping, and rarely gently (i.e. 60–20 °) west dipping (Fig. 2a and b) as the average dip is ca. 82 ± 8 °. While most outcrops of the Carnac granite do not show any macroscopic magmatic fabric, some dykes exhibit a well-developed planar mineral preferred orientation defined by the alternation of quartz+feldspar-rich, and micas-rich layers lying parallel to the dyke walls (Fig. 2b). This penetrative fabric is interpreted here as a magmatic layering formed during the dyke emplacement. The dykes crosscut at right angle the migmatitic host-rocks fabric (Fig. 2a). A statistical measurement of the dyke walls
orientation reveals a clear NNE-SSW regional trend (Turrillot, 2010), i.e. at right angle to the WNW-ESE maximum stretching inferred from the ductile deformation structures ( [Gapais et al., 1993] and [Turrillot et al., 2009] ). It has been proposed that the dykes of the Carnac Complex represent NNE-SSW striking large-scale tension gashes coeval with the WNW-ESE maximum stretching direction (Turrillot et al., 2009).
2.3.2. Microstructure of the Carnac Complex
In order to characterize the microstructure of the Carnac Complex, thin sections of apparently unstrained granite were made from the pluton and the dyke swarm. Sampling was done within the entire Carnac Complex and therefore tends to be representative of the whole massif. All thin sections were cut in the X–Z plane, parallel to the direction of the WNW-ESE regional stretching. Representative examples of the Carnac granite microstructures are shown in Fig. 2, and the location of the corresponding sample is indicated in the geological map (Fig. 1b).
Three types of microstructures are distinguished. The first one shows anhedral, millimetre-scale sized quartz grains with non-undulatory extinction and planar boundaries (e.g. samples 39 and 21). The quartz and feldspar grains do not show any crystal-plastic deformation or recrystallization evidence (Fig. 2c and d), or any particular mineral preferred orientation. These features are characteristic of undeformed granite (Paterson et al., 1989). The second type of microstructure displays 0.5–1 mm quartz grains (e.g. samples 5 and 40) with undulatory extinction. Some quartz grains are weakly recrystallized with a slight neograin formation (Fig. 2e and f). These features are characteristics of a moderate solid-state deformation (Paterson et al., 1989). The third type of granitic microstructure shows a
significant solid-state deformation (Fig. 2g and h). Quartz grains with a noticeable grain-size reduction (smaller than 0.5 mm), serrated boundaries, and undulatory extinction argue for a dynamic recrystallization process (e.g. samples 14 and 42).
Based on these microstructural observations at the scale of the entire Carnac Complex, super-solidus (i.e. magmatic) deformation and moderate solid-state deformation predominate in the pluton. Conversely, solid-state deformation predominates in the dykes of the Carnac
Complex.
3. Anisotropy of magnetic susceptibility (AMS) of the Carnac Complex
The overall geometry of the Carnac Complex (i.e. the northern limit of the pluton and
particularly its dyke swarm (Fig. 1b)) suggests that its emplacement occurred during a WNW-ESE stretching of the crust (Turrillot et al., 2009). At the outcrop scale, only rare evidence of linear mineral preferred orientation can be observed within gently dipping dykes, and except
in the eastern part of the Carnac Complex (i.e. within the SSZ), the Carnac granite seems to be unstrained. Therefore, while the deformed zones have already been studied in detail by field structural means, an AMS survey was carried out on the entire Carnac Complex in order to identify systematically the planar and linear magnetic fabrics, and assess their geometric compatibility with an extensional tectonic setting during pluton emplacement as suggested by field observations. Furthermore, in order to understand the AMS fabrics displayed by related dykes of the Carnac Complex, a detailed AMS study was undertaken in two large dykes that crop out in the Golfe du Morbihan.
3.1. AMS sampling
The AMS survey of the Carnac Complex was performed on 46 sites comprising 343 oriented cores, drilled within the pluton and the dyke swarm. The poor exposure conditions within the pluton made an extensive sampling difficult. Nevertheless, the site distribution is
homogeneous at the pluton scale, and provides a good coverage of the Carnac Complex, with an average of 1 site for 4 km2.
Excellent exposures along the seacoast of the Golfe du Morbihan allowed an additional specific AMS survey of 37 sites comprising 214 oriented cores through the Arradon and the Ile aux Moine dykes. AMS sites were spaced of several metres to 200 m depending on the outcrop conditions. Particular efforts were made to investigate the contact between the dykes and migmatitic host rocks. Therefore, the variation of the granite magnetic fabrics across the dykes has been studied taking into account the location of the sites with respect to the dyke borders.
3.2. Measurements
AMS and bulk magnetic susceptibility (Km) were measured with an AGICO KLY-3S apparatus at the “Laboratoire de Magnétisme des roches d‟Orléans” (CNRS-Université d‟Orléans). For each site, the mean direction of the three principal axes of the AMS ellipsoid (K1 ≥ K2 ≥ K3) was computed with ANISOFT software using Jelinek statistics (Jelinek, 1981). ANISOFT software was also used to calculate the shape parameter
(T = 2ln(K2/K3)/ln(K1/K3)−1) and the anisotropy degree parameter (Pj = K1/K3) that
together describes the AMS ellipsoid ( [Jelinek, 1978] , [Jelinek, 1981] and [Hrouda, 1982] ). Magnetic hysteresis curves were obtained using a translation inductometer within an
electromagnet providing a field of up to 1 Tesla at the Paleomagnetic Laboratory of “Institut de Physique du Globe de Paris” (IPGP, Saint-Maur, France).
3.3. Magnetic mineralogy
The identification of the mineral phases that contribute to the magnetic signal is necessary in order to get meaningful geological significance on the measured magnetic fabric (e.g.
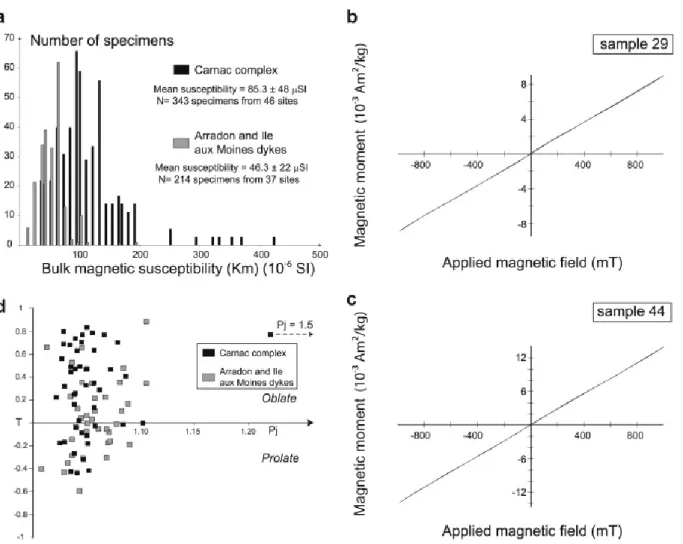
[Borradaile, 1988] , [Rochette et al., 1992] and [Borradaile and Henry, 1997] ). To do so, two methods of investigation were used: bulk magnetic susceptibility (Km) and hysteresis curve. Fig. 3a presents the distribution of the bulk magnetic susceptibility deduced from the
laboratory measurements of the 343 specimens of the Carnac Complex, and the 214
specimens drilled within the Arradon and Ile aux Moines dykes. Km measurements within the Carnac Complex present a unimodal distribution with weak values spreading around
85.3 ± 48.0 μSI. Km measurement of the Arradon and Ile aux Moines dykes also provides a unimodal distribution around 46.3 ± 22 μSI. These values (<100 μSI) obtained for both
surveys correspond to a typical Al-rich granite suggesting that paramagnetic phases (e.g. biotites) are the main contributor to AMS (Bouchez, 1997). Several specimens from the Carnac Complex show rather high Km values (>200 μSI–450 μSI) that could be explained by the presence of secondary mineralization hardly detected in the field and even in thin sections. These unusual high values, with respect to the majority of the Km measurements, are
excluded from the discussion. Fig. 3b and c show hysteresis curves of two samples, one from a site within the pluton, and one from a metre-scale dyke (see the sample locations in Fig. 1b). For these two samples, hysteresis curves show almost perfectly linear and reversible induced magnetic moment with increasing and decreasing magnetic field, characterising paramagnetic minerals as the principal carrier of magnetic susceptibility.
Fig. 3. : Information related to the magnetic mineralogy of the entire Carnac Complex and of the dykes. (a) Histogram of the bulk magnetic susceptibility measured from specimens of the Carnac Complex (black) and of the dykes of Ile aux Moines and Arradon (grey); (b)
Hysteresis measurements of one specimen from the Carnac pluton (sample 29) (c) Hysteresis measurements of one specimen from a dyke (sample 44). The curves are characteristic of paramagnetic minerals showing linear relationships between the applied magnetic field and the magnetic moment; (d) AMS scalar parameters for each site. Anisotropy degree (Pj) vs.
shape parameter (T). AMS sites in the Carnac Complex are represented by black squares, and AMS sites in the Ile aux Moines and Arradon dykes are represented by grey squares.
As described above, the magnetic mineralogy of the Carnac Complex is dominated by paramagnetic minerals such as micas, which are easily observed in the thin section (Fig. 2). The magnetic mineralogy is comparable between the Arradon and Iles aux Moine dykes. These analytic results are in agreement with the field observations of the Carnac Complex, where biotite may be considered as the main Fe-bearing mineral. Thus, the lower proportions of biotite in the dykes can be correlated to the corresponding lower Km values. As mentioned above in the mineralogical composition description, cordierite can be present in the Carnac Complex. In order to avoid the confusion in the interpretation of the magnetic fabric, the outcrops containing cordierite were carefully avoided during AMS sampling since this
mineral is characterized by inverted K1 and K3 axes with respect to the micas (Rochette et al., 1992). Therefore, the magnetic signal can be mainly attributed to the biotite, and thus the K1 and K3 axes may be directly interpreted as the lineation and the pole of foliation of the mineral fabrics, respectively (Rochette et al., 1992).
3.4. AMS results
3.4.1. Anisotropy degree and shape parameter
The statistical results of the AMS measurements within the Carnac Complex and the Ile aux Moines and Arradon dykes are listed in Table 1. For each site, the mean declination, and inclination of the K1 and K3 axes with their corresponding confidence parameter (α95min), the
average of Km, and the Pj and T parameters are provided. The plot of Pj vs. T parameters is
presented in Fig. 3d. Only one site (Site 24) shows a Pj parameter >1.5 which may be
influenced by a secondary mineralization or border effect as it is located near the contact with country rocks. The other sites are characterized by very weak values of Pj (<1.102). In the Pj
vs. T diagram, the T parameter is scattered from −0.42 to 0.87 values for the Carnac Complex sites, and from −0.59 to 0.88 values for Arradon and Ile aux Moines dykes sites (Fig. 3d). This scattering does not reveal a dominance of planar (oblate) or linear (prolate) anisotropy within the measured sites. Moreover, no statistical reliable relationships between the Pj and T
Table 1. Results of AMS measurements from the Carnac Complex.
Site Coordinates N K1 K3 Km Pj T
Lat. (°N) Long. (°E) Dec(°) Inc(°) α95min α95max Dec(°) Inc(°) α95min α95max
1 −2.9541 47.6387 7 130.6 18.5 3.3 8.5 25.3 38.3 4.8 9.8 91.0 1.049 −0.111 2 −2.9160 47.6236 7 138.8 10.5 2.7 11.2 279.1 76.4 2.8 13.1 60.6 1.071 0.466 3 −2.8903 47.5827 7 308.6 43.3 6.6 9.5 132.1 46.6 4.2 13.8 96.5 1.042 0.489 4 −2.9175 47.5832 9 128.9 0.4 5.3 37.7 38.7 28.5 1.5 5.8 122.0 1.044 0.701 5 −2.9944 47.6411 7 195.3 15.6 3.2 7.6 320.9 64.3 6.6 8.5 66.2 1.039 −0.046 6 −2.9730 47.6224 7 316.5 37.2 10.1 18.0 51.9 7.1 9.8 17.9 59.9 1.020 0.222 7 −2.9972 47.5982 7 323.0 56.9 1.0 2.6 99.0 25.1 0.9 7.1 103.0 1.056 0.132 8 −2.9506 47.5744 8 308.1 39.6 2.4 12.4 116.0 49.8 1.8 10.5 87.8 1.065 0.768 9 −2.9299 47.5555 8 244.1 27.7 6.1 28.8 103.9 55.6 6.0 7.1 80.8 1.038 0.733 10 −3.0049 47.5677 6 286.7 5.8 8.0 18.0 29.1 64.7 3.7 11.7 102.0 1.056 0.629 11 −3.0217 47.5910 6 207.4 54.4 1.9 6.4 302.1 3.4 5.9 18.3 106.0 1.051 −0.418 12 −3.0543 47.5709 5 95.1 22.1 4.3 8.3 1.0 9.9 7.3 21.1 84.2 1.050 −0.183 13 −3.0945 47.5650 7 283.2 58.9 3.5 5.3 62.3 24.5 4.6 10.2 56.1 1.040 −0.440 14 −3.0491 47.5878 6 245.3 50.9 6.4 14.3 51.1 38.2 6.4 8.8 97.9 1.028 0.317 15 −3.0311 47.6056 10 284.9 41.4 3.4 9.7 106.1 48.6 5.4 11.0 81.1 1.041 0.017 16 −3.0682 47.6254 9 227.2 17.5 6.5 10.3 323.1 18.1 5.5 15.5 132.0 1.024 −0.179 17 −3.0712 47.6010 11 233.1 59.8 11.9 24.8 42.6 29.8 7.4 19.9 95.8 1.033 0.680 18 −3.1286 47.5986 7 316.1 39.0 1.8 3.4 198.6 29.7 2.8 6.3 93.9 1.048 0.464 19 −3.1341 47.5431 8 309.1 49.7 4.9 8.4 99.7 36.4 4.7 8.6 171.0 1.085 0.404 20 −3.1198 47.6285 9 234.1 47.6 5.0 8.0 68.0 41.6 4.2 5.8 61.4 1.034 0.487 21 −3.1597 47.6270 10 285.8 29.4 4.9 7.5 29.8 23.3 4.9 6.0 97.8 1.037 0.162 22 −3.1683 47.6117 6 207.3 71.4 2.8 7.9 88.5 9.2 5.1 18.0 106.0 1.046 −0.321 23 −3.0821 47.6472 5 228.5 44.4 3.9 11.6 90.4 37.2 3.5 17.5 89.9 1.083 −0.015 24 −3.1006 47.6625 10 293.9 32.7 5.2 23.9 98.1 56.3 3.4 8.3 265.0 1.515 0.779 25 −3.1010 47.6775 6 313.9 22.8 3.2 21.6 109.4 65.2 1.7 7.5 73.1 1.078 0.697 26 −3.1044 47.6972 5 263.1 2.9 0.9 4.4 170.3 44.4 1.2 10.4 34.5 1.028 −0.169 27 −3.1421 47.6957 7 187.7 2.5 2.7 22.2 290.4 78.9 2.2 3.2 55.0 1.045 0.768 28 −3.1461 47.6625 7 334.6 13.1 2.5 11.2 102.1 69.0 2.2 4.7 86.4 1.056 0.345 29 −3.1610 47.6815 6 103.8 27.9 3.4 7.0 349.1 38.2 2.4 8.8 35.5 1.057 −0.029 30 −3.1880 47.6824 7 302.7 42.0 3.7 19.2 84.0 40.9 3.8 7.6 148.0 1.049 0.832 31 −3.1986 47.6743 11 228.8 62.1 4.0 15.5 53.6 27.8 3.9 5.4 87.4 1.038 0.469 32 −3.1915 47.6605 6 312.5 67.4 6.7 10.3 104.1 20.2 3.6 13.8 88.6 1.034 0.442 33 −3.2073 47.6610 8 131.4 63.8 4.0 15.0 262.2 17.8 8.3 20.0 80.5 1.038 0.255 34 −3.2149 47.6450 5 330.6 72.3 6.1 13.1 227.4 4.1 4.6 12.7 38.3 1.049 0.470 35 −3.2134 47.6929 5 22.9 21.3 7.8 48.1 223.9 67.3 4.4 13.7 17.0 1.027 0.686 36 −3.2648 47.6854 9 327.2 53.6 5.9 7.0 143.6 36.4 2.7 8.7 77.1 1.037 −0.269 37 −3.2423 47.7307 5 265.1 50.0 11.2 16.7 93.5 39.7 2.3 12.2 80.9 1.040 0.626 38 −3.2254 47.7105 7 269.6 34.0 1.9 5.5 90.2 56.0 1.9 9.9 69.9 1.037 0.246 39 −3.2134 47.7073 6 336.4 14.2 2.1 26.5 76.6 34.8 4.7 9.8 164.0 1.054 0.785 40 −3.0422 47.6859 10 284.5 21.5 2.5 8.9 121.2 67.7 2.1 5.3 48.5 1.061 0.286 41 −2.8305 47.6144 17 356.7 35.0 9.0 42.1 108.5 27.9 8.9 12.1 25.3 1.031 0.873 43 −2.9151 47.5460 7 243.4 47.4 5.5 9.4 86.0 40.3 5.6 13.0 44.5 1.048 0.325
Site Coordinates N K1 K3 Km Pj T Lat. (°N) Long. (°E) Dec(°) Inc(°) α95min α95max Dec(°) Inc(°) α95min α95max
44 −2.9160 47.5460 5 4.1 61.6 3.9 52.9 105.6 6.1 4.8 17.3 43.4 1.025 0.560 45 −2.9138 47.5569 8 207.2 44.9 3.2 4.3 50.5 42.7 3.2 4.3 106.0 1.044 −0.090 IS19 −2.8539 47.6003 8 306.9 7.1 19.7 25.7 202.0 64.1 22.6 62.0 18.4 1.034 −0.427 PS20 −2.8619 47.6183 6 308.1 6.5 2.3 5.6 205.5 62.4 4.1 4.9 91.9 1.101 −0.004
Lat.: Latitude, Long.: Longitude; N: number of specimens; Dec, Inc, α95min, α95max are
declination, inclination, Jelinek‟s statistic confidence at 95% level (Jelinek, 1981) in degrees, respectively; Km: Meanbulk magnetic susceptibility, Pj: Corrected anisotropy degree, and T: Anisotropy shape parameter (Jelinek, 1981).
3.4.2. AMS fabric patterns of the Carnac Complex
Fig. 4 shows the spatial distribution of the AMS sites within the Carnac Complex and the results of magnetic fabric from the AMS measurements. The magnetic lineation (K1) and the pole of the magnetic foliation (K3) are plotted on an equal-area and lower hemispheric projection. Most of the sites show well-grouped K1 and K3 axes projection. This observation is also confirmed by low values of confidence circles (α95min) for the magnetic lineation and
for the pole of magnetic foliation, as well (Table 1). Though an overall westward dipping attitude can be noticed, the poles of the magnetic foliation show rather variable directions (Fig. 5a). The magnetic lineation is arranged along two mean directions (Fig. 5b), and globally shows a westward plunge. The main lineation direction trends WNW-ESE, parallel to the one inferred from the ductile and brittle structures ( [Turrillot et al., 2009] and [74] ), and presents variable plunges decreasing eastward from more than 60 ° to less than 10 ° (see dip variations in WNW-ESE direction in Fig. 5b). The second cluster of the magnetic
lineation direction is oriented NNE-SSW, that is parallel to the average dyke orientation, and plunges are mainly grouped around 40 ° (Fig. 5b).
Fig. 4. : Equal area projection (lower hemisphere) of the AMS results for each site within the Carnac Complex. On the map, the white circled numbers refer to the AMS sites. On the stereoplots, squares and circles are K1 (magnetic lineation) and K3 (pole of magnetic foliation), respectively. Small grey dots and large black ones represent individual specimens and site-mean direction, respectively. Confidence ellipses at 95% level are drawn around average orientation direction.
Fig. 5. : Magnetic fabric maps of the Carnac Complex. Information on confidence parameter (α95min) is given for each magnetic fabric. Equal-area projections (lower hemisphere) show
(b) Magnetic lineation. For the WNW-ESE oriented K1 axes, dip variation is given along the A–B section.
3.4.3. AMS fabric patterns of the Arradon and Ile aux Moines dykes
The distribution of the AMS fabrics along transects through the Arradon and Ile aux Moines dykes are depicted in Fig. 6. Most of the sites show low values of the confidence parameter (α95min) for both the magnetic lineation and pole of magnetic foliation, comparable to those
obtained from the Carnac Complex (Table 2). The measured direction of magnetic lineation for all the sites is consistent. The magnetic foliation shows a rather horizontal attitude with various strikes that can be related to their general shallow dip. The magnetic lineation is globally horizontal and clusters around a well-defined WNW-ESE direction. However, some sites on the margins of the dykes may suffer a local thermal or mechanical perturbation magnetic lineation and show ENE-SSW orientations (see Sites IS17, 22E2 or AS13 in Fig. 6), i.e. parallel to the general dyke orientation (Fig. 1; Turrillot, 2010).
Fig. 6. : Equal area projection (lower hemisphere) of the AMS results for each site within the Ile aux Moines and Arradon dykes. AMS site locations within the Ile aux Moines and
Arradon dykes are given by small white circles on the map. On the stereoplots, squares and circles are K1 (magnetic lineation) and K3 (pole of magnetic foliation), respectively. Small grey dots and larger black ones represent individual specimen and site-mean direction,
respectively. Confidence ellipses at 95% level are drawn around average orientation direction. In the bottom-right corner equal-area projections (lower hemisphere) show the density
Table 2. Results of AMS measurements from the Arradon and Ile aux Moines dykes.
Site Coordinates N K1 K3 BMS P T
Lat. (°N) Long. (°E) Dec(°) Inc(°) α95min α95max Dec(°) Inc(°) α95min α95max
42 −2.8323 47.6143 6 131.5 4.2 2.7 6.1 241.4 77.8 2.8 8.0 38.2 1.035 −0.286 AS1 −2.8339 47.6131 4 113.0 16.8 8.7 35.7 9.5 37.8 15.7 41.1 55.3 1.006 −0.403 AS2 −2.8347 47.6128 7 315.2 9.4 3.9 12.5 53.3 40.2 4.2 13.7 45.9 1.036 −0.145 AS3 −2.8353 47.6128 6 305.6 9.0 3.6 5.7 46.0 48.8 2.1 18.0 26.7 1.026 −0.429 AS4 −2.8358 47.6128 7 327.2 9.7 3.1 14.8 83.6 69.0 4.2 6.7 31.0 1.054 0.344 AS5 −2.8356 47.6131 6 320.5 12.4 3.9 10.5 77.1 63.9 4.0 4.1 36.0 1.040 0.123 AS6 −2.8356 47.6131 6 316.1 12.6 2.6 5.6 73.4 64.0 2.7 9.3 33.3 1.048 0.062 AS7 −2.8350 47.6133 3 323.1 30.4 0.3 24.1 131.9 51.1 3.0 13.7 28.1 1.044 0.655 AS8 −2.8347 47.6139 6 136.9 3.4 1.9 6.9 28.9 79.1 1.9 4.5 44.5 1.080 0.352 AS9 −2.8356 47.6131 7 315.6 9.4 3.8 10.5 64.8 63.1 4.3 9.0 30.3 1.059 −0.054 AS10 −2.8350 47.6128 4 309.8 6.2 2.2 8.1 47.5 51.1 2.8 10.2 30.0 1.045 −0.311 AS11 −2.8342 47.6128 6 304.0 18.1 1.3 12.0 121.3 71.8 2.3 11.9 50.4 1.043 0.040 AS12 −2.8336 47.6133 7 128.2 3.2 5.7 17.5 20.9 79.2 3.7 7.5 23.4 1.033 0.228 AS13 −2.8314 47.6142 6 252.1 21.6 13.1 57.0 37.0 64.1 5.4 25.7 31.9 1.011 0.657 IS54−56 −2.8389 47.6061 6 313.8 0.4 5.5 11.8 44.6 62.8 5.1 12.1 38.0 1.056 0.106 IS57−60 −2.8389 47.6061 5 138.6 4.7 6.4 9.4 39.9 61.2 5.9 9.4 37.7 1.056 0.218 IS61−65 −2.8389 47.6060 5 317.3 0.6 0.7 5.9 48.0 51.9 1.4 4.6 50.0 1.069 −0.081 IS66−69 −2.8389 47.6058 5 134.1 3.5 4.2 11.0 39.5 52.1 4.3 11.8 54.3 1.067 −0.054 IS70−74 −2.8388 47.6058 6 301.4 12.6 7.0 28.7 50.1 55.1 1.8 19.2 56.3 1.068 −0.174 IS75−79 −2.8388 47.6058 5 305.1 1.0 0.5 12.6 36.8 59.1 1.3 5.2 56.4 1.104 0.347 IS80−83 −2.8387 47.6058 6 296.0 7.7 1.6 16.4 39.9 60.5 2.4 8.7 61.3 1.087 0.167 IS84−86 −2.8387 47.6072 5 303.0 8.4 0.9 3.1 45.8 56.2 0.9 5.8 52.6 1.081 0.105 IS87−89 −2.8387 47.6057 6 308.8 8.5 4.4 18.1 49.7 51.8 2.5 4.6 52.7 1.083 0.478 IS90−93 −2.8386 47.6056 6 298.4 14.4 3.1 6.8 52.2 57.5 2.9 9.3 53.9 1.076 −0.013 IS94−98 −2.8383 47.6056 5 304.6 18.7 3.2 7.1 66.0 56.9 3.7 16.3 55.6 1.070 −0.163 IS99−103 −2.8383 47.6058 5 310.0 17.6 3.9 13.5 52.2 33.7 3.3 15.8 53.7 1.067 −0.305 IS104−108 −2.8389 47.6075 5 298.8 1.7 2.0 7.2 29.9 33.9 2.6 13.9 54.0 1.089 −0.191 IS109−112 −2.8388 47.6075 5 118.3 2.8 4.5 13.9 27.0 24.6 10.2 53.0 28.5 1.041 −0.594 IS113−117 −2.8383 47.6050 5 132.2 2.7 12.7 17.4 234.0 76.9 4.1 23.8 46.4 1.038 −0.038 IS118−121 −2.8381 47.6044 7 281.3 5.2 2.5 26.7 182.6 59.0 2.8 6.2 51.9 1.044 0.354 IS17 −2.8397 47.5997 11 30.4 21.4 5.4 41.0 164.1 60.4 5.0 16.9 111.0 1.104 0.882 IS18 −2.8475 47.5983 9 303.2 3.8 6.0 10.1 35.2 27.9 6.4 11.2 40.9 1.053 0.031 22−E1 −2.8527 47.5954 5 116.6 5.4 4.2 5.2 217.4 63.0 1.6 7.3 35.5 1.067 0.223 22−E2 −2.8527 47.5954 3 185.1 20.2 4.0 11.6 287.0 29.2 0.9 6.8 34.4 1.035 0.525 22−E3 −2.8521 47.5957 7 291.3 14.5 3.6 10.8 97.9 75.1 4.3 10.9 54.6 1.048 −0.071 22−E4E5 −2.8521 47.5963 5 281.8 28.3 4.8 8.8 98.0 61.7 1.4 45.6 86.3 1.031 −0.352 22−E6 −2.8523 47.5970 6 77.7 10.4 3.8 8.2 179.7 48.7 4.1 17.7 40.9 1.049 −0.006
Lat.: Latitude, Long.: Longitude; N: number of specimens; Dec, Inc, α95min, α95max are
declination, inclination, Jelinek‟s statistic confidence at 95% level (Jelinek, 1981) in degrees, respectively; Km: Meanbulk magnetic susceptibility, Pj: Corrected anisotropy degree, and T: Anisotropy shape parameter (Jelinek, 1981).
Fig. 7 is a cross-sectional view of the Arradon and Ile aux Moines dykes. Positions of the AMS sites are projected on the plane of section. Along the cross sections, the variations of K1 in declination and inclination, as well as the variation of anisotropy degree and shape
parameter are presented. The K1 declination trends around N130 °E within the dykes and derive near the dyke walls. The K1 inclination is clustered around 10 ° within the dykes and become scattered from 5 ° to 30 ° towards the border (from ∼20 m to the border). The
anisotropy degree is not spatially organized across the dykes, and varies from 1.01 to 1.101. A particular attention has to be paid to the variations of the shape parameter, especially along the Arradon dyke. The magnetic ellipsoid is prolate (T < 0) in the central part of the dyke and becomes oblate (T > 0) towards the borders (Fig. 7), where the magnetic fabrics is therefore in agreement with the planar mineral preferred orientations (Fig. 2b). This spatial organisation of the shape parameter is not so clearly depicted by in the Ile aux Moines dyke (Fig. 7).
Fig. 7. : Cross sections through the Arradon and the Ile aux Moines dykes showing the variations of K1 declination (°), K1 inclination (°), anisotropy degree (Pj) and shape
parameter (T) across the dykes. Black dots are AMS sites projected on the cross-sections with respect to their distance to the border of the dykes. On the diagrams, the grey surfaces
represent the mean variation of the different parameters. The errors bars correspond to the confidence parameter (α95min).
4. Gravity study of the Carnac Complex
In order to constrain the shape and possible feeder zones of the Carnac pluton, the geometry of the dykes, and the structural relationships between the pluton and the dyke swarm, we carried out a gravity study. The gravity coverage of the Morbihan area available from the “Banque Gravimétrique de la France” was not sufficient to perform a detailed gravity modelling with respect to the complicated cartographic shape of the Carnac Complex. Therefore, 243 new gravity stations have been surveyed, leading to an average coverage of one gravity measurement per square kilometre on an area enclosing the Carnac Complex within 3–4 km of surrounding host rocks. The station locations are displayed on Fig. 8d. The gravity measurements were concentrated to the west of the Golfe du Morbihan, where the pluton and the dyke swarm of the Carnac Complex are both well developed. In addition, a high-resolution gravity transect was measured across the Ile aux Moines dyke and
surrounding migmatites, perpendicularly to its NNE-SSW direction. Along the transect, gravity stations were located every 200 m, with a higher resolution of 1 station every 100 m at the narrowest part and within the dyke (Fig. 8d).
Fig. 8. : Main results of the gravity survey. (a) In grey levels, the regional Bouguer anomaly, compared to the regional Moho undulations (black thick lines); (b) Complete Bouguer
anomaly of the study area resulting from the combination of our new gravity data and the available gravity data from the BGF French gravity database; (c) resulting residual Bouguer anomaly, mostly influenced by the density heterogeneities located in the first kilometres below the topography. Given are the profile locations of Fig. 9. Black dots correspond to our gravity measurements, grey dots come from the BGF.
4.1. Gravity data acquisition and positioning
Measurements were collected using a Scintrex CG3-M microgravimeter previously calibrated at the “Bureau International des Poids et des Mesures” (BIPM). In the field, the measurements were tied to the CGF 65 French gravity base network. For the gravity stations measured in the pluton, the stations were positioned on IGN geodesic benchmarks, with a vertical accuracy better than 1 m. For the gravity transect across the Ile aux Moines dyke, the stations were positioned using differential GPS, with a vertical accuracy better than 0.5 m.
The gravity anomaly was reduced to the Hayford-1930 ellipsoid. The complete Bouguer anomaly was obtained after successively performing the free air, plateau and terrain corrections. A Bouguer reduction density of 2.6 (i.e. close to a typical granite density) was used. On the field, inner terrain corrections were estimated up to 50 m, using Hammer (1939) charts. Additional terrain corrections, out to a distance of 167 km, were computed using Geosoft in three zones of increasing radius 50 m–3 km, 3–10 km and 10–167 km using three DEMs gridded at 50 m, 250 m and 1 km respectively. Taking into account the accuracy of the network (0.1 mGal), the repeatability of the gravity measurements (0.015 mGal), the vertical positioning (0.2 mGal or 0.1 mGal on the detailed profile across the dyke), and the error on terrain corrections (0.1 mGal), the total RMS error on the complete Bouguer anomaly is 0.25 mGal (or 0.17 mGal across the Ile aux Moines dyke). Our new gravity data were then integrated to the available gravity data from the “Banque Gravimétrique de la France” and interpolated on a 300 m regular grid using a standard minimum curvature algorithm, yielding the complete Bouguer anomaly map of Fig. 8b.
4.2. Residual Bouguer anomaly
In order to highlight the gravity anomaly related to the Carnac Complex, and since the short wavelengths of the gravity anomaly result from shallower bodies (down to a few kilometres), the long wavelengths of the gravity anomaly, have been removed from the complete Bouguer anomaly. At the scale of the entire French Massif Armoricain, a regional Bouguer anomaly has been computed from the BGF French gravity database. After several trials, the long wavelengths of the gravity anomaly, produced by deep structures, such as the Moho interface, have been extracted using a 150 km Butterworth low-pass filter. Fig. 8a shows the filtered regional Bouguer anomaly, which approximately matches the regional Moho depth variations, in particular in our study area. Removing the regional field to the complete Bouguer anomaly results in the residual Bouguer anomaly of Fig. 8c, which thus mainly reflects the density heterogeneities located in the first kilometres below the topography.
The negative anomalies can be correlated to the granitic bodies, namely the Ste-Anne d‟Auray magmatic Complex and the Carnac Complex in the northeast and in the southwest of the study area, respectively (Fig. 8c). The gravity study of the Ste-Anne d‟Auray magmatic complex is beyond the scope of this survey, therefore hereafter our discussion will focus on
the Carnac Complex. The negative anomaly associated to the Carnac Complex exhibits an asymmetric shape elongated along the WNW-ESE trend. The western part of the Carnac Complex displays the highest negatives anomalies suggesting thickening of the Carnac granite to the west than to the east (Fig. 8c). Positive anomalies can be correlated to the presence of migmatites. The WNW-ESE elongated migmatites domain located between the Carnac Complex and the Ste-Anne d‟Auray magmatic complex, and to the east, the Golfe du Morbihan migmatitic area are both outlined by strong positive anomalies (Fig. 8c).
In order to emphasize the contact between the Carnac Complex and the migmatitic host rock, the vertical gradient of the residual Bouguer anomaly was computed. The negative gradients can be correlated to the presence of granite; conversely, the positive gradient can be correlated to the presence of migmatites. To the south of the Carnac Complex, despite the presence of the sea, preventing the acquisition of additional gravity data far away from the Carnac
Complex, several gravity stations constrain the location of the southern boundary between the Carnac Complex and the migmatite host rock. In general, this boundary exhibits well-defined gradients, which suggest steep contacts between the two geological formations. Details of the Carnac Complex geometry such as the NNE-SSW trending indentations in the northern part of the Carnac Complex are reflected in the map of the vertical gradient (Fig. 8d). It is worth noting that the gravity anomalies are not located directly above the indentations but are rather shifted westward, suggesting a westward dip of the NNE-SSW striking Carnac Complex borders.
4.3. 2D gravity modelling of the Carnac Complex
4.3.1. Modelling constraints
In order to propose the most realistic gravity model, forward modelling of the gravity data was performed, taking into account the geological field observations, the available geological maps, and density measurements of the formations encountered in the study area.
Representative densities for all the geological formations have been measured by the double-weighing method. Results are summarized in Fig. 9. An average density of the Carnac granite was obtained using 6 samples taken within the pluton and the dyke swarm. The average calculation clusters around 2.64 g/cm3, with quite similar densities for the 6 samples, showing that the density is very constant along the Carnac Complex. Moreover, there is no density difference between the pluton and the dyke swarm. At the scale of the study area, the calculation of a representative average density for the migmatites is complicated by the lithological heterogeneity of the protolith. A weighted average density of 2.72 g/cm3 was obtained for the migmatites taking into account the relative proportion of the different migmatitic rock-types encountered in the field.
Fig. 9. : Forward 2.5D gravity modelling of the Carnac Complex along WNW-ESE and NNE-SSW cross-sections showing the typical geometry of the Carnac Complex with several deep zones interpreted as feeder zones of the pluton. Modelled density values are provided.
The relatively high-density contrast between the two main geological formations (i.e. Carnac Complex and migmatites) gives a good confidence in the modelling of the granite. Modelling tests show that uncertainties of 0.01–0.02 g/cm3 on the density contrast between the Carnac granite and migmatites shift the bottom interface of the granite of less than 500 m, without changing its overall shape.
4.3.2. 2D modelling
The 2D models were performed across the Carnac Complex along WNW-ESE and ENE-SSW trending profiles. A high-resolution modelling of the Ile au Moines dyke was also performed. The location of the profiles is displayed on Fig. 8d. The models were computed in “2.5D”, which means that extension of the bodies perpendicularly to the profiles can be controlled. In order to avoid edge effects, the models were extended about 20 km on each end of the profiles to take into account the influence of nearby geological formations.
The WNW-ESE trending A and B profiles are parallel to the direction of the Carnac Complex elongation, and to the regional stretching, and perpendicular to the dyke direction. Profile A provides an overall image of the Carnac Complex depth variations from west to east, already suggested by the residual Bouguer anomaly. Profile B aims to model the geometry of the NNE-SSW trending indentations. Profile C trends NNE-SSW perpendicular to the elongation of the Carnac Complex and was modelled in order to better constrain the A and B profiles. Profile D aims to characterize the shape, dip, and vertical extent of the Ile aux Moines dyke.
The most striking feature of our 2D models is the thickness variation of the Carnac Complex (Fig. 10). Gravity models along the WNW-ESE trending A and B profiles both underline an overall eastward thinning of the Carnac Complex, which complies with the eastward decrease of the gravity anomaly (Fig. 8c). Furthermore, several deepening zones can be outlined on both profiles. In profile A, the depth of these deep zones ranges from ∼5 km to the west to ∼2.5 km to the east, which is in the range of the thickness obtained for the deep zones on the west of the profile B. Profile B shows a general picture of the NNE-SSW indentation
geometry displayed on the northern boundary of the Carnac Complex. To the east of the profile, the deep zones are shallower than to the west, and dip to the west, parallel to the dykes exposed at the surface. In both profiles, the deep zones and the indentations located to the SE are slightly dipping westward. The NNE-SSW trending profile C shows rather
important thickness variations of the Carnac Complex. Along this profile, the deep zones are vertical. On profile D, the Ile aux Moines dyke dips 50–60 ° to the west, with a width around 500 m and a maximum depth around 1.5 km.
Despite the relatively smooth amplitude variations of the measured anomaly, significant thickness variations of the Carnac Complex are necessary to fit the gravity anomaly. This irregular geometry is recognized in all the gravity profiles constructed in the Carnac Complex (Fig. 9). The models show a good agreement between the modelled and measured gravity data, except in profile D for the positive anomaly located east of the Ile aux Moines dyke (Fig. 9, profile D). Field observations have shown that the migmatites derive from various protoliths, which is responsible for large variations around the average value of 2.72 g/cm3 for the bulk migmatites. However, the cartographic extent of these rocks is not well constrained at the surface (i.e. on the map) due to poor outcropping conditions, and therefore we chose not to individualize them in our modelling. These models are possible solutions that i) transcribed the measured anomalies and ii) are supported by field observations, structural measurements and the geological maps (e.g. Augier et al., in press).
5. Interpretations and discussion
5.1. Significance of the magnetic fabric
According to the magnetic mineralogical investigations, biotite appears as the main carrier of the magnetic susceptibility. Therefore, the magnetic fabrics measured within the magmatic complex during the AMS survey can be directly correlated to the magmatic fabrics of the main granite body. Within the magmatic complex, the magnetic lineation clusters around two perpendicular directions (Fig. 5b). Taking into account the regional consistency of the AMS lineation with the regional WNW-ESE stretching structures (Fig. 1b), the WNW-ESE magnetic lineation likely developed during the regional deformation. Conversely, the NNE-SSW striking lineation is parallel to the dyke trend, thus the acquisition of this magnetic linear fabric cannot be interpreted as a response to a WNW-ESE stretching, but rather to magmatic flow during dyke emplacement.
These two sets of magnetic lineation directions are also highlighted by the detailed AMS study across two large-scale dykes (Fig. 6 and Fig. 7). In the core of the dykes, the AMS prolate fabrics are dominated by a WNW-ESE lineation interpreted also as the result of the regional stretching. Within 20 m of the dyke margins, the shape of AMS ellipsoid becomes oblate, and the magnetic foliation becomes parallel to the margin (Fig. 6). Moreover, when approaching the dyke walls, the mean magnetic lineation shows an orientation close to NNE-SSW, i.e. parallel to the dyke strike, but with a variable dip (Fig. 6 and Fig. 7).
It has been previously reported that the larger face of the platy magnetic minerals such as biotite, tends to be oriented parallel to the dyke walls during the magmatic filling of a dyke (e.g. [Ellwood, 1978] , [Rochette et al., 1991] , [Raposo, 1997] and [Herrero-Bervera et al., 2001] ). Site 41, located in a ∼15 m-thick dyke, illustrates well such a magnetic pattern (Fig. 10). It shows a typical oblate fabric with well-grouped K3 and largely variable K1. Being consistent with the margin geometry, its vertical foliation may suggest that the magnetic fabric was acquired during dyke filling, and thus it is controlled rather by the magmatic flow along the border than by the regional deformation (Fig. 10). These results are consistent with previous AMS studies from mafic dykes ( [Geoffroy et al., 2002] and [Callot and Guichet, 2003] ), and also acidic dykes (e.g. Talbot et al., 2005b). Following this view, the NNE-SSW trending magnetic lineations measured within the magmatic complex could be interpreted as the evidence of the presence of dykes within the pluton, even if they are not entirely mapped due to poor outcropping conditions (Fig. 10). Moreover, in the dykes, the representative AMS foliation within dykes is flat-lying with a low dip lineation (Fig. 6). The presence of sub-horizontal fabrics within the main pluton does not preclude the existence of dykes, even if these bodies are not recognized in the field.
Fig. 10. : Three dimensional schematic representation of the Carnac Complex showing the main structural features inferred from AMS and gravity surveys, microstructural observations of the Carnac granite and dyke (numbers refer to AMS sites). The close up is a block diagram illustrating the magnetic fabric within a dyke in which two representative AMS data sites located at the dyke centre and margin are depicted. The NNE-SSW trending indentations of the Carnac pluton are lateral equivalent of the dykes widespread to the east of the Carnac Complex. Thick arrows represent interpreted magma flow during the Carnac pluton emplacement.
5.2. Interpretation of the gravity models
As suggested by the geological map (Fig. 1b), the gravity study shows that the pluton in the western part of the magmatic complex (Fig. 9 profiles A and B), spatially evolves to a dyke swarm well exposed in its eastern part (Fig. 9 profile B). The residual Bouguer anomaly (Fig. 8c) shows that the complex presents an overall eastward thinning. This is supported by the gravity models, showing that the pluton thickness decreases from ∼5 km to ∼1 km from west to east, respectively. In these models, the pluton floor adopts an irregular geometry, highlighting several deep zones characterized by a high-angle westward dip.
As indicated by the projection of profile B on profile A, in the western part of the complex (Fig. 9), the deep zones displayed on both profiles can be laterally correlated. Again, the main pluton floor consists of an irregular surface made by the alternation of several deep and shallow zones elongated along the NNE-SSW direction. The NNE-SSW trending profile also shows important depth variations of the Carnac pluton floor (Fig. 10, profile C). This suggests that the deep zones are not straight along the NNE-SSW direction but undulated. Whatever their exact geometry, these deep zones are interpreted as the feeder zones of the pluton.
5.3. Architecture and emplacement model of a syntectonic magmatic complex
The new gravity and AMS results constrain the Carnac Complex overall shape at depth. These data allow us to determine with a good precision the spatial extent and relative proportion of the pluton and dyke swarm, from west to east of the complex.
To the west, the geological map (Fig. 1b) shows that the dykes are rare. The steeply dipping WNW-ESE magnetic lineation is well developed in the western sector of the pluton (Fig. 5b). This magnetic fabric pattern, which is spatially correlated with the deep zones outlined by the gravity models, is consistent with the existence of the pluton feeder zones in the western part of the complex (Fig. 10). Such evidence of steep lineations, associated with a deepening of the pluton floor, is classically interpreted as significant of the presence of feeder zones (e.g. [Guillet et al., 1985] , [Vigneresse, 1995] , [Améglio et al., 1997] and [Vigneresse and Bouchez, 1997] ).
The northwestern margin of the complex shows NNE-SSW indentations that can be interpreted as apexes of the pluton or dykes (Fig. 1b). In map view, the NNE-SSW indentations are comparable to the largest dykes outcropping eastward in the Golfe du Morbihan area. Related to these indentations, a steep westward dip of the granite–migmatite interface may be suggested by the vertical gradient map of the residual Bouguer anomaly (Fig. 8d), which is similar to the Ile aux Moines dyke dip attitude (profile D in Fig. 9). Based on these observations, the NNE-SSW indentations are interpreted as dyke contributions. Therefore, the central part of the complex might be constituted by the merging of a pluton and NNE-SSW trending dykes (Fig. 10). The presence of dykes in this part of the complex is also documented by the AMS survey showing numerous NNE-SSW trending magnetic lineations within the pluton (Fig. 5b). The structural and chronological relationships between the pluton and the dykes will be discussed below.
To the east, where the pluton gets thinner (Figs. 9c and 10), the AMS fabric measurements suggest the presence of a great amount of dykes, since the magnetic linear fabric show low dip attitude (Fig. 5b). This assumption is supported by the gravity modelling along the eastern part of the profile B (Fig. 9). There, the Carnac Complex might be constituted by the
coalescence of numerous NNE-SSW oriented dykes, rather than by a single pluton (Fig. 10). Due to poor outcropping conditions, the dykes are not mapped; however, more to the east, towards the Golfe du Morbihan, dykes progressively become individualized, as shown in the geological map (Fig. 1b).
As described above, the microstructures of the granitic complex formed under super-solidus (i.e. magmatic) to sub-solidus conditions. Magmatic microstructures are widespread in places where feeder zones of the pluton have been identified by the gravity and AMS surveys (Figs. 2c and d and 10). Thus, in the feeder zones, the magnetic fabric which is consistent with a regional WNW-ESE stretching, likely developed during a magmatic flow. Within the dykes, the magnetic fabrics are also consistent with a regional WNW-ESE stretching, but conversely to the pluton, the dykes experienced a solid-state deformation developed in a later mylonitic stage, as documented by the ca. 302–300 Ma 40Ar/39Ar ages obtained on white micas (Turrillot, 2010). This microstructural study is consistent with field structural observations, showing that some dykes are penetratively deformed, with a WNW-ESE mineral elongation, which is interpreted as the result of a ductile stretching.
Based on the AMS, gravity modelling, field structural analyses, and microscopic textural observations, an emplacement model can be proposed for the Carnac Complex (Fig. 10). During the regional tectonics, large extensional fractures, forming the feeder zones of the Carnac pluton, opened perpendicular to the WNW-ESE regional maximum stretching. From a metamorphic study of the Golfe du Morbihan migmatites, Brown and Dallmeyer (1996) proposed that the complex emplaced under pressure and temperature conditions of ∼4 kbar and 700–750 °C, respectively. Since the feeder zones deepen to ∼5 km from the present exposed level, the paleo-depth of the feeder zones can be bracketed at ∼15 km. The stretching of the crust solved the “room problem” (Bowen, 1948) and allowed a large volume of magma to raise through the feeder zones from a ∼15 km deep level. From these injection zones, the magma gathered to give rise to a single pluton in the western part of the complex (Fig. 10). In an extensional tectonic setting, a similar mechanism of pluton construction has been proposed by D‟Eramo et al. (2006) to account for the formation of the El Hongo pluton in the Sierras Pampeanas of Argentina. In the Variscan Central Iberian Massif, the Carboniferous
Extremadura batholith also provides an example of pluton emplacement in relation with shearing in an extensional setting (e.g. Fernandez and Castro, 1999). The westward steep dip of the magnetic lineation that developed during a magmatic flow, and the overall westward steeply dipping attitudes of the feeder zones suggest that the magma migrates eastward during the pluton formation (Fig. 10). For the eastward parts of the complex, the migration might be explained by an overall top-to-the-ESE sense of shear. The eastward dyke migration would be coeval with fracturing migration. Thus, new magma batches would infill the voids opened to the east. Furthermore, fracturing of the pluton country rock might be enhanced by the overall cooling of the Carnac granite and surrounding migmatites during the coeval exhumation of the Lower Unit (Brown and Dallmeyer, 1996) that induced a change in the crustal rocks rheology. Then, part of the WNW-ESE regional stretching was accommodated by the opening of large-scale “tension gashes” coevally infilled by the Carnac granite, which resulted in the formation of a pervasive dyke swarm. Strain is also pervasively accommodated by the ductile deformation that concentrated into the dykes during and after the crystallisation of the granite, leading to the solid-state deformation microstructures and sub-horizontal magnetic fabric acquisition within the dykes. A possible gentle tilting of the entire Carnac Complex after its emplacement can not be excluded since most of the dykes present a steep westward dip (i.e. 82 ± 8 °). Furthermore, the observed subsequent solid state of deformation which is
particularly developed over the main shear zones may have produced a limited rotation by simple shear. Considering the additive contributions of rigid titling and pervasive simple shear and on the basis of the only criterion of the non vertical attitude of the dykes, rotation did not exceeded ca. 8 °.
5.4. Regional tectonic implications
The South Armorican Domain experienced a WSW-ENE orogen-parallel extensional tectonics during its late evolution. The WNW-ESE extensional tectonics is regarded as responsible for the formation of ductile shear zones (i.e. QSZ and SSZ in Fig. 1b) that favoured the exhumation of the Lower Unit ( [Gapais et al., 1993] , [Brown and Dallmeyer, 1996] and [Turrillot et al., 2009] ). The WNW-ESE trending South Armorican Shear zone may have played the role of a transfer fault that guided the tectonic escape of the South Armorican Domain (Fig. 10). The Carnac Complex emplaced at ca. 319 ± 6 Ma, before the onset of the top-to-the-ESE ductile shearing along the SSZ at ca. 300 Ma ( [Turrillot et al., 2009] , [74] and [4] ). The WNW-ESE elongated shape of the Carnac Complex is consistent with a regional WNW-ESE stretching coeval with its emplacement since this direction can be recognized at the magmatic state in the Carnac granite, in the host rock as controlling the
opening of the dykes, and in the mylonites along the SSZ (Turrillot et al., 2009). The overall shape of the Carnac Complex is similar to that of the Variscan Saint-Sylvestre leucogranitic pluton in the French Massif Central. It has been shown that this ∼5 km thick pluton is a syntectonic body characterized by a NW-SE stretching lineation, and several NE-SW striking feeder zones. The pluton shape and internal fabrics argue for its emplacement coeval with a regional late-orogenic extensional tectonic setting ( [Faure and Pons, 1991] and [Faure, 1995] ).
In the Carnac Complex, the sub-horizontal planar fabric argues for a vertical maximum shortening axis (Z-axis of the finite strain ellipsoid, Fig. 10) which is consistent with an overall extensional tectonics. The emplacement of the Carnac Complex dyke swarm can thus be considered as the earliest increment of the orogen-parallel extensional tectonics highlighted in the Morbihan area. Inception of extensional tectonics thus dates back to ∼320 Ma and may ends at about 302–300 Ma while strain concentrated over large-scale shear zones ( [Turrillot et al., 2009] and [74] ).
6. Conclusion
The Carnac Complex, which consists of a pluton associated to a well-developed dyke swarm, was emplaced in the Late Carboniferous times during the late-orogenic extensional tectonics that has been recognised in most parts of the European Variscan belt. Extensional tectonics, are generally attested by the development of low angle detachment faults, synkinematic plutons, gneiss domes and intramontane basins. To date, in the Massif Armoricain, the age of this event relies on rare radiochronological studies performed on mylonites ( [4] and [74] ) or on conventional thermochronological analyses (Brown and Dallmeyer, 1996). The AMS survey of the Carnac Complex documents the relationships between the early record of regional extension and the magmatic fabrics. This AMS study also outlines the geometric consistency of the magnetic fabrics developed during the magmatic flow processes within the dykes and the pluton. The gravity study provides a model of the overall shape of the
magmatic complex displaying a clear eastward thinning. These two geophysical approaches allowed us to describe the overall architecture of a magmatic complex which emplacement is constrained by regional extensional tectonics. At depth, several deep zones, interpreted as the pluton feeder zones have been highlighted in the western part of the complex, whereas in the eastern part, the complex seems to be constructed by the coalescence of numerous dykes. The magnetic fabric as well as the microstructural characteristics of the pluton and dykes led us to propose an emplacement model in a crustal stretching context. The magma of the Carnac pluton spread eastward in response to a possible top-to-the-ESE pervasive shearing. Within an extensional tectonic setting, and coevally with the overall cooling of the crust, the magma rise was channelized along large-scale tension gashes. The shape of the Carnac Complex and its internal fabrics are consistent with a WNW-ESE stretching of the crust. The Carnac Complex emplacement then appears to be the earliest insight of the Variscan extensional tectonics highlighted in the Morbihan area and the South Armorican domain. This study provides a new example of the complex pluton-dyke relationships emplaced in a late-orogenic extensional setting. Although dykes surrounding a granitic pluton are often considered as the latest
manifestation of magma emplacement, the example of the Carnac Complex provides evidence that, at least in some cases, dyke coalescence might be a likely mechanism for pluton
construction.
The present manuscript benefited of the constructive reviews of Antonio Castro and anonymous reviewer that we would like to acknowledge. We gratefully acknowledge the IPGP, especially M. Diament for the loaning of the gravimeter. The gravity figures and 2.5 models were realized with Geosoft/GM-SYS software.
References
Améglio et al., 1997 L. Améglio, J.-L. Vigneresse and J.-L. Bouchez, Granite pluton geometry and emplacement mode inferred from combined fabric and gravity data, J.-L. Bouchez, D.H.W. Hutton, W.E. Stephens, Editors , From Segregation of Melt to
Emplacement Fabrics, Kluwer Academic Publishers, Dordrecht-Boston-London (1997), pp.
199–214 in Granite.
Audren, 1987 Audren, C., 1987. Evolution structurale de la Bretagne méridionale au Paléozoïque, Ph.D. thesis, Université de Rennes 1, Rennes, pp. 365..
Audren and Le Métour, 1976 C. Audren and J. Le Métour, Mobilisation anatectique et déformation. Un exemple: les migmatites du Golfe du Morbihan (Bretagne méridionale).
Bulletin de la Société géologique de France, 4 (1976), pp. 1041–1049.
Augier et al., in press Augier, R., Menier, D., Van-Vliet-Lanoë, B., Hallegouët, B., Chauris, L., Turrillot, P., Carn, A., Thinon, I., in press. Notice explicative de la carte géologique de la feuille Vannes Saint-Gildas de -Rhuys à 1/50000..
Baker, 1998 D.R. Baker, The escape of pegmatite dikes from granitic plutons: constraints from new models of viscosity and dike propagation. The Canadian Mineralogist, 36 (1998), pp. 255–263.
Ballèvre et al., 1994 M. Ballèvre, J. Marchand, G. Godard, J.-C. Goujou and R. Wyns, Eo-Hercynian events in the Armorican Massif, J.D. Keppie, Editor, Pre-Mesozoic Geology in
France and Related Areas, Springer, Berlin (1994), pp. 183–194.
Ballèvre et al., 2009 M. Ballèvre, V. Bosse, C. Ducassou and P. Pitra, Palaeozoic history of the Armorican Massif: models for the tectonic evolution of the suture zones. Compte Rendus
Géoscience, 341 (2009), pp. 174–201.
Bartley et al., 2006 J.M. Bartley, D.S. Coleman and A.F. Glazner, Incremental pluton emplacement by magmatic crack-seal. Transactions of the Royal Society of Edinburgh:
Earth, 97 (2006), pp. 383–396.
Berthé et al., 1979 D. Berthé, P. Choukroune and P. Jégouzo, Orthogneiss, mylonite and non coaxial deformation of granites: the example of south Armoricain shear zone. Journal of
Structural Geology, 1 (1979), pp. 31–42.
Borradaile, 1988 G.J. Borradaile, Magnetic susceptibility, petrofabrics and strain.
Tectonophysics, 156 (1988), pp. 1–20.
Borradaile and Henry, 1997 G.J. Borradaile and B. Henry, Tectonic applications of magnetic susceptibility and its anisotropy. Earth Science Reviews, 42 (1997), pp. 49–93.