Cerebral Cortex June 2008;18:1444--1454 doi:10.1093/cercor/bhm180
Advance Access publication October 12, 2007
Mapping the Early Cortical Folding
Process in the Preterm Newborn Brain
J. Dubois1, M. Benders1,2, A. Cachia3, F. Lazeyras4, R. Ha-Vinh Leuchter1, S. V. Sizonenko1, C. Borradori-Tolsa1, J. F. Mangin5 and P. S. Hu¨ppi1,6
1
Department of Pediatrics, Geneva University Hospitals 1211, Geneva 4, Switzerland,2Department of Pediatrics, Wilhelmina Children’s Hospital, Lundlaan 6, 358 4 EA, Utrecht, Netherlands, 3
U797, Inserm-CEA, SHFJ, IFR49, University Paris-Sud and University Paris 5, Orsay, France,4Department of Radiology—CIBM, Geneva University Hospitals, CH-1211, Geneva 14, Switzerland,5Neurospin, I2BM, CEA, Saclay, France and6Department of Neurology, Children’s Hospital, Harvard Medical School, Boston, MA 02115, USA
In the developing human brain, the cortical sulci formation is a complex process starting from 14 weeks of gestation onward. The potential influence of underlying mechanisms (genetic, epigenetic, mechanical or environmental) is still poorly understood, because reliable quantification in vivo of the early folding is lacking. In this study, we investigate the sulcal emergence noninvasively in 35 preterm newborns, by applying dedicated postprocessing tools to magnetic resonance images acquired shortly after birth over a developmental period critical for the human cortex maturation (26--36 weeks of age). Through the original three-dimensional reconstruction of the interface between developing cortex and white matter and correlation with volumetric measurements, we document early sulcation in vivo, and quantify changes with age, gender, and the presence of small white matter lesions. We observe a trend towards lower cortical surface, smaller cortex, and white matter volumes, but equivalent sulcation in females compared with males. By precisely mapping the sulci, we highlight interindividual variability in time appearance and interhemispherical asymmetries, with a larger right superior temporal sulcus than the left. Thus, such an approach, included in a longitudinal follow-up, may provide early indicators on the structural basis of cortical functional specialization and abnormalities induced by genetic and environmental factors.
Keywords: cortex, gyrification, newborn, premature, sulcus
Introduction
In the adult human brain, the cortical sulci morphology is highly variable among individuals, and is partly related to the functional organization of areas (Ono et al. 1990; Welker 1990). So far, several hypotheses have been put forward on the mechanisms that underlie the folding process during de-velopment, but the potential influence of genetic, epigenetic, and environmental factors is still poorly understood. According to postmortem observations of fetal brains (Feess-Higgins and Laroche 1987), the primary folds would form in a relatively stable spatio-temporal way during intrauterine life depending on physical constraints and mechanical factors (Regis et al. 2005). An attractive theory suggests that the specific location and shape of sulci are determined by the global minimization over the brain of the visco-elastic tensions from white matter fibers connecting cortical areas (Van Essen 1997; Hilgetag and Barbas 2005, 2006). This may explain why specific abnormal-ities in the sulcal pattern are observed in certain brain developmental disorders that are the result of subtle impair-ments in the neuronal migration and setting up of cortico-cortical connections (Le Provost et al. 2003; Molko et al. 2003; Van Essen et al. 2006).
However, evidence supporting this theory in relation to the human brain is currently lacking, and reliable measurements on the normal sulci formation may only be obtained in vivo because postmortem studies may be influenced by deforma-tions of fixed brains and are intrinsically limited for longitudinal follow-ups. Besides, magnetic resonance imaging (MRI) has opened up the possibility to quantify this cortical development in vivo in the human newborn brain (Hu¨ppi et al. 1996; Hu¨ppi and Inder 2001), given its noninvasiveness, the provided contrast between cerebral tissues and the opportunity to analyze quantitatively the resulting images.
In this study, we thus investigated the emergence of the cortical foldings in the preterm newborn brain, by applying dedicated postprocessing tools to high-quality MR images acquired shortly after birth over a developmental period critical for the human cortex development (26--36 weeks of gestational age [GA]). For the first time, the interface between the developing cortex and white matter zone was reconstructed coherently in three-dimensional (3D) using an original approach, which enabled a quantitative and in vivo mapping of the individual sulci appearance. We defined a sulcation index (SI) and measured tissue volumes whose variations with age, gender, and presence of small white matter lesions (in-ducing none or mild white matter abnormality at term equivalent age) were evaluated. Besides, we highlighted early interhemi-spherical structural asymmetries in sulci development that may be related to the cortical functional specialization or alteration.
Materials and Methods
Subjects
Thirty-five preterm newborns (mean GA at birth: 30.0± 2.5 weeks, range: 25.6--35.6 weeks; 16 females, 19 males) were included in this study after their parents gave written informed consent. The MRI examination was performed as soon as possible after birth (mean GA at MRI: 31.1±2.4 weeks, range: 26.7--35.7 weeks), and the protocol was approved by the local ethical committee. The newborns were classified into 2 groups according to the presence or absence of white matter abnormalities detected on MRI examinations performed at birth and at term equivalent age. Ten examinations were included in the ‘‘lesion’’ group and 25 in the ‘‘normal’’ group (Table 1). All white matter lesions described at birth (mostly subependymal hemorrhage and periven-tricular lesions) were small (of limited spatial extent, even punctual) and localized in both cerebral hemispheres (Table 2). None or mild white matter abnormalities resulting from these lesions were detected at term equivalent age (Table 2). All newborns had a normal in-trauterine growth and were from a single pregnancy.
Data Acquisition
During MR imaging, no sedation was used and the newborns were spontaneously asleep. Special ‘‘mini-muffs’’ were applied on their ears to
minimize noise exposure. The study was conducted on a 1.5-T MRI system (Philips Medical Systems, Best, the Netherlands; Siemens Medical Systems, Erlangen, Germany). Coronal slices covering the whole brain were imaged by a T2-weighted fast spin echo sequence and
a 3D T1-weighted fast gradient recovery sequence, with a spatial
resolution of 0.730.731.5 mm3or 0.830.831.2 mm3.
Data Postprocessing
The human newborn brain maturation was evaluated by 2 comple-mentary approaches, which used distinct sequences of image postprocessing tools that enabled the quantification of the cortical sulci formation on one hand, and the measurement of the cerebral tissue volumes on the other hand. With in vivo MRI, the T2- and T1
-weightings and the spatial resolution preclude a distinction between the subplate and intermediate zones in the premature brain, whereas the contrast with the cortical plate is high (Kostovic et al. 2002) (Fig. 1a,b). Although neurons from the subplate zone are incorporated to the cortex by 36 weeks of GA (Kostovic et al. 1989; Kostovic and Rakic 1990), the subplate and intermediate zones are denoted together in the following ‘‘developing white matter zone’’, and the cortical plate is denoted ‘‘developing cortex’’ in order to be consistent with the nomenclature used in adult MRI.
Cortical Surface Reconstruction and Sulci Identification
For both hemispheres, the interface between the developing cortex and white matter zone, also called ‘‘inner cortical surface,’’ was
segmented and reconstructed in 3D from the T2-weighted images,
which yield the best contrast between cerebral tissues in the immature brain, through an original sequence of image postprocessing tools adapted from a sequence developed for the brains of adults (Mangin et al. 2004, http://anatomist.info) and fetuses (Cachia et al. 2003). It included a bias correction and successive semiautomatic segmentations of the intracranial cavity, of the brain and of the interface between cortical plate and white matter zone (Fig. 1c). These segmentations used mathematical morphology and a manual tuning of the parameters for each newborn, based on the reconstruction accuracy for the lateral, ventral, and vertex surfaces of the cortical plate, where most sulci of interest are localized. The segmentation of this inner surface corresponded to the mask of the developing white matter zone and included roughly the basal ganglia in the medial surface (at the level of the interhemispheric fissure and SF). The inner surface was used as it highlighted the cortical sulcation pattern more precisely than the outer surface, particularly where sulci are still not deeply folded. In the newborns with higher GA (>31 weeks GA), some manual corrections
of the segmentation were required around the central sulcus (CS) and at the level of the sylvian fissure (SF), because the increasing gyration and myelination caused partial volume effects and decreasing contrast in the image.
A smooth triangle-based mesh of the surface detected between the developing cortex and white matter zone was computed, and the global area of this inner cortical surface (S) was computed. Finally, the local surface curvature was estimated from the mesh local geometry (Cachia et al. 2003): positive curvatures correspond to the gyri top, and negative curvatures to the folds bottom.
The sulci were then defined as connected components of negative curvature. They were labeled manually according to postmortem atlases (Chi et al. 1977a; Feess-Higgins and Laroche 1987) and prenatal images (Garel et al. 2001). To characterize the sulci maturation with age, their areas (A) were calculated.
We computed for each newborn a SI, defined as the ratio between the areas of sulci from the lateral, ventral and vertex surfaces (except the SF and the medial surface) and the closed surface of the cortex. The closed surface of the cortex corresponded to a smooth envelope of the inner cortical surface mask obtained with a morphological closing of 10 mm. This surface increased with the age-related brain growth independently from the gyrification process. The SI thus characterized the proportion of sulci according to the whole brain size.
Brain Tissue Classification and Volumetric Measurements
Quantitative measurements of the cerebral tissue volumes were performed using a k-nearest neighbor classification, based on the MR signal intensity of the registered T2- and T1-weighted images, and on
anatomic location (Hu¨ppi, Warfield et al. 1998; Inder et al. 2005). The cerebrum was segmented into 5 separate tissue classes (Fig. 1d): developing cortex (cortical plate), basal ganglia/thalami, developing white matter zone (including the subplate and intermediate zones), myelinated white matter and cerebrospinal fluid. The myelinated white matter is only present in the midbrain and internal capsule at these GAs. The volume of each tissue was quantified. For the correlations with surface measurements, we focused on the volumes of the developing cortex (C) and white matter zone (W), because only these adjacent tissues were assumed to influence the sulcation process.
Statistical Evaluation of the Preterm Brain Structural Maturation
Age-Related Variations of Surface and Volumetric Measurements First, we investigated the effect of group and gender on the measure-ments of surface (S), SI, and cerebral tissue volumes (C, W), using linear models with GA at MRI as covariable.
Models of the Inner Cortical Surface and SI
Our original surface-based approach was further correlated with the conventional volumetric approach. Given previous studies (Zhang and Sejnowski 2000; Kapellou et al. 2006), we assumed that the inner cortical surface (S) is linked through a power law to the developing cortical volume (C), through the thickness of the cortical plate, and the
Table 1
Preterm groups: repartition of the newborns among the 2 groups (normal and lesion), with information on the gender repartition (F: female, M: male), and with corresponding GA (in weeks) at birth and at MRI
Group All Normal Lesion
Examination count 35 25 10
Gender repartition 16F, 19M 12F, 13M 4F, 6M
GA at birth
Mean ± SD 30.0 ± 2.5 weeks 30.3 ± 2.5 weeks 29.3 ± 2.5 weeks Range (min--max) (25.6--35.6 weeks) (25.6--35.6 weeks) (26.0--33.0 weeks)
GA at MRI:
Mean ± SD 31.1 ± 2.4 weeks 31.5 ± 2.4 weeks 30.1 ± 2.2 weeks Range (min--max) (26.7--35.7 weeks) (26.7--35.7 weeks) (27.3--33.4 weeks)
Table 2
Lesion group: description of white matter lesions for each newborn of the lesion group on the MR examination at birth, and scored characterization of the resulting white matter abnormality on the MR examination at term equivalent age (Woodward et al. 2006): white matter abnormality was graded according to 5 scales (white matter signal abnormality, loss in volume of periventricular white matter, cystic abnormality, ventricular dilatation, thinning of the corpus callosum), providing 4 categories of abnormality (scores 5--6: normal; scores 7--9: mild; scores 10--12: moderate; scores 13--15: severe).
Newborn number MR examination at birth: description of lesions MR examination at term: characterization of abnormality 1 Bilateral subependymal hemorrhage,
small left WM abnormality (frontal)
Normal (6) 2 Bilateral periventricular WM lesions
(gliotic/hemorrhagic)
Mild abnormality (8) 3 Bilateral periventricular WM lesions
(fronto-parietal)
Mild abnormality (7) 4 Right periventricular WM lesions Normal (6) 5 Bilateral punctual WM lesions
(fronto-parieto-occipital)
Normal (5) 6 Left hemorrhage (germinal matrix
and WM occipital)
Mild abnormality (7) 7 Left hemorrhage in subarachnoid (frontal) Normal (6) 8 Bilateral subependymal hemorrhage,
right periventricular hemorrhagic lesion (temporal)
Mild abnormality (8)
9 Bilateral subependymal, small intraventricular hemorrhage, small subependymal cyst
Normal (6) 10 Bilateral small subependymal hemorrhage,
right WM hemorrhage (occipital)
developing white matter zone volume that delimits this surface (W): S } C–1/3W(Zhang and Sejnowski 2000). A linear model for S on a logarithm scale (log(S)) was thus implemented with log(C) and log(W) as covariables, and group and gender as cofactors. In addition, the SI was modeled linearly with the inner cortical surface as covariable, and group and gender as cofactors.
Pattern of Sulci Development
In addition, we outlined the pattern and timetable of development for the distinct sulci, by describing the GAs for which each sulcus was identified for around 50% of the newborns and for more than 75%. For the quantitative analysis of sulci areas, 3 groups of sulci were considered: the CS, the parieto-temporo-occipital lobes (posterior to the CS, including the postcentral, intraparietal, parieto-occipital, superior and inferior temporal, and collateral sulci), and the frontal lobe (anterior to the CS, including the precentral, superior and inferior frontal, uncinate, and olfactive sulci). This enabled us to further decompose the SI into 3 components, for which a linear model was implemented, with age as covariable, and group and gender as cofactors.
Interhemispherical Asymmetries in Cortical Development
Finally, we assessed the differences in maturation between the right (R) and left (L) inner cortical surface and individual sulcal areas by calculating asymmetry indices: AI=(A(R)–A(L))/(A(R)+A(L)). First we evaluated whether these indices varied with age, group, and gender using a linear model. Second we tested whether the indices were significantly different from zero over the newborn group using one-paired Student t tests.
Results
Evaluation of the Preterm Structural Maturation
Inner Cortical Surface Reconstruction
From high-quality MR images of the brain (Fig. 1a), the interface between the developing cortex and white matter zone was identified in vivo semiautomatically for all preterm newborns (Fig. 1c). Despite the microstructure of this interface may be variable with age because of the disappearing subplate, we did not observe such changes because of MR contrasts and spatial resolution. Our original approach with mathematical morphology provided a 3D coherence of the segmentation over the brain, contrasting with conventional approaches based only on MR signal intensity. The resulting 3D reconstructions
of the inner cortical surface showed, for the first time in vivo, the dramatic increase in cortical sulcation with age (Fig. 2). Age-related Variations of Surface and Volumetric
Measurements
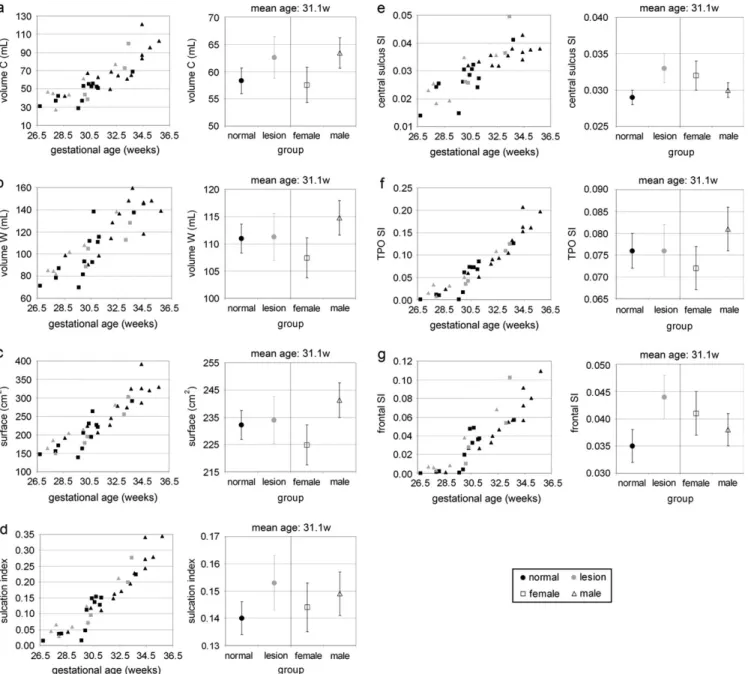
The volumes of developing cortex and white matter zone, the inner cortical surface, and the overall SI increased dramatically with GA after 30 weeks (Table 3, Fig. 3a--d). No group effect was observed among these parameters, and there was a non-significant trend towards a gender effect, with females having
smaller volumes of developing cortex (F = 2.0, P = 0.168,
Fig. 3a) and white matter zone (F=2.5, P=0.125, Fig. 3b), and lower surfaces (F=3.1, P=0.088, Fig. 3c). No difference in SI was observed between females and males.
Because the CS was present in all preterm newborns, and the parietal, temporal, occipital, and frontal lobes start gyration by 27 and 29 weeks GA, respectively, the SI was decomposed into 3 components. The age-related changes of the 3 resulting indices indicated that the sulci maturation progresses first at the level of the central region, second in the temporo-parieto-occipital lobe (posterior to the CS), and third in the frontal lobe (anterior to the CS) (Fig. 3e--g). Considering the linear models (Table 3), we observed a nonsignificant trend towards higher sulcation indices in the lesion group for the CS (F = 3.5, P=
0.069, Fig. 3e) and for the frontal lobe (F=3.8, P=0.059, Fig. 3g). Models of the Inner Cortical Surface and SI
Considering a logarithm scale, the linear model of the inner cortical surface showed a major influence of the developing cortical and white matter volumes, with no effect of group and gender (Table 3, Fig. 4a), indicating that the surface is linked to volumes in the same way among newborns. Besides, the SI was highly correlated with the inner cortical surface (Table 3, Fig. 4b). For similar surfaces, females tended to have higher SI than males (F=2.7, P=0.113, Fig. 4b), supporting the fact that there is no difference in SI between genders at equivalent age despite the lower cortical surface of females.
Insights into the Cortical Sulci Development
Cortical Foldings
The 3D coherence of the inner cortical surface provided a reliable mapping of the cortical sulci in 3D, which enabled to
Figure 1. Image postprocessing: (a, b) example of T2and T1images obtained in premature newborns of 28.1 and 34.4 weeks of GA. Note the absence of contrast between the
subplate and intermediate zones in the ‘‘developing white matter zone,’’ and the high contrast with the ‘‘developing cortex’’ (cortical plate). (c) Segmentation of the interface between the developing cortex and white matter zone resulting from T2images and defining the inner cortical surface. (d) Tissue classification resulting from T2and T1images
quantify their maturation through their areas. The sulci localized in the vertex, lateral, and ventral surfaces could be all manually labeled, whereas the sulci of the medial surface appeared roughly connected near the interhemispheric fissure (Fig. 5). As the onset of the folding process differed slightly between individuals, the timetable of their appearance is described in the right and left hemispheres in terms of GA for which the sulci is identified for 50% and more than 75% of preterm newborns (Table 4). Several sulci were identified in all newborns: the interhemispheric fissure and SF, the callosal sulcus (CaS), the parieto-occipital and calcarine fissures (POF, CF), the cingulum sulcus (CiS), and the CS. In the temporal
lobe, we observed the appearance of the superior and inferior temporal sulci (STS, ITS) between 27 and 32 weeks GA, and of the collateral sulcus (CoS) between 29 and 30 weeks GA. In the parietal lobe, the post-central sulcus (postCS) development was concomitant to the folding of intraparietal and parieto-occipital sulci (POS), from 27 to 31 weeks GA. In the frontal lobe, the pre-central sulcus (preCS) seemed to form between 29 and 30 weeks GA, from the fusion of 2 folds in the posterior regions of the superior and inferior frontal sulci (SFS, IFS). Finally, the uncinate sulcus (UnS) was identified at 30--31 weeks GA, and the olfactive sulcus (OlfS) in some newborns from 32 weeks GA onward. Statistical measurements on the individual sulcal
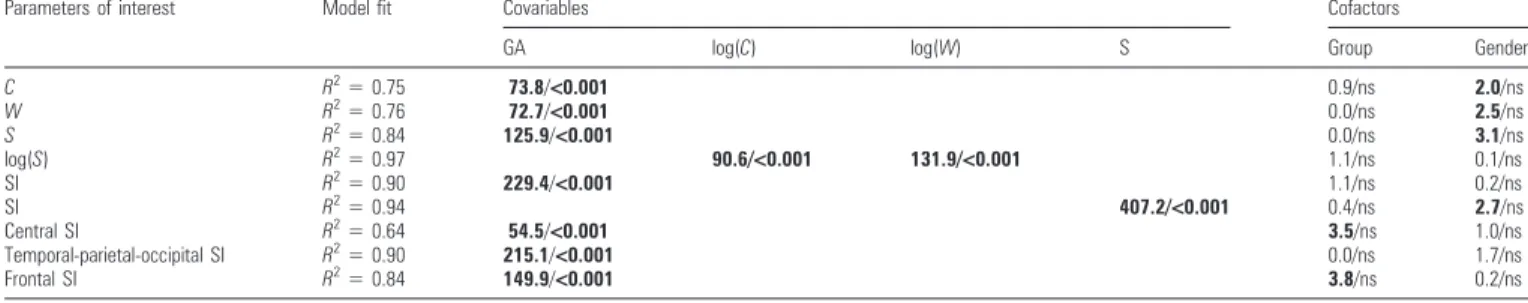
Table 3
Details of the statistical analyses: results of the linear models for the parameters of interest (cortical volume C, white matter volume W, inner cortical surface S, on a logarithm scale log(S), SI, CS, temporo-parieto-occipital, and frontal sulcation indices) according to covariables (GA at MRI, log(C), log(W), S) and cofactors (group, gender)
Parameters of interest Model fit Covariables Cofactors
GA log(C) log(W) S Group Gender
C R25 0.75 73.8/<0.001 0.9/ns 2.0/ns W R25 0.76 72.7/<0.001 0.0/ns 2.5/ns S R25 0.84 125.9/<0.001 0.0/ns 3.1/ns log(S) R2 5 0.97 90.6/<0.001 131.9/<0.001 1.1/ns 0.1/ns SI R2 5 0.90 229.4/<0.001 1.1/ns 0.2/ns SI R2 5 0.94 407.2/<0.001 0.4/ns 2.7/ns Central SI R2 5 0.64 54.5/<0.001 3.5/ns 1.0/ns Temporal-parietal-occipital SI R2 5 0.90 215.1/<0.001 0.0/ns 1.7/ns Frontal SI R2 5 0.84 149.9/<0.001 3.8/ns 0.2/ns
Note: Each line corresponds to a specific model. The fit quality is expressed for each analysis in terms of percentage of variance explained by the linear model (R2
). The influence of the specified covariable and cofactor is highlighted by the F- and P-values (F/P). Bold font denotes significant main effect (P \ 0.05) (ns: not significant).
Figure 2. Inner cortical surface reconstructions: examples of the 3D interface between the developing cortex and white matter zone for newborns of different GA (in weeks, left numbers) and SI (right numbers). The colors outline the surface curvature. The surfaces are not displayed with the same spatial scale.
surface area were then only performed for the central, superior temporal, collateral, uncinate, and olfactive sulci, as the other ones were connected together for most subjects.
Sulcal Interhemispherical Asymmetries
Quantitative interhemispherical asymmetry indices were cal-culated for these 5 sulci. Age had no effect on the indices. The index for the inner cortical surface depended on gender (linear model for the surface asymmetry index: R2 =0.3/F =4.4/P=
0.011, for the gender cofactor F=6.3, P=0.018): in females, the right surface was significantly larger than the left (one-paired
ttest for the index difference from zero over the female group:
t = 3.4, P = 0.004), whereas no difference was observed in
males. The group cofactor influenced the asymmetry index for the CS (linear model for the index: R2=0.23/F=3.2/P=0.037,
for the group cofactor F = 5.1, P = 0.032): there was no
asymmetry in the normal group, whereas, in the lesion group, there was a nonsignificant trend towards a smaller right CS compared with the left (one-paired t test for the index difference from zero over the lesion group: t=1.5, P=0.160). Finally, over all newborns, the area of the superior temporal sulcus was larger in the right hemisphere in comparison with the left (t=2.6, P=0.013).
Figure 3. Quantification of volumetric and surface-related parameters: (a--c) quantification of the developing cortical (a) and white matter zone (b) volumes, and of inner cortical surface (c). (d--g) Quantification of the SI defined globally (d), at the level of the CS (e), for the temporo-parieto-occipital (TPO) lobe (f), and for the frontal lobe (g). The left figures represent the parameter variations with GA. The right figures represent the parameter averages according to group (with standard error in plot bars), estimated by the models with age as covariable (mean age: 31.1 weeks). The 2 groups are outlined in colors (normal: black, lesion: gray), and the gender is highlighted through the point style (female: square, male: triangle).
Discussion
This study demonstrates the first in vivo report of early and quantitative measurements of cortical sulci in the preterm newborn brain, through the precise reconstruction of inner cortical surfaces from high-quality MR images and original postprocessing tools, over a developmental period that is critical for the human cortical folding process. The individual delineation of sulci enabled us to highlight a differential temporal maturation pattern according to brain spatial location, as well as interhemispherical asymmetries that may be related to the cortical functional specialization. The comparison of this original approach with conventional volumetric measurements further outlined the influence of gender and small brain white matter lesions (inducing no or mild white matter abnormalities at term equivalent age) on cortical development at birth.
Cortical Sulci Development
Cortical Surface Measurement
So far, no accurate 3D reconstruction of the developing human cortical surface has been possible, because low image resolution and contrast between the developing cortex and white matter precluded the application of postprocessing tools dedicated to the adult brain. In previous studies, Schierlitz et al. (2001) and Scifo et al. (2003) described surface reconstruc-tions for the fetal brain, but imaging constraints, related to fetus motion and mothers breathing, precluded the precise identi-fication of cortical sulci. Here we reconstructed the inner cortical surface of preterm newborns, defined as the interface between the ‘‘developing cortex’’ (cortical plate), and the subplate and intermediate zones. Because of the nomenclature in adult MR studies, these zones were called together
‘‘developing white matter zone’’, which is a misuse of language because the neurons from the subplate zone are incorporated to the cortex by 36 weeks of GA. Although the subplate activity is intense in the fetal brain between 22 and 36 weeks (Kostovic et al. 1989; Kostovic and Rakic 1990), the T2- and T1-contrasts get low between the subplate and intermediate zones after 27 weeks (Kostovic et al. 2002). It precluded us to distinguish these zones in premature newborns, which would have required the use of diffusion tensor imaging (DTI) (Maas et al. 2004; Huang et al. 2006). On the contrary, the cortical plate was clearly delineated, and its interface with the ‘‘developing white matter zone’’ showed a similar contrast across newborns of different ages, providing robust identifica-tion despite the subplate disappearing by 36 weeks. Whereas the outer cortical surface is generally used to map gyri and sulci in the adult brain (Mangin et al. 2004), the inner surface reconstruction was here preferred in the developing brain as it provided a clearer delineation of the folding.
Sulci Identification
We studied the first steps of sulcogenesis happening before term birth, by identifying cortical sulci on the inner cortical surface. We focused on the sulci of the lateral, ventral, and vertex surfaces, because the central gray nuclei and ventricles interfered with the reliable segmentation of the medial surface. The sulci were individually delineated according to their appearance, which made it possible to quantify their maturation.
Timetable of the Folding Process
In comparison with previous postmortem (Chi et al. 1977a; Feess-Higgins and Laroche 1987; Hansen et al. 1993) and prenatal MRI (Garel et al. 2001) descriptive studies, we observed equivalent sulci appearance over the brain in preterm
Figure 4. Models of the inner cortical surface and SI: (a) model of the cortical surface (S) with the developing cortical (C) and white matter zone (W) volumes on a logarithm scale. The left figures represent the variations of log(S) with log(C) and log(W). The right figure represents the average of log(S) according to group (with standard error in plot bars), estimated by the model with log(C) and log(W) as covariables (mean log(C): 1.75, mean log(W): 2.04). (b) Model of the SI with inner cortical surface. The left figure represents the index variation with surface. The right figure represents the index average according to group (with standard error in plot bars), estimated by the model with surface as covariable (mean surface: 233.4 cm2). The 2 groups are outlined in colors (normal: black, lesion: gray), and the gender is highlighted through the point style (female:
infants, but with slightly later appearance (Table 4). Actually, our automatic identification is most sensitive to the sulci indentation and depth, and small initial folds, like the olfactory sulcus, may be lost because of the limited given image spatial resolution. However, our approach overcomes the major limitations of postmortem evaluation (potential brain pathol-ogy, deformation of the tissues after death, and fixation). It can be included in a longitudinal follow-up, and further correlated with the later emergence of neurological functions. Some interindividual variability with age was observed, which may be due to the limited accuracy of the GA estimation, and to varying postnatal age with potential postnatal environmental effects. In the future, we will compare this early fold topology with longitudinal reconstructions at term equivalent age and in late childhood, in order to investigate whether a morphogenesis-based approach can highlight the maturation of initial fetal folds into complex sulcal patterns (Cachia et al. 2003; Regis et al. 2005).
Spatio-temporal Differences in Cortical Development Previous studies on human cortical folding in this early period were qualitative reports of spatio-temporal differences in sulci formation (Chi et al. 1977a; Feess-Higgins and Laroche 1987; Hansen et al. 1993; Garel et al. 2001). On the contrary, our approach provided quantitative markers. We found the highest sulcal index in the central region, followed by the temporo-parieto-occipital region, with the lowest SI in the frontal
region. With these quantitative measures, we confirmed the previous observations (Hansen et al. 1993) that the medial surface folds before the lateral surface, and that the morpho-logical differentiation of sulci begins in the central region, and progresses in an occipito-rostral direction. Over the last few years, such spatio-temporal differences in human brain maturation have been described in detail through the regional analysis of cortical volume and thickness changes in older children (Giedd et al. 1999; Gogtay et al. 2004) and newborns born at term (Gilmore et al. 2007). In this way, the posterior temporal cortices, involved in language function, have the most protracted maturation course across the human life span (Sowell et al. 2003). This asynchronous maturation of cortex may be related to the differential myelination of underlying white matter pathways during infancy and childhood (Yakovlev and Lecours 1967; Paus et al. 1999; Dubois et al. in press).
Asymmetries in the Appearance of Sulci: Relationships to Functional Specialization?
Asymmetries in brain structure are an important factor in determining hemispheric specialization, as first described by Broca in 1861 for language lateralization. The current study of the cortical surface development and folding in preterm infants enabled the definition of early asymmetries that may be indicators of the future functional specialization of cortical areas. First, a higher surface of the right hemisphere was observed in females, which is coherent with the larger right
Figure 5. Sulci identification on the inner cortical surface for newborns of different GA and SI: presented, from left to right, are sagittal views of the medial and lateral left hemisphere surfaces, and transverse views of the vertex and ventral surfaces (A anterior, P posterior, L left, R right). Note that the sulci of the medial surface appear roughly connected.
brain volumes measured in adults and children, but inconsis-tent with the recent findings of Gilmore et al. (2007) in term neonates. As previously reported in postmortem specimens (Chi et al. 1977b), we demonstrated in vivo that the right hemisphere presents gyral complexity earlier than the left, which is particularly evident at the level of the STS, larger on the right side of most preterm newborns. Such initial delay in maturation of the left hemisphere in comparison with the right is coherent with the assumption that there is less genetic control over the left hemisphere, which would be influenced more by in utero environment (Geschwind et al. 2002). During development, it may allow a higher structural plasticity of the dominant hemisphere, according to potential functional stimulation like language exposure and motor movements.
The early rightward STS asymmetry we detected in this study is to be related to the observations showing that the adult STS has a different 3D architecture in the 2 hemispheres (Ochiai et al. 2004), with a deeper sulcus on the right side (Van Essen 2005). It probably goes with the leftward asymmetry of the planum temporale, SF, and transverse temporal gyrus, which was observed in fetuses as early as 31 weeks of GA (Wada et al. 1975; Chi et al. 1977b). These anatomical asymmetries may evolve with development given that Sowell et al. (2002) described much more prominent asymmetries around the SF in adults than in children, and that Blanton et al. (2001) revealed a significant left-greater-than-right STS asymmetry in older children. These results suggest that the early structural asymmetric development and the functional lateralization, with the left hemispherical dominance for speech function already observed in young infants (Dehaene-Lambertz et al. 2006), may be closely related. Consequently, early disruptions in STS development during intrauterine life may be related to anatomical and functional anomalies underlying impairments in language and social behavior observed in subjects with autism (Zilbovicius et al. 2006) or psychosis (Crow 1999).
Finally, we observed no asymmetry in the CS area in the normal preterm brain, whereas a recent adult study outlined a larger sulcus in the dominant hemisphere (Mangin et al.
2004). This would support the still limited maturation of the sensori-motor functions in preterm newborns, and the obser-vation by functional MRI that these functions differ in the newborn brain compared with the child brain, with a low involvement of the central regions in response to a passive motor task (Erberich et al. 2006).
Model of Cortical Folding
Correlations between Surface and Volume Measurements In this study, the inner cortical surface, defined as the interface between the developing cortex and white matter zone, was automatically measured in 3D, and correlations with the volumes of developing cortex and inner white matter zone (computed with an independent approach) were provided. Using this approach, we showed that volumes explain the interindividual variability in cortical surface more accurately than the GA, in agreement with phylogenetic findings across species (Zhang and Sejnowski 2000), and a recent study which described that a scaling law, with a 1.29 exponent, correlates the cortical surface area and the cerebral volume defined manually in the human immature brain (Kapellou et al. 2006). In addition, we calculated sulcation indices, marker of the cortical sulci development. These indices, computed globally and regionally (through the central, temporo-parieto-occipital and frontal components), were shown to be influenced by GA and cortical surface.
Factors Influencing Sulcogenesis
During evolution, brain convolutions have lead to an increase of the cortical volume, through the cortical surface expansion due to the addition of radial units (Rakic 1988) and without a com-parable increase in cortical thickness (Zhang and Sejnowski 2000). So far, several hypotheses have been put forward on the factors that influence the formation of sulci in the human brain (Welker 1990). However, the relative importance of genetic versus shared environmental morphogenetic factors is still not understood, despite extrapolations derived from animal
Table 4
Appearance of sulci on the cortical surface: GA (in weeks) of appearance on the cerebral medial, ventral, lateral, and vertex surfaces, according to neuropathologic studies (Chi et al. 1977a; Hansen et al. 1993), to in vivo fetal MRI (Garel et al. 2001), and to the inner cortical surface reconstruction in preterm newborns (for the right and left hemispheres)
Sulci Neuropathologic appearance Fetal MRI (25--75%/[75%) Sulci identification (~50%/[75%)
(Chi et al. 1977a) (Hansen et al. 1993) (25--50%) (Garel et al. 2001) Right Left Medial cerebral surface
Interhemispheric fissure 10 8--13 —/22--23 —/26.7 —/26.7
CaS 14 8--13 —/22--23 —/26.7 —/26.7
POF 16 14--17 —/22--23 —/26.7 —/26.7
CF 16 14--17 22--23/24--25 —/26.7 —/26.7
Cingular sulcus 18 14--17 22--23/24--25 —/26.7 —/26.7
Ventral cerebral surface
CoS 23 18--22 24--25/27 29/30 30/30
UnS — — — 30/31 30/31
Olfactory sulcus 16 14--17 — 32/33 34/34
Lateral cerebral surface
SF 14 8--13 — —/26.7 —/26.7 SFS 25 22--25 24--25/29 30/30 29/30 IFS 28 26--29 26/29 30/30 30/30 STS (post) 23 18--22 26/27 27/30 26.7/30 STS (ant) 30/32 ITS 30 26--29 30/33 30/32 29/31 Intraparietal sulcus 26 22--25 27/28 30/31 29/30 Vertex CS 20 18--22 24--25/27 —/26.7 —/26.7 PreCS 24 22--25 26/27 29/30 29/29 PostCS 25 22--25 27/28 28/31 27/30
experiments. Sulcogenesis is in part genetically controlled (Piao et al. 2004; Rakic 2004). The shape of deep and early formed sulci seems to be more strongly predetermined than that of superficial sulci (Bartley et al. 1997; Lohmann et al. 1999; Wright et al. 2002), and the patterns of primary sulci and gyri formation may be phylogenetically conserved between humans and monkeys (Fukunishi et al. 2006). The development of cerebral convolutions in the primate brain may rely on mechanisms intrinsic to cortical gray matter, such as active growth of convolutions during gyrogenesis (Welker 1990), differential growth of inner and outer cortical layers (Richman et al. 1975), or cytoarchitectonic differentiation (Connolly 1950), but in the ferret brain gyrification seems to arise secondary to cortical processes involving neuronal differentiation (Neal et al. 2007). Passive mechanical effects and extrinsic factors, such as axonal fibers (Goldman-Rakic and Rakic 1984), may also shape the cortical convolutions. In recent studies, the role of morphogenetic and mechanical factors on sulcal formation has been emphasized. Toro and Burnod (2005) modeled the con-volutions as a natural consequence of cortical growth, with a potential effect of early regionalization through geometric, mechanic, and growth asymmetries. According to a similar theory, the minimization of the white matter fibers tension may explain why the cortex folds and how the mature cortical pattern is species specific (Van Essen 1997; Hilgetag and Barbas 2006).
However, most investigations of the mechanisms underlying cortical folding rely on postmortem nonhuman primate studies or simulations. Direct evidence in the human brain is still lacking at the macroscopic level, as it requires noninvasive methods to study such factors in the living brain. Our original results on cortical sulcation then provide the first in vivo quantitative ‘‘groundworks’’ for further work on cortical folding in the developing human brain. In the future, this approach will be further correlated to complementary techniques such as DTI (Deipolyi et al. 2005) in order to explore notably the role of white matter fibers tension on cortical folding. It is interesting to note that the first sulci to set up (like the central and cingulum sulci) are identified in cortical regions corre-sponding to white matter fibers which develop early on (like the cortico-spinal tract and cingulum), as observed by DTI in 19 weeks GA postmortem fetuses (Huang et al. 2006) and in 28 weeks GA preterm infants (Hu¨ppi, Maier et al. 1998).
Factors Influencing Cortical Development
In order to highlight in vivo the parameters that may influence cortical development and sulcogenesis in the human brain, the role of distinct factors was investigated in this study.
Sexual Dimorphisms
In comparison with males, we showed preliminary results that females tend to have lower cortical surface and volume, and smaller white matter volume, probably related to lower brain volume and birth weight, as described recently by Gilmore et al. (2007) in term neonates. However, there was no dif-ference with gender in SI. Such results suggest that this pattern allows females to have equivalent cortical sulcation, despite lower brain volume. This is in agreement with a previous study of postmortem fetuses which did not detect any difference in sulcal development between male and female brains (Chi et al. 1977b). A gender dimorphism seems to develop later on because adult women present greater cortical complexity in the frontal and parietal regions (Luders et al. 2004) as well as
greater cortical thickness (Luders et al. 2006a), particularly in right inferior parietal and posterior temporal regions (Sowell et al. 2007), which again might relate to environment- and experience-guided cortical specialization.
Besides, we showed that the newborn cortical surface is asymmetric in females, with a right predominance. This is not congruent with adult studies which reported that asymmetry indices of cortical shape and thickness are either equivalent in both sexes (Luders et al. 2006b; Narr et al. 2007), or even greater in males (Kovalev et al. 2003). In adults, the cortex seems globally thicker in the left hemisphere (Luders et al. 2006b).
Lesions Detected in the White Matter
No effect of lesion was found on immediate cortical growth, most likely because the MR examination was close to birth and the occurrence of lesions was related to complications from preterm birth, and because these lesions were small as outlined by the degree of resulting white matter abnormalities detected at term equivalent age (none or mild abnormality). However, there was a trend towards a higher sulcation in the lesion group at the level of the CS and the frontal lobe, which may be correlated with the later neurological development. Then evaluating later cortical pattern in sulcal deepness and shape, at term equivalent age, might detect postinjury developmental alterations of cortical sulci. Our approach can help in deter-mining how pathology or lesions occurring in the prenatal or perinatal period affects cortical folding. Actually, in the human preterm brain, cortical sulci seem prominent in infants with subcortical extensive cystic leucomalacia (de Vries et al. 1989), and ischemic encephaloclastic mechanisms are susceptible to induce polymicrogyria (Inder et al. 1999). In the animal brain, hypoxemia delays gyral formation in sheep fetuses (Rees et al. 1997), and the resection of prefrontal cortex in the rhesus monkey fetal brain induces ectopic sulci and gyri in neighbor-ing and remote intact cerebral regions (Goldman and Galkin 1978) resulting from neuronal and long-distance connections rearrangement (Goldman 1978; Goldman-Rakic 1980). In both normal and pathological contexts, there is thus a high potential of our approach to characterize noninvasively the various influences of perinatal environments and injuries on cortical folding in human living newborns, and to follow longitudinal changes in cortical sulcation during infancy and childhood through in vivo MR studies.
Preterm Birth
In this study we focused on the sulcal development in human preterm newborns, and one may wonder whether the provided description can be considered as normal, because prematurity per se might influence brain development and cortical maturation. Preterm birth may be responsible for the delay that we observed in sulci appearance in comparison with postmortem and fetal studies, as both cortical volume (Inder et al. 2005) and surface area (Ajayi-Obe et al. 2000) of extremely preterm infants imaged at term equivalent age are decreased and less complex than in normal infants, and this impairment seems to increase with decreasing GA at birth (Kapellou et al. 2006). In preterm children and adolescents, the temporal lobe gyrification is increased (Kesler et al. 2006), whereas the secondary orbital sulci depth is reduced (Gimenez et al. 2006). However, the secondary influence of extra-uterine development may be the most disturbing mechanism on the immature brain of premature newborns with normal
intrauterine growth. Here it may not yet be relevant because the MRI examination reported in this study was performed in the first postnatal days. Thus, the early processes we described, particularly the setting up of primary sulci (Gimenez et al. 2006) and the interhemispherical asymmetries (Lancefield et al. 2006), are most likely the result of genetic and early intrauterine environmental effects.
Conclusion
This study provides the first in vivo and quantitative description of the early development of cortical sulci in the human preterm brain. Included in a longitudinal follow-up and further correlated with the emergence of neurological functions, it may provide important insights into anatomical structural basis of the functional specialization and into the developmental origin of structural abnormalities of the brain induced by genetic and early environmental factors.
Funding
Center for Biomedical Imaging of Geneva and Lausanne and by the Swiss National Foundation grants (32-56927, 3200B0-102127).
Notes
The authors thank F. Henry and P. Challande for help in the MR acquisitions. Conflict of Interest: None declared.
Address correspondence to Jessica Dubois PhD, Division of De-velopment and Growth, Department of Pediatrics, Geneva University Hospitals, 6 rue Willy Donze´, 1211 Geneva, Switzerland. Email: jessica.dubois@centraliens.net.
References
Ajayi-Obe M, Saeed N, Cowan FM, Rutherford MA, Edwards AD. 2000. Reduced development of cerebral cortex in extremely preterm infants. Lancet. 356:1162--1163.
Bartley AJ, Jones DW, Weinberger DR. 1997. Genetic variability of human brain size and cortical gyral patterns. Brain. 120:257--269. Blanton RE, Levitt JG, Thompson PM, Narr KL, Capetillo-Cunliffe L,
Nobel A, Singerman JD, McCracken JT, Toga AW. 2001. Mapping cortical asymmetry and complexity patterns in normal children. Psychiatry Res. 107:29--43.
Cachia A, Mangin JF, Riviere D, Kherif F, Boddaert N, Andrade A, Papadopoulos-Orfanos D, Poline JB, Bloch I, Zilbovicius M, et al. 2003. A primal sketch of the cortex mean curvature: a morphogen-esis based approach to study the variability of the folding patterns. IEEE Trans Med Imaging. 22:754--765.
Chi JG, Dooling EC, Gilles FH. 1977a. Gyral development of the human brain. Ann Neurol. 1:86--93.
Chi JG, Dooling EC, Gilles FH. 1977b. Left-right asymmetries of the temporal speech areas of the human fetus. Arch Neurol. 34:346--348. Connolly C. 1950. External morphology of the primate brain. Charles C
Thomas: Springfield, Illinois.
Crow TJ. 1999. Commentary on Annett, Yeo et al. Klar, Saugstad and Orr: cerebral asymmetry, language and psychosis—the case for a Homo sapiens-specific sex-linked gene for brain growth. Schizophr Res. 39:219--231.
Dehaene-Lambertz G, Hertz-Pannier L, Dubois J. 2006. Nature and nurture in language acquisition: anatomical and functional brain-imaging studies in infants. Trends Neurosci. 29:367--373.
Deipolyi AR, Mukherjee P, Gill K, Henry RG, Partridge SC, Veeraraghavan S, Jin H, Lu Y, Miller SP, Ferriero DM, et al. 2005. Comparing microstructural and macrostructural development of the cerebral cortex in premature newborns: diffusion tensor imaging versus cortical gyration. NeuroImage. 27:579--586.
de Vries LS, Dubowitz LM, Pennock JM, Bydder GM. 1989. Extensive cystic leucomalacia: correlation of cranial ultrasound, magnetic resonance imaging and clinical findings in sequential studies. Clin Radiol. 40:158--166. Dubois J, Dehaene-Lambertz G, Perrin M, Mangin JF, Cointepas Y, Duchesnay E, Le Bihan D, Hertz-Pannier L. Forthcoming. Asyn-chrony of the early maturation of white matter bundles in healthy infants: quantitative landmarks revealed non-invasively by diffusion tensor imaging. Hum Brain Mapp. doi: 10.1002/hbm.20363. Erberich SG, Panigrahy A, Friedlich P, Seri I, Nelson MD, Gilles F. 2006.
Somatosensory lateralization in the newborn brain. NeuroImage. 29:155--161.
Feess-Higgins A, Laroche JC. 1987. Development of the human foetal brain: an anatomical atlas. Inserm-CNRS: Masson, Paris, France. Fukunishi K, Sawada K, Kashima M, Sakata-Haga H, Fukuzaki K, Fukui Y.
2006. Development of cerebral sulci and gyri in fetuses of cynomolgus monkeys (Macaca fascicularis). Anat Embryol. 211:757--764.
Garel C, Chantrel E, Brisse H, Elmaleh M, Luton D, Oury JF, Sebag G, Hassan M. 2001. Fetal cerebral cortex: normal gestational landmarks identified using prenatal MR imaging. Am J Neuroradiol. 22:184--189. Geschwind DH, Miller BL, DeCarli C, Carmelli D. 2002. Heritability of lobar brain volumes in twins supports genetic models of cerebral laterality and handedness. Proc Natl Acad Sci USA. 99:3176--3181. Giedd JN, Blumenthal J, Jeffries NO, Castellanos FX, Liu H, Zijdenbos A,
Paus T, Evans AC, Rapoport JL. 1999. Brain development during childhood and adolescence: a longitudinal MRI study. Nat Neurosci. 2:861--863.
Gilmore JH, Lin W, Prastawa MW, Looney CB, Vetsa YS, Knickmeyer RC, Evans DD, Smith JK, Hamer RM, Lieberman JA, et al. 2007. Regional gray matter growth, sexual dimorphism, and cerebral asymmetry in the neonatal brain. J Neurosci. 27:1255--1260.
Gimenez M, Junque C, Vendrell P, Narberhaus A, Bargallo N, Botet F, Mercader JM. 2006. Abnormal orbitofrontal development due to prematurity. Neurology. 67:1818--1822.
Gogtay N, Giedd JN, Lusk L, Hayashi KM, Greenstein D, Vaituzis AC, Nugent TF, 3rd, Herman DH, Clasen LS, Toga AW, et al. 2004. Dynamic mapping of human cortical development during childhood through early adulthood. Proc Natl Acad Sci USA. 101:8174--8179. Goldman PS. 1978. Neuronal plasticity in primate telencephalon:
anomalous projections induced by prenatal removal of frontal cortex. Science. 202:768--770.
Goldman PS, Galkin TW. 1978. Prenatal removal of frontal association cortex in the fetal rhesus monkey: anatomical and functional consequences in postnatal life. Brain Res. 152:451--485.
Goldman-Rakic PS. 1980. Morphological consequences of prenatal injury to the primate brain. Prog Brain Res. 53:1--19.
Goldman-Rakic PS, Rakic P. 1984. Experimental modification of gyral patterns. In: Geschwind N, Galaburda A, editors. Cerebral domi-nance. Cambridge (MA): Harvard University Press. p. 179--192. Hansen PE, Ballesteros MC, Soila K, Garcia L, Howard JM. 1993. MR
imaging of the developing human brain. Part 1. Prenatal de-velopment. Radiographics. 13:21--36.
Hilgetag CC, Barbas H. 2005. Developmental mechanics of the primate cerebral cortex. Anat Embryol. 210:411--417.
Hilgetag CC, Barbas H. 2006. Role of mechanical factors in the morphology of the primate cerebral cortex. PLoS Comput Biol. 2: e22.
Huang H, Zhang J, Wakana S, Zhang W, Ren T, Richards LJ, Yarowsky P, Donohue P, Graham E, van Zijl PC, et al. 2006. White and gray matter development in human fetal, newborn and pediatric brains. Neuro-Image. 33:27--38.
Hu¨ppi PS, Inder TE. 2001. Magnetic resonance techniques in the evaluation of the perinatal brain: recent advances and future directions. Semin Neonatol. 6:195--210.
Hu¨ppi PS, Maier SE, Peled S, Zientara GP, Barnes PD, Jolesz FA, Volpe JJ. 1998. Microstructural development of human newborn cerebral white matter assessed in vivo by diffusion tensor magnetic resonance imaging. Pediatr Res. 44:584--590.
Hu¨ppi PS, Schuknecht B, Boesch C, Bossi E, Felblinger J, Fusch C, Herschkowitz N. 1996. Structural and neurobehavioral delay in postnatal brain development of preterm infants. Pediatr Res. 39:895--901. Hu¨ppi PS, Warfield S, Kikinis R, Barnes PD, Zientara GP, Jolesz FA,
of brain development in premature and mature newborns. Ann Neurol. 43:224--235.
Inder TE, Huppi PS, Zientara GP, Jolesz FA, Holling EE, Robertson R, Barnes PD, Volpe JJ. 1999. The postmigrational development of polymicrogyria documented by magnetic resonance imaging from 31 weeks’ postconceptional age. Ann Neurol. 45:798--801. Inder TE, Warfield SK, Wang H, Hu¨ppi PS, Volpe JJ. 2005. Abnormal
cerebral structure is present at term in premature infants. Pediatrics. 115:286--294.
Kapellou O, Counsell SJ, Kennea N, Dyet L, Saeed N, Stark J, Maalouf E, Duggan P, Ajayi-Obe M, Hajnal J, et al. 2006. Abnormal cortical development after premature birth shown by altered allometric scaling of brain growth. PLoS Med. 3:e265.
Kesler SR, Vohr B, Schneider KC, Katz KH, Makuch RW, Reiss AL, Ment LR. 2006. Increased temporal lobe gyrification in preterm children. Neuropsychologia. 44:445--453.
Kostovic I, Judas M, Rados M, Hrabac P. 2002. Laminar organization of the human fetal cerebrum revealed by histochemical markers and magnetic resonance imaging. Cereb Cortex. 12:536--544.
Kostovic I, Lukinovic N, Judas M, Bogdanovic N, Mrzljak L, Zecevic N, Kubat M. 1989. Structural basis of the developmental plasticity in the human cerebral cortex: the role of the transient subplate zone. Metab Brain Dis. 4:17--23.
Kostovic I, Rakic P. 1990. Developmental history of the transient subplate zone in the visual and somatosensory cortex of the macaque monkey and human brain. J Comp Neurol. 297:441--470. Kovalev VA, Kruggel F, von Cramon DY. 2003. Gender and age effects in
structural brain asymmetry as measured by MRI texture analysis. NeuroImage. 19:895--905.
Lancefield K, Nosarti C, Rifkin L, Allin M, Sham P, Murray R. 2006. Cerebral asymmetry in 14 year olds born very preterm. Brain Res. 1093:33--40.
Le Provost JB, Bartres-Faz D, Paillere-Martinot ML, Artiges E, Pappata S, Recasens C, Perez-Gomez M, Bernardo M, Baeza I, Bayle F, et al. 2003. Paracingulate sulcus morphology in men with early-onset schizophrenia. Br J Psychiatry. 182:228--232.
Lohmann G, von Cramon DY, Steinmetz H. 1999. Sulcal variability of twins. Cereb Cortex. 9:754--763.
Luders E, Narr KL, Thompson PM, Rex DE, Jancke L, Steinmetz H, Toga AW. 2004. Gender differences in cortical complexity. Nat Neurosci. 7:799--800.
Luders E, Narr KL, Thompson PM, Rex DE, Jancke L, Toga AW. 2006. Hemi-spheric asymmetries in cortical thickness. Cereb Cortex. 16:1232--1238. Luders E, Narr KL, Thompson PM, Rex DE, Woods RP, Deluca H, Jancke L, Toga AW. 2006. Gender effects on cortical thickness and the influence of scaling. Hum Brain Mapp. 27:314--324.
Maas LC, Mukherjee P, Carballido-Gamio J, Veeraraghavan S, Miller SP, Partridge SC, Henry RG, Barkovich AJ, Vigneron DB. 2004. Early laminar organization of the human cerebrum demonstrated with diffusion tensor imaging in extremely premature infants. Neuro-Image. 22:1134--1140.
Mangin JF, Riviere D, Cachia A, Duchesnay E, Cointepas Y, Papadopoulos-Orfanos D, Scifo P, Ochiai T, Brunelle F, Regis J. 2004. A framework to study the cortical folding patterns. NeuroImage. 23:S129--S138. Molko N, Cachia A, Riviere D, Mangin JF, Bruandet M, Le Bihan D,
Cohen L, Dehaene S. 2003. Functional and structural alterations of the intraparietal sulcus in a developmental dyscalculia of genetic origin. Neuron. 40:847--858.
Narr KL, Bilder RM, Luders E, Thompson PM, Woods RP, Robinson D, Szeszko PR, Dimtcheva T, Gurbani M, Toga AW. 2007. Asymmetries of cortical shape: effects of handedness, sex and schizophrenia. NeuroImage. 34:939--948.
Neal J, Takahashi M, Silva M, Tiao G, Walsh CA, Sheen VL. 2007. Insights into the gyrification of developing ferret brain by magnetic resonance imaging. J Anat. 210:66--77.
Ochiai T, Grimault S, Scavarda D, Roch G, Hori T, Riviere D, Mangin JF, Regis J. 2004. Sulcal pattern and morphology of the superior temporal sulcus. NeuroImage. 22:706--719.
Ono M, Kubik S, Abernathey CD. 1990. Atlas of the cerebral sulci. Thieme Medical Publishers: New York.
Paus T, Zijdenbos A, Worsley K, Collins DL, Blumenthal J, Giedd JN, Rapoport JL, Evans AC. 1999. Structural maturation of neural pathways in children and adolescents: in vivo study. Science. 283:1908--1911.
Piao X, Hill RS, Bodell A, Chang BS, Basel-Vanagaite L, Straussberg R, Dobyns WB, Qasrawi B, Winter RM, Innes AM, et al. 2004. G protein-coupled receptor-dependent development of human frontal cortex. Science. 303:2033--2036.
Rakic P. 1988. Specification of cerebral cortical areas. Science. 241:170--176.
Rakic P. 2004. Neuroscience. Genetic control of cortical convolutions. Science. 303:1983--1984.
Regis J, Mangin JF, Ochiai T, Frouin V, Riviere D, Cachia A, Tamura M, Samson Y. 2005. ‘‘Sulcal root’’ generic model: a hypothesis to overcome the variability of the human cortex folding patterns. Neurol Med Chir. 45:1--17.
Rees S, Stringer M, Just Y, Hooper SB, Harding R. 1997. The vulnerability of the fetal sheep brain to hypoxemia at mid-gestation. Brain Res Dev Brain Res. 103:103--118.
Richman DP, Stewart RM, Hutchinson JW, Caviness VS Jr. 1975. Mechanical model of brain convolutional development. Science. 189:18--21. Schierlitz L, Dumanli H, Robinson JN, Burrows PE, Schreyer AG,
Kikinis R, Jolesz FA, Tempany CM. 2001. Three-dimensional magnetic resonance imaging of fetal brains. Lancet. 357:1177--1178. Scifo P, Cachia A, Boddaert N, Sonigo P, Simon I, Zilbovicius M, Lethimonnier F, Le Bihan D, Brunelle F, Mangin JF. 2003. Antenatal MR imaging for the study of fetus brain development. Meeting Hum Brain Mapp. 19:S1589.
Sowell ER, Peterson BS, Kan E, Woods RP, Yoshii J, Bansal R, Xu D, Zhu H, Thompson PM, Toga AW. 2007. Sex Differences in cortical thickness mapped in 176 healthy individuals between 7 and 87 years of age. Cereb Cortex. 17:1550--1560.
Sowell ER, Peterson BS, Thompson PM, Welcome SE, Henkenius AL, Toga AW. 2003. Mapping cortical change across the human life span. Nat Neurosci. 6:309--315.
Sowell ER, Thompson PM, Rex D, Kornsand D, Tessner KD, Jernigan TL, Toga AW. 2002. Mapping sulcal pattern asymmetry and local cortical surface gray matter distribution in vivo: maturation in perisylvian cortices. Cereb Cortex. 12:17--26.
Toro R, Burnod Y. 2005. A morphogenetic model for the development of cortical convolutions. Cereb Cortex. 15:1900--1913.
Van Essen DC. 1997. A tension-based theory of morphogenesis and compact wiring in the central nervous system. Nature. 385:313--318. Van Essen DC. 2005. A population-average, landmark- and surface-based (PALS) atlas of human cerebral cortex. NeuroImage. 28:635--662. Van Essen DC, Dierker D, Snyder AZ, Raichle ME, Reiss AL, Korenberg J.
2006. Symmetry of cortical folding abnormalities in Williams syn-drome revealed by surface-based analyses. J Neurosci. 26:5470--5483. Wada JA, Clarke R, Hamm A. 1975. Cerebral hemispheric asymmetry in humans. Cortical speech zones in 100 adults and 100 infant brains. Arch Neurol. 32:239--246.
Welker W. 1990. Why does cerebral cortex fissure and fold? A review of determinants of gyri and sulci. In: Jones E, Peters A, editors. Comparative structure and evolution of cerebral cortex. Part II, Vol. 8B. New York: Plenum. p. 3--136.
Woodward LJ, Anderson PJ, Austin NC, Howard K, Inder TE. 2006. Neonatal MRI to predict neurodevelopmental outcomes in preterm infants. N Engl J Med. 355:685--694.
Wright IC, Sham P, Murray RM, Weinberger DR, Bullmore ET. 2002. Genetic contributions to regional variability in human brain structure: methods and preliminary results. NeuroImage. 17:256--271. Yakovlev PI, Lecours AR. 1967. The myelogenetic cycles of regional
maturation in the brain. In: Minowski A, editor. Regional de-velopment of the brain in early life. Oxford: Blackwell. p. 3--69. Zhang K, Sejnowski TJ. 2000. A universal scaling law between gray
matter and white matter of cerebral cortex. Proc Natl Acad Sci USA. 97:5621--5626.
Zilbovicius M, Meresse I, Chabane N, Brunelle F, Samson Y, Boddaert N. 2006. Autism, the superior temporal sulcus and social perception. Trends Neurosci. 29:359--366.