HAL Id: hal-01815757
https://hal.archives-ouvertes.fr/hal-01815757
Submitted on 4 Jun 2021
HAL is a multi-disciplinary open access archive for the deposit and dissemination of sci-entific research documents, whether they are pub-lished or not. The documents may come from teaching and research institutions in France or abroad, or from public or private research centers.
L’archive ouverte pluridisciplinaire HAL, est destinée au dépôt et à la diffusion de documents scientifiques de niveau recherche, publiés ou non, émanant des établissements d’enseignement et de recherche français ou étrangers, des laboratoires publics ou privés.
High-dimensional single-cell analysis reveals the immune
signature of narcolepsy
Félix Hartmann, Raphaël Bernard-Valnet, Clémence Quériault, Dunja
Mrdjen, Lukas Weber, Edoardo Galli, Carsten Krieg, Mark Robinson,
Xuan-Hung Nguyen, Yves Dauvilliers, et al.
To cite this version:
Félix Hartmann, Raphaël Bernard-Valnet, Clémence Quériault, Dunja Mrdjen, Lukas Weber, et al.. High-dimensional single-cell analysis reveals the immune signature of narcolepsy. Journal of Experi-mental Medicine, Rockefeller University Press, 2016, 213 (12), pp.2621 - 2633. �10.1084/jem.20160897�. �hal-01815757�
Ar ticle
IntroductIon
Narcolepsy type 1 (hereafter called narcolepsy) is a rare, chronic, and disabling neurological disease characterized by excessive daytime sleepiness, sudden loss of muscle tone trig-gered by emotions, and fragmented nocturnal sleep (Dauvil-liers et al., 2007; Scammell, 2015). Narcolepsy is caused by defective neurotransmission via orexin (also named hypo-cretin) neuropeptides, resulting from a selective and irrevers-ible loss of orexinergic neurons in the lateral hypothalamus. The disease etiology is largely unclear but narcolepsy has a strong genetic association with the human leukocyte
anti-gen (HLA)-DQB1*06:02 allele, which is present in >98%
of patients versus 18% of control Europeans (Mignot et al., 1997; Tafti et al., 2014). Additionally, narcolepsy is associ-ated with other genes relevant to immune responses, most
notably HLA class I alleles and T cell receptor α (TCRA)
polymorphisms (Han et al., 2013; Ollila et al., 2015; Tafti et al., 2016). These findings provide the main reasoning behind
why narcolepsy is generally considered an immune-mediated disorder involving autoaggressive lymphocytes. In line with this hypothesis, autoantibodies of unknown pathogenic rel-evance have been identified in some individuals with nar-colepsy (Cvetkovic-Lopes et al., 2010; Bergman et al., 2014; Ahmed et al., 2015; Saariaho et al., 2015). Further supporting an autoimmune etiology is the fact that vaccination against the 2009 pandemic H1N1 influenza virus with the Euro-pean preparation Pandemrix was associated with induction of narcolepsy in individuals harboring the HLA-DQB1*06:02 allele (Nguyen et al., 2016). Although these points provide indirect evidence for an immune-mediated pathogenesis in narcolepsy, studies identifying the involved immune cell types and investigating their function and phenotype remain scarce (Liblau et al., 2015).
The recent advent of high-dimensional single-cell anal-ysis techniques such as mass cytometry (also called cytometry by time-of-flight [CyTOF]) now permits in-depth exam-ination of multiple immune cell subtypes simultaneously and, together with algorithm-guided analysis approaches, provides an ideal platform for such explorative studies (Bendall et al., 2012).
narcolepsy type 1 is a devastating neurological sleep disorder resulting from the destruction of orexin-producing neurons in the central nervous system (cnS). despite its striking association with the HLA-dQB1*06:02 allele, the autoimmune etiology of narcolepsy has remained largely hypothetical. Here, we compared peripheral mononucleated cells from narcolepsy patients with HLA-dQB1*06:02-matched healthy controls using high-dimensional mass cytometry in combination with algorithm-guided data analysis. narcolepsy patients displayed multifaceted immune activation in cd4+ and cd8+ t cells dominated by elevated
levels of B cell–supporting cytokines. Additionally, t cells from narcolepsy patients showed increased production of the proin-flammatory cytokines IL-2 and tnF. Although it remains to be established whether these changes are primary to an autoim-mune process in narcolepsy or secondary to orexin deficiency, these findings are indicative of inflammatory processes in the pathogenesis of this enigmatic disease.
High-dimensional single-cell analysis reveals the immune
signature of narcolepsy
Felix J. Hartmann,
2Raphaël Bernard-Valnet,
1Clémence Quériault,
1Dunja Mrdjen,
2Lukas M. Weber,
3,4Edoardo Galli,
2Carsten Krieg,
2Mark D. Robinson,
3,4Xuan-Hung Nguyen,
1Yves Dauvilliers,
5Roland S. Liblau,
1* and Burkhard Becher
2*
1Centre de Physiopathologie Toulouse-Purpan, Université de Toulouse, Centre National de la Recherche Scientifique, Institut National de la Santé et de la Recherche
Médicale, UPS, 31024 Toulouse, France
2Institute of Experimental Immunology, 3Institute of Molecular Life Sciences, and 4SIB Swiss Institute of Bioinformatics, University of Zurich, CH-8057 Zurich,
Switzerland
5National Reference Center for Orphan Diseases, Narcolepsy, Idiopathic hypersomnia and Kleine-Levin Syndrome, Department of Neurology, Gui-de-Chauliac Hospital,
CHU de Montpellier, Institut National de la Santé et de la Recherche Médicale U1061, 34090 Montpellier, France
© 2016 Hartmann et al. This article is distributed under the terms of an Attribution–Noncommercial–Share Alike–No Mirror Sites license for the first six months after the publication date (see http ://www .rupress .org /terms). After six months it is available under a Creative Commons License (Attribution–Noncommercial– Share Alike 3.0 Unported license, as described at http ://creativecommons .org /licenses /by -nc -sa /3 .0 /).
*R.S. Liblau and B. Becher contributed equally to this paper
Correspondence to Roland S. Liblau: roland.liblau@inserm.fr; or Burkhard Becher: becher@immunology.uzh.ch
Abbreviations used: BDI, Beck’s depression inventory; BMI, body mass index; CCM, cell culture medium; CCR, chemokine receptor; CDI, children’s depression inventory; CSF, cerebrospinal fluid; CSM, cell staining medium; CyTOF, cytometry by time-of-flight; ESS, Epworth sleepiness scale; FDR, false discovery rate; HD, healthy donor; IQR, interquartile range; ISI, insomnia severity index; MSLT, multiple sleep latency test; SOR EMP, sleep-onset rapid-eye-movement period; T reg cell, regulatory T cell; t-SNE, t-stochastic neighbor embedding.
The Journal of Experimental Medicine
Here, we analyzed PBMCs of a large cohort of narco-lepsy patients and healthy control individuals harboring the HLA-DQB1*06:02 allele via mass cytometry. Using new and powerful automated algorithms enabled an explorative, hypothesis-generating interrogation of the phenotypic and functional immune signature of narcolepsy. For this, we es-tablished a 45-parameter panel, including 22 cell surface and 13 intracellular heavy metal–conjugated antibodies, which were chosen to (i) identify all major immune populations in peripheral blood of humans, (ii) determine their activation status, and (iii) analyze their maturation, chemokine receptor (CCR), and most importantly, cytokine expression patterns. Using this approach revealed a proinflammatory signature of T cells in narcolepsy patients, dominated by elevated levels of B cell–supporting cytokines.
reSuLtS
Single-cell mass cytometry for the analysis of immune populations in narcolepsy
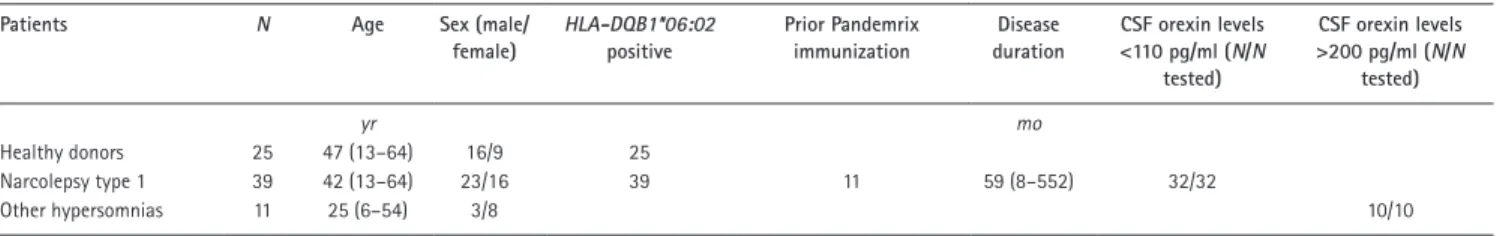
We collected PBMCs from narcolepsy patients (n = 39), tightly age-, sex-, and HLA-DQB1–matched healthy donors (HD; n = 25), as well as patients with other hypersomnias (n = 11; Table 1 and more detailed in Table S1). This collec-tion included narcolepsy patients with a wide range of disease durations (8–552 mo), as well as patients in which the onset of narcolepsy occurred after Pandemrix H1N1 influenza virus vaccination (n = 11) or independently of it. Additionally, the inclusion of patients with other hypersomnias allowed us to control for and directly compare the influence of nonauto-immune sleep disorders.
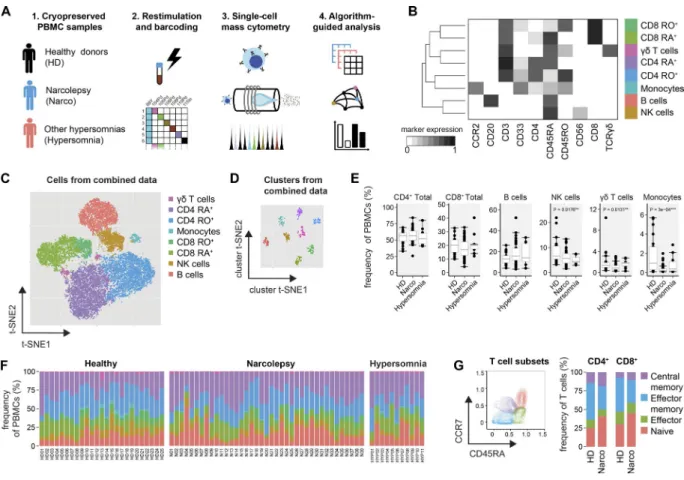
Given the uncertainty about potential autoantigens in narcolepsy, we brieftly restimulated the PBMC samples in an antigen-independent manner (PMA/ionomycin) and performed live-cell barcoding before the combined sample was stained with heavy metal–conjugated antibodies (Table S2) and acquired on a CyTOF2 mass cytometer (Fig. 1 A). After data preprocessing, the FlowSOM algorithm (Van Gas-sen et al., 2015) was used to identify the major immune cell populations in a data-driven and automated manner. Flow-SOM assigned cells to clusters corresponding to the major
immune populations (CD4+ and CD8+ T cells, γδT cells, B
cells, NK cells, and monocytes, Fig. 1 B). Visualization of the high-dimensional data using the t-stochastic neighbor em-bedding (t-SNE) algorithm (Van Der Maaten and Hinton,
2008; Amir et al., 2013; Mair et al., 2016) corresponded well to the automatically defined populations, thus further veri-fying the FlowSOM clustering (Fig. 1 C). The defined pop-ulations from different samples were homogeneous in their expression levels of all analyzed markers and clearly distinct from other clusters (Fig. 1 D).
First, we investigated whether the relative frequencies of the major immune cell populations are modulated in nar-colepsy patients versus HD and hypersomnia patients (Fig. 1, E and F; and together with all measured frequencies in Table S3). We found the composition of the PBMCs to be largely comparable between patients and controls, with a slight re-duction in the frequency of monocytes (1.0 ± 0.6% HD ver-sus 0.2 ± 0.1% Narco, median ± SEM), as well as NK cells and γδT cells. To further define functional subsets of the pre-viously identified immune lineages, we again used FlowSOM
to automatically subdivide total CD4+ and CD8+ T cells
into CD45RA+CCR7+ naive, CD45RA+CCR7− effector,
CD45RA−CCR7− effector memory and CD45RA−CCR7+
central memory cells (Fig. 1 G). Narcolepsy patients were
found to have higher proportions of naive CD4+ (37.6 ±
4.1% Narco vs. 22.7 ± 3.9% HD) and CD8+ T cells (46.7 ±
2.4% Narco vs. 23.7 ± 7.0% HD) co-occurring with fewer respective effector memory T cells.
Activation and increased production of tnF and B cell– supporting cytokines by th cells
Having automatically defined different leukocyte populations, we next assessed whether their activation status and especially cytokine profiles are altered in narcolepsy. Starting with CD4+
Th cells, we found that CD69 expression was elevated on
previously defined CD45RA+CCR7+ Th cells in narcolepsy
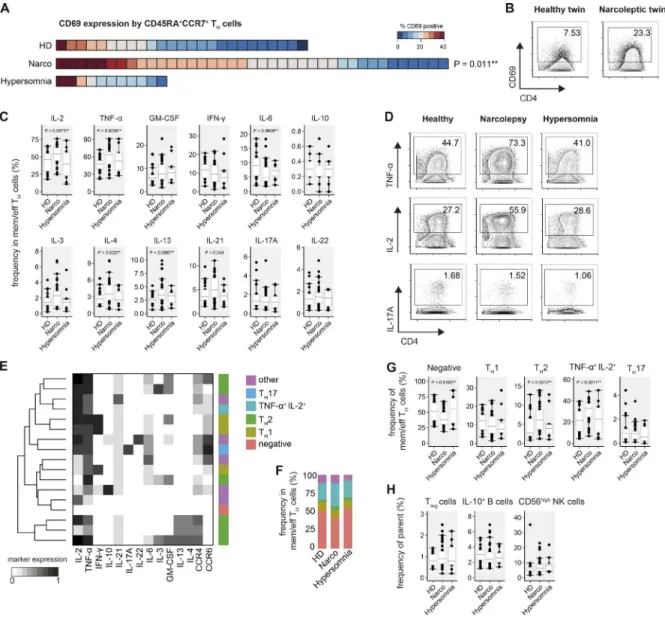
patients (21.8 ± 1.3%) versus HD (11.3 ± 2.8%, Fig. 2 A). With the exception of two donors, this increase was not ob-served in patients with other sleep disorders (16.4 ± 2.7%). Interestingly, a higher frequency of CD69 expression was fur-ther confirmed in a monozygotic twin pair discordant for the disease (N09 and HD01), where the narcoleptic twin also
expressed increased levels of CD69 on CD45RA+CCR7+ Th
cells compared with the healthy sibling (Fig. 2 B).
Given the high-dimensional nature of mass cytometry, we were able to simultaneously analyze the production of
up to 12 cytokines on antigen-experienced CD4+ T cells.
Manually defining cytokine-positive cells, we found the fre-Table 1. Summary characteristics of patients and control subjects in this study
Patients N Age Sex (male/
female) HLA-DQB1*06:02 positive Prior Pandemrix immunization Disease duration CSF orexin levels <110 pg/ml (N/N tested) CSF orexin levels >200 pg/ml (N/N tested) yr mo Healthy donors 25 47 (13–64) 16/9 25 Narcolepsy type 1 39 42 (13–64) 23/16 39 11 59 (8–552) 32/32 Other hypersomnias 11 25 (6–54) 3/8 10/10
For age and disease duration, numbers indicate the median with the range in parentheses.
quency of TNF and IL-2–producing cells to be increased in antigen-experienced Th cells from narcolepsy patients (63.9 ± 4.2% TNF and 54.6 ± 2.7% IL-2) versus HD (47.5 ± 2.3% TNF and 46.2 ± 5.9% IL-2). Importantly, patients with other hypersomnias resembled HD (53.1 ± 8.7% TNF and 39.7 ± 12.0% IL-2; Fig. 2 C). Additionally, the frequency of several Th2-associated cytokines, such as IL-4 and IL-13, was increased in narcolepsy patients (3.5 ± 0.5% IL-4 and 3.5 ± 0.2% IL-13) versus HD (2.6 ± 0.3% IL-4 and 2.5 ± 0.2% IL-13). To a lesser extent, IL-3 did also show an in-creased frequency in narcolepsy patients. Again, patients with other hypersomnia did not show these augmented frequencies. The frequency of IL-6–producing Th cells was
reduced in narcolepsy patients compared with controls, whereas IL-21–producing cells displayed a trend toward a higher frequency in narcolepsy patients (5.0 ± 0.7% Narco vs. 3.5 ± 0.4% HD; P = 0.049).
The frequencies of IFN-γ+ and IL-17A+ T cells, which
are heavily implicated in other autoimmune diseases, includ-ing multiple sclerosis (Dendrou et al., 2015) and psoriasis (Becher and Pantelyushin, 2012; Perera et al., 2012), were not overtly altered in narcolepsy patients, as was the production of the immunosuppressive IL-10 by Th cells (Fig. 2, C–G). A more detailed analysis of individual subpopulations provided similar results for effector, effector memory, and central mem-ory Th cells, demonstrating that the augmented cytokine Figure 1. High-dimensional mass cytometry for the analysis of immune populations in narcolepsy patients. (A) PBMCs of narcolepsy patients
(Narco, n = 39), HD (n = 25) and patients with other hypersomnias (n = 11) were stained with heavy metal–labeled antibodies and acquired on a CyTOF2 mass cytometer. (B) Data from preprocessed, single, live cells was exported and used as input for the FlowSOM clustering algorithm. Only the 10 indicated surface markers were used in this initial clustering step. FlowSOM nodes were metaclustered (k = 8) and manually annotated based on the expression level of the lineage-associated markers. RO+, CD45RO+; RA+, CD45RA+. (C) The combined dataset was down-sampled to 20,000 cells and subjected to
dimen-sionality reduction using the t-SNE algorithm. Again, only the 10 surface markers indicated in B were used as input dimensions. The manually annotated populations from C are overlaid as a color-dimension. (D) Instead of cells, clusters from the combined dataset and all measured parameters were used as an input for the t-SNE visualization. (E) Statistical comparison of the frequencies of immune populations and (F) sample-specific composition in narcolepsy patients and controls. Indicated p-values are comparing narcolepsy patients with HD. (G) T cells were automatically subdivided into naive, effector, effector memory, and central memory cells based on the expression of CD45RA and CCR7 using FlowSOM (k = 4, left). Composition of CD4+ and CD8+ T cell subsets
in narcolepsy patients versus HD (right). Boxplots represent the interquartile range (IQR) with a black horizontal line indicating the median. Whiskers extend to the farthest data point within a maximum of 1.5× IQR. Values outside this range are plotted as points. All p-values were calculated using a nonparamet-ric Mann-Whitney-Wilcoxon test. Controlling for multiple comparisons was performed with the Benjamini-Hochberg approach. **, significant with false discovery rate (FDR) < 5%; ***, significant with FDR < 1%.
production in narcolepsy patients is not driven by a specific subset (unpublished data).
To identify Th cell subsets based on the coexpression of the aforementioned cytokines in a more unbiased and data-driven approach, we again made use of the FlowSOM clustering algorithm. FlowSOM identified several subsets of
Th1 and Th2 cells, as well as Th cells resembling Th17, Th22, and regulatory T (T reg) cell subsets (Fig. 2, E–H). Using this data-driven subset identification, we found the fraction of cytokine-negative cells to be markedly reduced in nar-colepsy patients (37.8 ± 2.7%), compared to patients with other hypersomnias (54.9 ± 14.3%) or HD (51.5 ± 6.0%). In-Figure 2. Activation and increased th cell cytokine production in narcolepsy patients. FlowSOM-defined CD4+ Th cells of narcolepsy patients
(Narco, n = 39), HD (n = 25), and patients with other hypersomnias (n = 11) were examined for CD69 expression and cytokine production. (A) Heat map depiction of the individual frequency of CD69+ cells in CD45RA+CCR7+ Th cells was sorted from highest to lowest frequency for all narcolepsy patients and
controls within the cohort. Each square represents one individual. (B) CD69 expression by CD45RA+CCR7+ Th cells in a monozygotic twin pair discordant for
narcolepsy. (C) Manually determined frequencies of cytokine+ antigen-experienced (effector, effector memory, and central memory) Th cells. (D) Production
of TNF, IL-2, and IL-17A by Th cells as in C. (E) FlowSOM (k = 17) was used to cluster Th cells based on their cytokine-production profiles. The major Th cell subsets were manually annotated using these cytokine production profiles in combination with their CCR expression. (F) Group-specific composition and (G) statistical comparison of the frequencies of Th cell subsets in narcolepsy patients and controls. (H) Frequencies of the indicated regulatory immune cell populations were defined by manual gating. T reg cells were defined as CD25+CD127−IL-2− Th cells. Boxplots represent the IQR with a black horizontal line
indicating the median. Whiskers extend to the farthest data point within a maximum of 1.5× IQR. Values outside this range are plotted as points. All p-values were calculated using a nonparametric Mann-Whitney-Wilcoxon test and are comparing narcolepsy patients with HD. Controlling for multiple comparisons was performed with the Benjamini-Hochberg approach. *, significant with FDR < 10%; **, significant with FDR < 5%.
stead, narcolepsy patients had a strongly increased frequency of TNF+IL-2+, but IFN-γ−, Th cells (32.8 ± 1.8% Narco vs.
21.6 ± 4.0% HD). Confirming the results obtained using manual gating, this automated clustering also identified in-creased frequencies of Th2 cells in narcolepsy patients (6.1 ± 0.9%) vs. HD (2.7 ± 0.5%).
Augmented cytokine production might stem from changes in the frequency of regulatory immune subsets. However, we did not find any overt modulation of the
fre-quency of T reg cells, IL-10–producing B cells, or CD56high
NK cells in narcolepsy patients versus controls (Fig. 2 H).
expansion of B cell–supporting cd8+ t cell populations
Besides CD4+ Th cells, CD8+ T cells are also thought to
play a major role in CNS inflammation and autoimmunity (Waisman et al., 2015; Yshii et al., 2015), and in an exper-imental model of narcolepsy (Bernard-Valnet et al., 2016). Based on the activation and overt modulation of cytokine
production by CD4+ T cells, we analyzed whether in
nar-colepsy patients, CD8+ T cell subsets are activated and show
altered cytokine production profiles. Comparing CD69
ex-pression on CD45RA+CCR7+ CD8+ T cells in narcolepsy
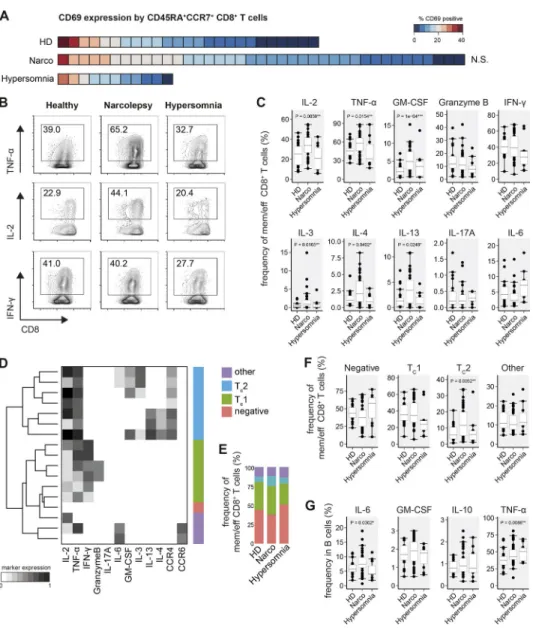
patients versus HD, we did not find significant differences in the activation state of this population (Fig. 3 A).
We found increased frequencies of TNF and IL-2
pro-ducing CD8+ T cells in narcolepsy patients (57.7 ± 3.7% TNF
and 34.0 ± 2.3% IL-2) compared with HD (45.7 ± 2.7% and 25.4 ± 4.1%, respectively; Fig. 3, B and C). Additionally, GM-cerebrospinal fluid (CSF) and type 2 cytokines (IL-3,
IL-4, and IL-13) were also augmented in CD8+ T cells of
nar-colepsy patients. Similar to CD4+ T cells, the levels of IFN-γ–
and IL-17A–producing cells were not differentially regulated in narcolepsy patients versus control groups. Production of
IL-6 or Granzyme B by CD8+ T cells was also comparable
between narcolepsy patients (10.8 ± 1.9% Granzyme B) and
HD (11.8 ± 2.1% Granzyme B; Fig. 3 C). Notably, the CD8+
T cell cytokine profile was similar between patients with other hypersomnias and HD and thus very distinct from that of narcolepsy patients (Fig. 3, B and C).
Next, again using an algorithm-guided approach, we
clustered antigen-experienced CD8+ T cells based on their
cytokine production profiles and annotated these clusters into
TC1, TC2, cytokine-negative, and other subtypes (Fig. 3 D).
Comparing the frequencies of these CD8+ T cell subsets, we
found a striking increase in TC2-like cells in narcolepsy
pa-tients (11.7 ± 1.7%) compared with HD (5.8 ± 1.7%) and to patients with other hypersomnias (5.9 ± 2.0%; Fig. 3, E and F). This increase seemed to be at the expense of cyto-kine-negative cells, which were decreased in narcolepsy.
The frequency of TC1-like cells was comparable in all three
groups (Fig. 3, E and F).
Given the prominent production of B cell–supporting
cytokines by CD4+ and CD8+ T cells, we examined cytokine
expression profiles of B cells in narcolepsy patients (Fig. 3 G). The frequency of B cells producing IL-6 (7.4 ± 0.6% Narco
vs. 5.7 ± 0.5% HD) and TNF (43.3 ± 2.0% Narco vs. 37.3 ± 1.9% HD) was augmented in narcolepsy patients; however, increased TNF production was also observed in patients with other hypersomnias (50.7 ± 7.0%).
technical stability of narcolepsy immune phenotyping
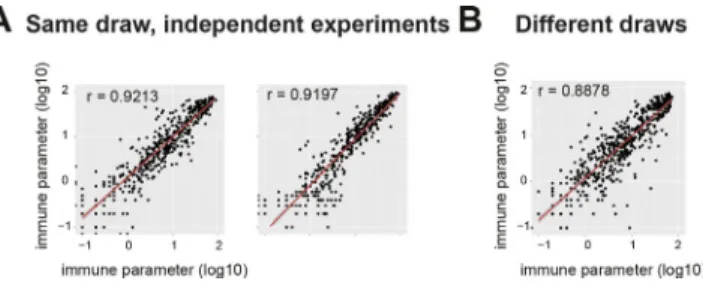
To confirm the narcolepsy-associated immune phenotypes, we performed repeated measurements of narcolepsy samples from the same and different blood draws (Fig. 4). Frequencies of immune phenotypes from independent measurements of separate aliquots taken from a single blood draw displayed a strong correlation, thus demonstrating the technical repro-ducibility of the method (Fig. 4 A). Further, samples drawn from patients on different occasions also displayed virtually identical immune phenotypes (Fig. 4 B), resembling the cor-relation of repeated measurements of the same samples.
narcolepsy-associated immune phenotypes in Pandemrix-vaccinated patients
The cohort of narcolepsy patients comprised patients with a broad range of disease durations (8–552 mo). Among patients with shorter disease duration (median, 44 mo; range, 8–72 mo) were individuals in whom the onset of narcolepsy oc-curred after Pandemrix immunization (n = 11; Narco Pan) and patients who did not receive the Pandemrix vaccine (n = 12). Comparing these groups of patients matched for disease duration and age, we found that Pandemrix-vacci-nated and non–Pandemrix-vacciPandemrix-vacci-nated patients displayed no statistically significant difference in the aforementioned im-mune phenotypes (Fig. 5).
narcolepsy-associated immune phenotypes are influenced by age and disease duration
Next, we determined whether the immune alterations ob-served in narcolepsy patients versus controls are associated with any clinical characteristic (Table S1). First, using linear modeling, we assessed the influence of age and disease dura-tion on immune phenotypes in narcolepsy patients and HD. We found a detectable influence of age to several immune fre-quencies in narcolepsy patients and HD, accounting in part for
the variance in these phenotypes (median R2 = 0.1; Fig. 6 A).
Interestingly, narcolepsy-associated cytokine production
by CD4+ and CD8+ T cells tended to increase with age in
pa-tients but not in HD (Fig. 6 B). In contrast, these trends were reversed for CD69 expression on T cells. As expected, the age of the narcolepsy patients correlated with disease duration. Therefore, we constructed a linear model using both variables as predictors to assess their relative importance. Disease dura-tion and age both contributed almost equally to the explained variance in the immune phenotype of the narcolepsy patients
(mean proportion of R2 0.44 and 0.56, respectively; Fig. 6 C).
Narcolepsy, like many other chronic diseases, has several clinical manifestations and comorbidities which may influ-ence immune parameters. To control for potential confound-ing factors to the reported immunological phenotypes, we
next investigated the contribution of patients’ clinical and neurophysiological characteristics, such as subjective (using the Epworth sleepiness scale [ESS]) and objective measures of daytime sleepiness (using the multiple sleep latency test [MSLT] and the number of sleep-onset rapid-eye-movement periods [SOR EMPs]), disturbed sleep at night (using the in-somnia severity index [ISI]), body-mass index (BMI), and
self-reported depression (using the Beck depression inven-tory or children’s depression inveninven-tory [BDI/CDI]), as well as the patient’s treatment status (Fig. 6 D). We found that only
IL-4 production by CD8+ T cells correlated with one of these
parameters (BMI), whereas we did not observe any substantial influence of all other parameters on any of the analyzed im-munological phenotypes (Fig. 6 D).
Figure 3. expansion of B cell-supporting cd8+ t cells in narcolepsy. FlowSOM-defined CD8+ T cells of narcolepsy patients (Narco, n = 39), HD (n =
25), and patients with other hypersomnias (n = 11) were examined for CD69 expression and cytokine production. (A) Heat map depiction of the frequency of CD69+ cells in CD45RA+CCR7+ CD8+ T cells was sorted from highest to lowest frequency for all narcolepsy patients and controls. Each square represents
one individual. (B) Manually determined frequencies of cytokine+ antigen-experienced (effector, effector memory, and central memory) CD8+ T cells and
(C) statistical comparison of the frequencies of cytokine+ cells. (D) FlowSOM (k = 17) was used to cluster antigen-experienced CD8+ T cells based on their
cytokine-production profiles. The major CD8+ T subsets were manually annotated using these cytokine production profiles in combination with their CCR
expression. (E) Group-specific composition and (F) statistical comparison of the frequencies of CD8+ T cell subsets in narcolepsy patients and controls. (G)
Manually gated frequencies of cytokine+ B cells. Boxplots represent the IQR with a black horizontal line indicating the median. Whiskers extend to the
farthest data point within a maximum of 1.5× IQR. Values outside this range are plotted as points. All p-values were calculated using a nonparametric Mann-Whitney-Wilcoxon test and compare narcolepsy patients with HD. Controlling for multiple comparisons was performed with the Benjamini-Hoch-berg approach. *, significant with FDR < 10%; **, significant with FDR < 5%; ***, significant with FDR < 1%.
dIScuSSIon
In this study, we performed a comprehensive, explorative analysis of narcolepsy type 1 patients in which we studied numerous immunological phenotypes at the single-cell level. To do so, we made use of mass cytometry, which in combina-tion with unbiased, data-driven analysis methods, has proven to be a valuable tool in the hypothesis-free identification of cellular phenotypes associated with cancer (Behbehani et al., 2015; Levine et al., 2015) or clinical recovery after surgery (Gaudillière et al., 2014). Using this approach in the context of a more elusive, putative autoimmune disease, we found complex patterns of immune activation in narcolepsy pa-tients. Central to many of these narcolepsy-associated phe-notypes was their association with B cell–mediated immune responses. This is in line with previous indications of autoan-tibodies in narcolepsy (Cvetkovic-Lopes et al., 2010; Berg-man et al., 2014; Ahmed et al., 2015; Saariaho et al., 2015) and recent studies that further support an important role of B cells in the pathogenesis of T cell–driven CNS autoimmunity (Krumbholz et al., 2012; Flach et al., 2016).
Specifically, we found that CD4+ and CD8+ T cells of
narcolepsy patients produced elevated levels of several cy-tokines involved in B cell differentiation, including IL-4, IL-13, and IL-21. In addition, we found strikingly elevated
frequencies of TNF and IL-2–producing CD4+ and CD8+
T cells in narcolepsy patients. Similarly, B cells of narcolepsy
patients also expressed TNF at a higher frequency than HD. These findings are in line with TNF being previously im-plicated in narcolepsy by genetic association (Hohjoh et al., 1999) and by increased plasma levels in narcolepsy patients (Himmerich et al., 2006; Tanaka et al., 2014). Interestingly, by performing linear modeling, we found this narcolepsy-spe-cific polarization of cytokine production to become more pronounced in patients with longer disease duration and higher age. This analysis could not be performed in patients with other hypersomnias, as this group was underpowered to specifically study the impact of age on the measured im-mune parameters. However, the age-dependent progression of cytokine production in narcolepsy patients is striking and matches previous studies reporting increased levels of IL-4 in the CSF of narcolepsy patients with long disease duration (Dauvilliers et al., 2014), but not patients with short disease duration (Kornum et al., 2015).
This might reflect the presence of an underlying in-flammatory milieu in narcolepsy patients, which is absent in nondiseased controls. Several factors could contribute to such an environment, among them disturbance of sleeping patterns (Vgontzas et al., 1997; Ackermann et al., 2012; Aho et al., 2013; Lasselin et al., 2015), circadian rhythm (Schei-ermann et al., 2013; Spitzer et al., 2015), treatment with psychostimulants (Filiano et al., 2016), and associated met-abolic changes (Wolowczuk et al., 2008). To control for these potential effects, we included patients with sleep dis-orders that exhibit similar manifestations and comorbidi-ties and undergo overlapping treatment. Importantly, these hypersomnia patients were immunologically distinct from narcolepsy patients and did not present increased cytokine production found in narcolepsy patients. However, type 1 narcolepsy patients tend to have more severe sleepiness and more disturbed sleep compared with patients with other hypersomnia. Therefore, we directly modeled the potential influence of sleepiness, disturbed night-time sleep, depres-sive symptoms, BMI, and treatment status on all reported
immune phenotypes. Besides IL-4 expression by CD8+ T
cells, we did not find any correlation of these clinical pa-rameters with the narcolepsy-associated immune pheno-types. Apart from these patient characteristics, it is possible that independent from narcolepsy, the genetic background contributes to this immune polarization over time. How-ever, to control for this effect, we matched the HD with Figure 4. Stability of the narcolepsy-related immune phenotypes
across independent experiments and different draws.
Log-trans-formed frequencies of all previously defined immune phenotypes assessed by multiple measurements. (A) Different aliquots from the same draws were repeatedly measured in independent experiments (two independent repetitions; n = 10, left; n = 12, right). (B) Repeated measurements of nar-colepsy samples from different blood draws (n = 12). Correlation coeffi-cients were calculated using a linear regression model.
Figure 5. Immune phenotypes of narcolepsy patients stratified for Pandemrix vaccination.
Benjamini-Hoch-berg corrected log-transformed p-values derived from Mann-Whitney-Wilcoxon tests comparing Pandemrix-vac-cinated (n = 11) with non-Pandemrix vacPandemrix-vac-cinated narcolepsy patients (n = 12). Only narcolepsy patients matched for dis-ease duration and age were included in this comparison. The horizontal line indicates p-values that are considered signif-icant with a FDR < 10%.
regard to the major susceptibility gene variant, presence of the HLA-DQB1*06:02 allele.
Contrasting with the increase of narcolepsy-associated cytokine patterns over time, elevated expression of CD69 on T cells from narcolepsy patients was most pronounced in younger patients with short disease duration, and decreased over time. Together with the modulation of cytokine pro-duction patterns, this suggests a progressive shift from early T cell activation to functional polarization. Longitudinal follow up of cohorts of patients with narcolepsy should help clarify this aspect.
Narcolepsy patients matched for age and short dis-ease duration but grouped into Pandemrix-vaccinated and non–Pandemrix-vaccinated were found to be largely indis-tinguishable by single-cell cytometry (Carr et al., 2016). In agreement with studies on genetic (Nguyen et al., 2016) and clinical (Pizza et al., 2014) features of post-Pandemrix versus sporadic narcolepsy, our results support a shared pathophys-iology regardless of vaccine association. Whether exposure to similar environmental factors (for instance vaccination vs. natural infection) is the reason for the lack of detectable differences between Pandemrix-vaccinated and
non–Pan-demrix-vaccinated patients remains to be determined. Lastly, although mass cytometry enabled us to simultaneously an-alyze 45 parameters and use this data to define numerous immunological phenotypes, this study mostly focused on lymphocyte activation, maturation, and cytokine production and did not include parameters necessary to study B cell mat-uration/activation in depth.
This analysis included a monozygotic twin pair where both siblings received Pandemrix-vaccination but only one developed narcolepsy. Although the narcolepsy-associated augmented CD69 expression was confirmed in this single pair, the cellular composition was found to be similar in both twins. Study of such monozygotic twin pairs in a clinical context can be extremely valuable. However, given the rel-ative rarity of narcolepsy, only a single twin pair could be included here, which limits the possibility to draw firm con-clusions regarding the pathogenesis of narcolepsy in geneti-cally identical individuals.
Given technical considerations and the limitation in sample availability of this rare disorder, this study addressed changes in the recirculating immune system but not the tis-sue-infiltrating leukocyte compartment of the CNS directly. Figure 6. narcolepsy-associated immune phenotypes are influenced by age and disease duration. Immune phenotypes of all narcolepsy patients
(n = 39) and HD (n = 25) were included in this analysis. (A) R2-values (top) and –log
10 of Benjamini-Hochberg–adjusted p-values (bottom) of linear
re-gression models relating immunological phenotypes with age in narcolepsy patients and HD. The horizontal line indicates p-values that are considered significant with a FDR < 10%. (B) Changes of selected immune phenotypes for narcolepsy patients (red) and HD (blue) with age. The shaded area represents the 95% confidence interval of the linear model. (C) Proportion of R2 for narcolepsy patients (n = 39) explained by disease duration and age. (D)
Benjami-ni-Hochberg-adjusted p-values of linear models relating immunological phenotypes in narcolepsy patients with clinical parameters.
However, recent studies suggest a previously underappreci-ated functional link between the CNS and peripheral im-munity (Kim et al., 2015; Louveau et al., 2015), and we thus believe that these results will be highly beneficial to guide future studies in generating more precise hypotheses which can be verified, e.g., in the CSF of patients.
Because of the unknown nature of a potential autoanti-gen in narcolepsy, we could not investigate the antiautoanti-gen-spec- antigen-spec-ificity of lymphocyte populations. This remains an aspect of great importance and it will be interesting to see whether the above-indicated expansion of certain T cell subsets would concur with a specific pattern of clonal expansion.
A surprisingly high frequency of T cells in patients with narcolepsy exhibited an inflammatory signature character-ized by elevated expression of activation markers or cyto-kine production. This frequency by far exceeds the expected frequency of (auto)antigen-specific T cells as detected by MHC/peptide tetramer staining in other contexts (Pepper et al., 2010; Yu et al., 2015). It is unlikely, due to lack of sen-sitivity of current tools, to selectively analyze disease-caus-ing autoreactive T cells, although innovative tools are now available to test this hypothesis provided autoantigens and HLA-binding peptide thereof, are identified (Huang et al., 2016). More likely, disease progression impacts on general im-mune cell activation and function. Precedent for broad T cell alterations in organ-specific autoimmune diseases has been reported, although the exact mechanisms involved still escape current understanding (McKinney et al., 2015).
Although sharing many clinical characteristics with type 1 narcolepsy, patients with other hypersomnias do not suffer from the lack of orexin-producing neurons and as-sociated cataplexy episodes, both of which are used for the diagnosis of narcolepsy. For this study, we measured CSF orexin levels for the majority of narcolepsy patients (32 of 39) and patients with other causes of hypersomnia (10 of 11), whereas the remaining were classified based on clin-ical parameters and the documented presence or absence of cataplexy according to International Classification of Sleep Disorders, third edition guidelines (American Acad-emy of Sleep Disorders, 2014). The impact of chronic depletion of the orexin neuropeptide on immune cell ac-tivation is unknown. It is tempting to speculate that orexin can affect immune cell biology and that its chronic defi-ciency in patients with narcolepsy somehow promotes gen-eral immune dysregulation.
Collectively, we believe that this high-dimensional, single-cell analysis approach represents a comprehensive account of the immunological signature found in narco-lepsy patients. It revealed narconarco-lepsy-associated immune activation and increased B cell–supporting cytokine pro-duction, the magnitude of which is dependent on disease duration and age. These findings thus offer insight into the nature of the underlying history and current periph-eral immune-milieu in this elusive disease. In addition, it provides a rationale for the further investigation of
lym-phocytes and associated effector mechanisms as therapeu-tic targets in narcolepsy.
MAterIALS And MetHodS Patient samples
Patients (Table 1 and Table S1) were characterized and their peripheral blood was collected at the National Reference Center for Orphan Sleep Disorders (Gui-de-Chauliac Hos-pital, Montpellier, France). Cryopreservation of PBMCs from patients and from healthy volunteers was performed at Institut National de la Santé et de la Recherche Médicale U1043 (Toulouse, France) within 24 h of blood collection. Narcolepsy type 1 was diagnosed according to International Classification of Sleep Disorders, third edition based on the presence of excessive daytime sleepiness, clear-cut cataplexy, ≥2 SOR EMPs, and mean sleep latency <8 min on the MSLT, or CSF orexin levels <110 pg/ml. A video documentation of clear-cut cataplexy was available to confirm the diagnosis in all patients without CSF orexin measurement. All patients were HLA-DQB1*06:02 positive. Samples defined as other sleep disorders showed normal CSF orexin concentrations, i.e., >200 pg/ml. All patients gave their written informed consent to take part in the research program, which was ap-proved by the local ethics committee (Comité de Protection des Personnes–Ile de France 06). All mass cytometry experi-ments and their initial analysis were performed blinded.
Genotyping
HLA typing of narcolepsy patients was performed by PCR sequence-specific oligonucleotides and four-digit allele as-signments were performed by Luminex xMAP technology. To resolve ambiguous typing or degeneracy, direct
PCR-se-quencing with the following primers was used: forward, 5
′-CCC GCA GAG GAT TTC GTG TT-3′; reverse, 5′-AAC TCC
GCC CGG GTC CC-3′. Internal control primers: forward,
5′-TGC CAA GTG GAG CAC CCAA-3′; reverse, 5′-GCA
TCTT-GCT CTG TGC AGAT-3′. Genomic DNA was
am-plified at 94°C for 15 min, followed by 35 cycles of 94°C for 1 min, 63°C for 1 min, 72°C for 1 min, and 72°C for 10 min. The amplification produced a 217-bp band in the presence of DQB1*06:02, and a 700–730-bp internal control band.
ex vivo reactivation of PBMcs
Cryopreserved PBMCs were stored in liquid nitrogen until thawing in a 37°C water bath for 7 min. Cells were resus-pended gently in 1 ml of prewarmed cell culture medium (CCM; RPMI-1640 [PAN biotech], 10% FCS [Biochrom]), 1× l-glutamine, and 1× penicillin/streptomycin [both Life Technologies]) supplemented with 1:10,000 benzonase (Sigma-Aldrich), transferred into tubes containing 10 ml of CCM, and centrifuged (300 rcf, 7 min, 24°C). Washing with CCM was repeated once before counting and adjusting to
106 cells/ml in CCM and resting overnight at 37°C. To
deter-mine cytokine production by mass cytometry, cells were stim-ulated with 50 ng/ml phorbol 12-myristate 13-acetate (PMA;
Sigma-Aldrich) and 500 ng/ml ionomycin (Sigma-Aldrich) in the presence of 1x Brefeldin A (BD) for 4 h at 37°C.
Antibodies
Monoclonal anti–human antibodies (Table S2) were pur-chased either preconjugated to heavy-metal isotopes from Fluidigm or from commercial suppliers in purified form and conjugated in house using the Maxpar X8 chelating polymer kit (Fluidigm) according to the manufacturer's instructions.
Live cell barcoding
To reduce inter-sample staining variability, minimize sam-ple-handling time, and reduce antibody consumption, we made use of the live-cell barcoding approach (Mei et al., 2015). Therefore, isothiocyanobenzyl-EDTA (p-SCN-EDTA; Dojindo) was loaded with five different palladium isotopes (104Pd, 105Pd, 106Pd, 108Pd, and 110Pd) and one indium isotope
(115In; all from Trace Sciences International) as previously
de-scribed (Zunder et al., 2015) and subsequently used to label anti–human CD45 (BioLegend). In addition, preconjugated
89Y-CD45 (Fluidigm) was used as a seventh barcoding reagent.
To obtain robust barcoding results with even staining intensity on all samples, either a 6-choose-2 or a 7-choose-3 scheme was used, resulting in 15 or 35 different combinations of two heavy metal–labeled CD45 antibodies, respectively. PBMCs were labeled with metal-tagged CD45 antibodies after ex vivo reactivation at 37°C for 25 min in cell staining medium (CSM; RPMI-1640, 4% FCS) on a rotating shaker (500 rpm). Samples were washed twice in CSM and combined into a single reac-tion vessel for further staining steps.
Surface staining
After live cell barcoding, the combined sample was centri-fuged, supernatant was aspirated, and cells were resuspended in 300 µl of antibodies (Table S2) in CSM. Cells were stained for 20 min at 37°C on a rotating shaker (500 rpm) to opti-mize CCR staining (Berhanu et al., 2003). Dead cells were excluded by adding 1 ml of 2.5 µM cisplatin (Sigma-Aldrich) in PBS at the end of the staining period and incubating for 2 min on ice (Fienberg et al., 2012). Afterward, the sample was washed once in PBS supplemented with 0.5% BSA (PBS/BSA; Sigma-Aldrich).
Intracellular cytokine staining
Surface-stained cells were fixed by resuspending them in 1.6% paraformaldehyde (PFA; Electron Microscopy Sciences) for 30 min at 4°C on a rotary shaker (500 rpm). Afterward, the sample was washed twice with permeabilization buffer (PBS, 0.5% saponin, 2% BSA, and 0.01% sodium azide [all from Sigma-Aldrich]), the supernatant was aspirated and the sam-ple was resuspended in 300 µl of antibody mixture (Table S2) in permeabilization buffer for 1 h at 4°C on a rotary shaker (500 rpm). The sample was washed with permeabilization buffer, supernatant was aspirated, and the cells were resus-pended in 500 µl of iridium intercalator solution (Fluidigm)
overnight. Next, the sample was washed twice with PBS/
BSA, once with ddH2O, resuspended at 0.5–106 cells/ml and
filtered through a cell strainer cap (Falcon) before acquisition.
Acquisition on cytoF2 mass cytometer and data preprocessing
Samples were acquired on a CyTOF2 mass cytometer (DVS Sciences/Fluidigm). Quality control and tuning processes were performed on a daily basis before acquisition. Data from different days was normalized by adding five-element beads (Fluidigm) to the sample immediately before acquisition and using the Matlab-based normalization software as described previously (Finck et al., 2013). Only events with Event_ length between 10 and 100 were exported. Before down-stream analysis, live cells were exported by manual gating on Event_length, DNA (191Ir and 193Ir), and live cells (195Pt)
using FlowJo software (Tree Star). Next, cells were assigned to their initial samples using a dedicated debarcoding software (Zunder et al., 2015). Bead-normalized files were imported into the R environment and transformed using an inverse hyperbolic sine (arcsinh) function with a cofactor of 5 (Ben-dall et al., 2011). To equalize the contribution of each marker in subsequent automated data analysis steps, we performed background subtraction and percentile normalization (Levine et al., 2015). Therefore, we normalized all data to the 99.5th percentile of the combined (barcoded) sample. This preserves inter-sample variability in maximum expression values, which might be biologically relevant. Markers expressed with a low frequency of PBMCs (mostly cytokines) were normalized to the 99.995th percentile.
Automated population identification in high-dimensional data analysis
After preprocessing, all samples from all cohorts were down sampled to a maximum of 100’000 cells per sample, com-bined into one file and subjected to the FlowSOM clustering algorithm to identify meaningful immunological populations. We choose FlowSOM over other clustering options for sev-eral reasons: (i) in our hands it identified clusters which ef-ficiently represented immune populations that we expected to be present based on prior biological knowledge, (ii) its availability within the R environment which enabled us to perform large parts of the analysis in a streamlined way, (iii) it was able to perform clusterings within a few minutes on a standard desktop computer enabling us to run it multiple times and thus compare the influence of different input pa-rameters, especially the k-value used in the meta-clustering step. FlowSOM was run on the combined sample to facilitate the identification of small populations that could be over-looked when clustering is performed on each single sample. After the initial clustering step, resulting nodes were subjected to meta-clustering. The respective k-value was chosen manu-ally and in a way so that we were still able to identify all pop-ulations that were expected to be present, based on general biological knowledge. Heat maps display median expression
levels for the indicated populations and were drawn using the ggplot2 R package. Dendrograms were calculated using hi-erarchical clustering. Correlation coefficients were calculated using the stats package.
Statistical analysis
Population frequencies or medians in narcolepsy and HD samples were compared using a nonparametric Mann-Whit-ney-Wilcoxon test. Samples with a low live cell count were excluded from the final analysis. In case we tested for the mod-ulation of multiple markers or clusters at once, we controlled for multiple comparisons by using the Benjamini-Hochberg approach using R (Noble, 2009; McDonald, 2014). P-values were reported together with an estimate of the false discovery rate with which the p-values would be considered significant. Linear regression was performed with the R base function lm and the relative contributions were calculated with the relaimpo package (Grömping, 2006).
online supplemental material
Table S1 shows clinical and demographic characteristics of all individuals evaluated in this study. Table S2 shows the heavy metal-labeled antibody panel for mass cytometry. Table S3 shows frequencies of the reported immune phenotypes for all individuals evaluated in this study. Tables S1–S3 are available as Excel files.
AcknowLedGMentS
We acknowledge Raphaelle Romieu-Mourez and Pierre-Emmanuel Paulet of the Tou-louse immunomonitoring platform for the PBMC biobank and we thank V. Tosevski (Mass Cytometry Facility, University of Zurich) for technical assistance and helpful discussions regarding all aspects of mass cytometry.
This study was supported by grants from the Swiss National Science Foundation 316030_150768 (to B. Becher) and 310030_146130 (to B. Becher), Toulouse Univer-sity (Idex grant Emergence 2013 to R.S. Liblau), ANR (CE14-0016-03 to Y. Dauvilliers and R.S. Liblau), the Occitanie Region (to X.-H. Nguyen), and Toulouse (R.S. Liblau) and Montpellier (Y. Dauvilliers) centers of excellence in neurodegenerative diseases.
The authors declare no competing financial interests.
Author contributions: F.J. Hartmann, R.S. Liblau, and B. Becher designed the ex-periments and analyzed the data. F.J. Hartmann performed the exex-periments. D. Mrd-jen, E. Galli, and C. Krieg assisted with the experiments. Y. Dauvilliers characterized all the patients with sleep disorders involved in this study and revised the manuscript. R. Bernard-Valnet, C. Quériault, and X.-H. Nguyen collected and characterized PBMCs from all the subjects studied. L.M. Weber and M.D. Robinson provided support for data analysis. F.J. Hartmann, R.S. Liblau, and B. Becher wrote the manuscript. R.S. Li-blau and B. Becher supervised and funded the study.
Submitted: 11 June 2016 Revised: 7 September 2016 Accepted: 7 October 2016
reFerenceS
Ackermann, K., V.L. Revell, O. Lao, E.J. Rombouts, D.J. Skene, and M. Kayser. 2012. Diurnal rhythms in blood cell populations and the effect of acute sleep deprivation in healthy young men. Sleep. 35:933–940. http ://dx .doi .org /10 .5665 /sleep .1954
Ahmed, S.S., W. Volkmuth, J. Duca, L. Corti, M. Pallaoro, A. Pezzicoli, A. Karle, F. Rigat, R. Rappuoli, V. Narasimhan, et al. 2015. Antibodies to influenza
nucleoprotein cross-react with human hypocretin receptor 2. Sci. Transl.
Med. 7:294ra105. http ://dx .doi .org /10 .1126 /scitranslmed .aab2354
Aho, V., H.M. Ollila, V. Rantanen, E. Kronholm, I. Surakka, W.M.A. van Leeuwen, M. Lehto, S. Matikainen, S. Ripatti, M. Härmä, et al. 2013. Partial sleep restriction activates immune response-related gene expression pathways: experimental and epidemiological studies in humans. PLoS One. 8:e77184. http ://dx .doi .org /10 .1371 /journal .pone .0077184
American Academy of Sleep Disorders. 2014. International Classification of Sleep Disorders. Third edition. M. Sateia, editor. American Academy of Sleep Medicine, Darien, IL. 383 pp.
Amir, A.D., K.L. Davis, M.D. Tadmor, E.F. Simonds, J.H. Levine, S.C. Bendall, D.K. Shenfeld, S. Krishnaswamy, G.P. Nolan, and D. Pe’er. 2013. viSNE enables visualization of high dimensional single-cell data and reveals phenotypic heterogeneity of leukemia. Nat. Biotechnol. 31:545–552. http ://dx .doi .org /10 .1038 /nbt .2594
Becher, B., and S. Pantelyushin. 2012. Hiding under the skin: Interleukin-17-producing γδ T cells go under the skin? Nat. Med. 18:1748–1750. http ://dx .doi .org /10 .1038 /nm .3016
Behbehani, G.K., N. Samusik, Z.B. Bjornson, W.J. Fantl, B.C. Medeiros, and G.P. Nolan. 2015. Mass Cytometric Functional Profiling of Acute Myeloid Leukemia Defines Cell-Cycle and Immunophenotypic Properties That Correlate with Known Responses to Therapy. Cancer
Discov. 5:988–1003. http ://dx .doi .org /10 .1158 /2159 -8290 .CD -15 -0298
Bendall, S.C., E.F. Simonds, P. Qiu, A.D. Amir, P.O. Krutzik, R. Finck, R.V. Bruggner, R. Melamed, A. Trejo, O.I. Ornatsky, et al. 2011. Single-cell mass cytometry of differential immune and drug responses across a human hematopoietic continuum. Science. 332:687–696. http ://dx .doi .org /10 .1126 /science .1198704
Bendall, S.C., G.P. Nolan, M. Roederer, and P.K. Chattopadhyay. 2012. A deep profiler’s guide to cytometry. Trends Immunol. 33:323–332. http :// dx .doi .org /10 .1016 /j .it .2012 .02 .010
Bergman, P., C. Adori, S. Vas, Y. Kai-Larsen, T. Sarkanen, A. Cederlund, B. Agerberth, I. Julkunen, B. Horvath, D. Kostyalik, et al. 2014. Narcolepsy patients have antibodies that stain distinct cell populations in rat brain and influence sleep patterns. Proc. Natl. Acad. Sci. USA. 111:E3735– E3744. http ://dx .doi .org /10 .1073 /pnas .1412189111
Berhanu, D., F. Mortari, S.C. De Rosa, and M. Roederer. 2003. Optimized lymphocyte isolation methods for analysis of chemokine receptor expression. J. Immunol. Methods. 279:199–207. http ://dx .doi .org /10 .1016 /S0022 -1759(03)00186 -8
Bernard-Valnet, R., L. Yshii, C. Quériault, X.-H. Nguyen, S. Arthaud, M. Rodrigues, A. Canivet, A.-L. Morel, A. Matthys, J. Bauer, et al. 2016. CD8 T cell-mediated killing of orexinergic neurons induces a narcolepsy-like phenotype in mice. Proc. Natl. Acad. Sci. USA. 113:10956–10961. http :// dx .doi .org /10 .1073 /pnas .1603325113
Carr, E.J., J. Dooley, J.E. Garcia-Perez, V. Lagou, J.C. Lee, C. Wouters, I. Meyts, A. Goris, G. Boeckxstaens, M.A. Linterman, and A. Liston. 2016. The cellular composition of the human immune system is shaped by age and cohabitation. Nat. Immunol. 17:461–468. http ://dx .doi .org /10 .1038 /ni .3371
Cvetkovic-Lopes, V., L. Bayer, S. Dorsaz, S. Maret, S. Pradervand, Y. Dauvilliers, M. Lecendreux, G.-J. Lammers, C.E.H.M. Donjacour, R.A. Du Pasquier, et al. 2010. Elevated Tribbles homolog 2-specific antibody levels in narcolepsy patients. J. Clin. Invest. 120:713–719. http ://dx .doi .org /10 .1172 /JCI41366
Dauvilliers, Y., I. Arnulf, and E. Mignot. 2007. Narcolepsy with cataplexy.
Lancet. 369:499–511. http ://dx .doi .org /10 .1016 /S0140 -6736(07)60237
-2
Dauvilliers, Y., I. Jaussent, M. Lecendreux, S. Scholz, S. Bayard, J.P. Cristol, H. Blain, and A.-M. Dupuy. 2014. Cerebrospinal fluid and serum cytokine
profiles in narcolepsy with cataplexy: a case-control study. Brain Behav.
Immun. 37:260–266. http ://dx .doi .org /10 .1016 /j .bbi .2013 .12 .019
Dendrou, C.A., L. Fugger, and M.A. Friese. 2015. Immunopathology of multiple sclerosis. Nat. Rev. Immunol. 15:545–558. http ://dx .doi .org /10 .1038 /nri3871
Fienberg, H.G., E.F. Simonds, W.J. Fantl, G.P. Nolan, and B. Bodenmiller. 2012. A platinum-based covalent viability reagent for single-cell mass cytometry. Cytometry A. 81:467–475. http ://dx .doi .org /10 .1002 /cyto .a .22067
Filiano, A.J., Y. Xu, N.J. Tustison, R.L. Marsh, W. Baker, I. Smirnov, C.C. Overall, S.P. Gadani, S.D. Turner, Z. Weng, et al. 2016. Unexpected role of interferon-γ in regulating neuronal connectivity and social behaviour.
Nature. 535:425–429. http ://dx .doi .org /10 .1038 /nature18626
Finck, R., E.F. Simonds, A. Jager, S. Krishnaswamy, K. Sachs, W. Fantl, D. Pe’er, G.P. Nolan, and S.C. Bendall. 2013. Normalization of mass cytometry data with bead standards. Cytometry A. 83:483–494. http ://dx .doi .org /10 .1002 /cyto .a .22271
Flach, A.-C., T. Litke, J. Strauss, M. Haberl, C.C. Gómez, M. Reindl, A. Saiz, H.-J. Fehling, J. Wienands, F. Odoardi, et al. 2016. Autoantibody-boosted T-cell reactivation in the target organ triggers manifestation of autoimmune CNS disease. Proc. Natl. Acad. Sci. USA. 113:3323–3328. http ://dx .doi .org /10 .1073 /pnas .1519608113
Gaudillière, B., G.K. Fragiadakis, R.V. Bruggner, M. Nicolau, R. Finck, M. Tingle, J. Silva, E.A. Ganio, C.G. Yeh, W.J. Maloney, et al. 2014. Clinical recovery from surgery correlates with single-cell immune signatures.
Sci. Transl. Med. 6:255ra131. http ://dx .doi .org /10 .1126 /scitranslmed
.3009701
Grömping, U. 2006. Relative Importance for Linear Regression in R: The Package relaimpo. J. Stat. Softw. 17:1–27. http ://dx .doi .org /10 .18637 / jss .v017 .i01
Han, F., J. Faraco, X.S. Dong, H.M. Ollila, L. Lin, J. Li, P. An, S. Wang, K.W. Jiang, Z.C. Gao, et al. 2013. Genome wide analysis of narcolepsy in China implicates novel immune loci and reveals changes in association prior to versus after the 2009 H1N1 influenza pandemic. PLoS Genet. 9:e1003880. http ://dx .doi .org /10 .1371 /journal .pgen .1003880 Himmerich, H., P.A. Beitinger, S. Fulda, R. Wehrle, J. Linseisen, G. Wolfram,
S. Himmerich, K. Gedrich, T.C. Wetter, and T. Pollmächer. 2006. Plasma levels of tumor necrosis factor alpha and soluble tumor necrosis factor receptors in patients with narcolepsy. Arch. Intern. Med. 166:1739–1743. http ://dx .doi .org /10 .1001 /archinte .166 .16 .1739
Hohjoh, H., T. Nakayama, J. Ohashi, T. Miyagawa, H. Tanaka, T. Akaza, Y. Honda, T. Juji, and K. Tokunaga. 1999. Significant association of a single nucleotide polymorphism in the tumor necrosis factor-alpha (TNF-alpha) gene promoter with human narcolepsy. Tissue Antigens. 54:138– 145. http ://dx .doi .org /10 .1034 /j .1399 -0039 .1999 .540204 .x
Huang, J., X. Zeng, N. Sigal, P.J. Lund, L.F. Su, H. Huang, Y.H. Chien, and M.M. Davis. 2016. Detection, phenotyping, and quantification of antigen-specific T cells using a peptide-MHC dodecamer. Proc. Natl.
Acad. Sci. USA. 113:E1890–E1897. http ://dx .doi .org /10 .1073 /pnas
.1602488113
Kim, M.S., J. Yan, W. Wu, G. Zhang, Y. Zhang, and D. Cai. 2015. Rapid linkage of innate immunological signals to adaptive immunity by the brain-fat axis. Nat. Immunol. 16:525–533. http ://dx .doi .org /10 .1038 /ni .3133 Kornum, B.R., F. Pizza, S. Knudsen, G. Plazzi, P. Jennum, and E. Mignot.
2015. Cerebrospinal fluid cytokine levels in type 1 narcolepsy patients very close to onset. Brain Behav. Immun. 49:54–58. http ://dx .doi .org /10 .1016 /j .bbi .2015 .03 .004
Krumbholz, M., T. Derfuss, R. Hohlfeld, and E. Meinl. 2012. B cells and antibodies in multiple sclerosis pathogenesis and therapy. Nat. Rev.
Neurol. 8:613–623. http ://dx .doi .org /10 .1038 /nrneurol .2012 .203
Lasselin, J., J.U. Rehman, T. Åkerstedt, M. Lekander, and J. Axelsson. 2015. Effect of long-term sleep restriction and subsequent recovery sleep on
the diurnal rhythms of white blood cell subpopulations. Brain Behav.
Immun. 47:93–99. http ://dx .doi .org /10 .1016 /j .bbi .2014 .10 .004
Levine, J.H., E.F. Simonds, S.C. Bendall, K.L. Davis, A.D. Amir, M.D. Tadmor, O. Litvin, H.G. Fienberg, A. Jager, E.R. Zunder, et al. 2015. Data-Driven Phenotypic Dissection of AML Reveals Progenitor-like Cells that Correlate with Prognosis. Cell. 162:184–197. http ://dx .doi .org /10 .1016 /j .cell .2015 .05 .047
Liblau, R.S., A. Vassalli, A. Seifinejad, and M. Tafti. 2015. Hypocretin (orexin) biology and the pathophysiology of narcolepsy with cataplexy. Lancet
Neurol. 14:318–328. http ://dx .doi .org /10 .1016 /S1474 -4422(14)70218
-2
Louveau, A., I. Smirnov, T.J. Keyes, J.D. Eccles, S.J. Rouhani, J.D. Peske, N.C. Derecki, D. Castle, J.W. Mandell, K.S. Lee, et al. 2015. Structural and functional features of central nervous system lymphatic vessels. Nature. 523:337–341. http ://dx .doi .org /10 .1038 /nature14432
Mair, F., F.J. Hartmann, D. Mrdjen, V. Tosevski, C. Krieg, and B. Becher. 2016. The end of gating? An introduction to automated analysis of high dimensional cytometry data. Eur. J. Immunol. 46:34–43. http ://dx .doi .org /10 .1002 /eji .201545774
McDonald, J. 2014. Handbook of Biological Statistics. Third edition. Sparky House Publishing, Baltimore, Maryland.
McKinney, E.F., J.C. Lee, D.R.W. Jayne, P.A. Lyons, and K.G.C. Smith. 2015. T-cell exhaustion, co-stimulation and clinical outcome in autoimmunity and infection. Nature. 523:612–616. http ://dx .doi .org /10 .1038 / nature14468
Mei, H.E., M.D. Leipold, A.R. Schulz, C. Chester, and H.T. Maecker. 2015. Barcoding of live human peripheral blood mononuclear cells for multiplexed mass cytometry. J. Immunol. 194:2022–2031. http ://dx .doi .org /10 .4049 /jimmunol .1402661
Mignot, E., R. Hayduk, J. Black, F.C. Grumet, and C. Guilleminault. 1997. HLA DQB1*0602 is associated with cataplexy in 509 narcoleptic pa-tients. Sleep. 20:1012–1020.
Nguyen, X.-H., A. Saoudi, and R.S. Liblau. 2016. Vaccine-associated inflammatory diseases of the central nervous system: from signals to causation. Curr. Opin. Neurol. 29:362–371. http ://dx .doi .org /10 .1097 / WCO .0000000000000318
Noble, W.S. 2009. How does multiple testing correction work? Nat. Biotechnol. 27:1135–1137. http ://dx .doi .org /10 .1038 /nbt1209 -1135
Ollila, H.M., J.-M. Ravel, F. Han, J. Faraco, L. Lin, X. Zheng, G. Plazzi, Y. Dauvilliers, F. Pizza, S.-C. Hong, et al. 2015. HLA-DPB1 and HLA class I confer risk of and protection from narcolepsy. Am. J. Hum. Genet. 96:136–146. http ://dx .doi .org /10 .1016 /j .ajhg .2014 .12 .010
Pepper, M., J.L. Linehan, A.J. Pagán, T. Zell, T. Dileepan, P.P. Cleary, and M.K. Jenkins. 2010. Different routes of bacterial infection induce long-lived Th1 memory cells and short-lived TH17 cells. Nat. Immunol. 11:83–89. http ://dx .doi .org /10 .1038 /ni .1826
Perera, G.K., P. Di Meglio, and F.O. Nestle. 2012. Psoriasis. Annu. Rev.
Pathol. 7:385–422. http ://dx .doi .org /10 .1146 /annurev -pathol -011811
-132448
Pizza, F., H. Peltola, T. Sarkanen, K.K. Moghadam, G. Plazzi, and M. Partinen. 2014. Childhood narcolepsy with cataplexy: comparison between post-H1N1 vaccination and sporadic cases. Sleep Med. 15:262–265. http ://dx .doi .org /10 .1016 /j .sleep .2013 .09 .021
Saariaho, A.-H., A. Vuorela, T.L. Freitag, F. Pizza, G. Plazzi, M. Partinen, O. Vaarala, and S. Meri. 2015. Autoantibodies against ganglioside GM3 are associated with narcolepsy-cataplexy developing after Pandemrix vaccination against 2009 pandemic H1N1 type influenza virus. J.
Autoimmun. 63:68–75. http ://dx .doi .org /10 .1016 /j .jaut .2015 .07 .006
Scammell, T.E. 2015. Narcolepsy. N. Engl. J. Med. 373:2654–2662. http ://dx .doi .org /10 .1056 /NEJMra1500587
Scheiermann, C., Y. Kunisaki, and P.S. Frenette. 2013. Circadian control of the immune system. Nat. Rev. Immunol. 13:190–198. http ://dx .doi .org /10 .1038 /nri3386
Spitzer, M.H., P.F. Gherardini, G.K. Fragiadakis, N. Bhattacharya, R.T. Yuan, A.N. Hotson, R. Finck, Y. Carmi, E.R. Zunder, W.J. Fantl, et al. 2015. IMM UNO LOGY. An interactive reference framework for modeling a dynamic immune system. Science. 349:1259425. http ://dx .doi .org /10 .1126 /science .1259425
Tafti, M., H. Hor, Y. Dauvilliers, G.J. Lammers, S. Overeem, G. Mayer, S. Javidi, A. Iranzo, J. Santamaria, R. Peraita-Adrados, et al. 2014. DQB1 locus alone explains most of the risk and protection in narcolepsy with cataplexy in Europe. Sleep. 37:19–25. http ://dx .doi .org /10 .5665 /sleep .3300
Tafti, M., G.J. Lammers, Y. Dauvilliers, S. Overeem, G. Mayer, J. Nowak, C. Pfister, V. Dubois, J.-F. Eliaou, H.-P. Eberhard, et al. 2016. Narcolepsy-Associated HLA Class I Alleles Implicate Cell-Mediated Cytotoxicity.
Sleep. 39:581–587. http ://dx .doi .org /10 .5665 /sleep .5532
Tanaka, S., M. Honda, H. Toyoda, and T. Kodama. 2014. Increased plasma IL-6, IL-8, TNF-alpha, and G-CSF in Japanese narcolepsy. Hum. Immunol. 75:940–944. http ://dx .doi .org /10 .1016 /j .humimm .2014 .06 .023 Van Der Maaten, L., and G. Hinton. 2008. Visualizing Data using t-SNE. J.
Mach. Learn. Res. 9:2579–2605. http ://dx .doi .org /10 .1007 /s10479 -011
-0841 -3
Van Gassen, S., B. Callebaut, M.J. Van Helden, B.N. Lambrecht, P. Demeester, T. Dhaene, and Y. Saeys. 2015. FlowSOM: Using self-organizing maps for
visualization and interpretation of cytometry data. Cytometry A. 87:636– 645. http ://dx .doi .org /10 .1002 /cyto .a .22625
Vgontzas, A.N., D.A. Papanicolaou, E.O. Bixler, A. Kales, K. Tyson, and G.P. Chrousos. 1997. Elevation of plasma cytokines in disorders of excessive daytime sleepiness: role of sleep disturbance and obesity. J. Clin. Endocrinol.
Metab. 82:1313–1316. http ://dx .doi .org /10 .1210 /jcem .82 .5 .3950
Waisman, A., R.S. Liblau, and B. Becher. 2015. Innate and adaptive immune responses in the CNS. Lancet Neurol. 14:945–955. http ://dx .doi .org /10 .1016 /S1474 -4422(15)00141 -6
Wolowczuk, I., C. Verwaerde, O. Viltart, A. Delanoye, M. Delacre, B. Pot, and C. Grangette. 2008. Feeding our immune system: impact on metabolism.
Clin. Dev. Immunol. 2008:639803. http ://dx .doi .org /10 .1155 /2008
/639803
Yshii, L., C. Gebauer, R. Bernard-Valnet, and R. Liblau. 2015. Neurons and T cells: Understanding this interaction for inflammatory neurological diseases. Eur. J. Immunol. 45:2712–2720. http ://dx .doi .org /10 .1002 /eji .201545759
Yu, W., N. Jiang, P.J.R. Ebert, B.A. Kidd, S. Müller, P.J. Lund, J. Juang, K. Adachi, T. Tse, M.E. Birnbaum, et al. 2015. Clonal deletion prunes but does not eliminate self-specific αβ CD8(+) T lymphocytes. Immunity. 42:929–941. http ://dx .doi .org /10 .1016 /j .immuni .2015 .05 .001 Zunder, E.R., R. Finck, G.K. Behbehani, A.D. Amir, S. Krishnaswamy, V.D.
Gonzalez, C.G. Lorang, Z. Bjornson, M.H. Spitzer, B. Bodenmiller, et al. 2015. Palladium-based mass tag cell barcoding with a doublet-filtering scheme and single-cell deconvolution algorithm. Nat. Protoc. 10:316– 333. http ://dx .doi .org /10 .1038 /nprot .2015 .020