Drivers of abrupt Holocene shifts in West Antarctic ice stream
direction determined from combined ice sheet modelling and
geologic signatures
C.J. FOGWILL1, C.S.M. TURNEY1, N.R. GOLLEDGE2,3, D.H. ROOD4, K. HIPPE5,6, L. WACKER6, R. WIELER5,
E.B. RAINSLEY7and R.S. JONES2
1
Climate Change Research Centre, University of New South Wales, Sydney, NSW 2052, Australia
2
Antarctic Research Centre, Victoria University of Wellington, Wellington 6140, New Zealand
3
GNS Science, Avalon, Lower Hutt 5011, New Zealand
4
Scottish Universities Environmental Research Centre (SUERC), East Kilbride G75 0QF, UK
5
Institute of Geochemistry and Petrology, ETH Zürich, CH-8092 Zürich, Switzerland
6Institute for Particle Physics, ETH Zürich, CH-8093 Zürich, Switzerland 7
Unaffiliated [email protected]
Abstract: Determining the millennial-scale behaviour of marine-based sectors of the West Antarctic Ice Sheet (WAIS) is critical to improve predictions of the future contribution of Antarctica to sea level rise. Here high-resolution ice sheet modelling was combined with new terrestrial geological constraints (in situ14C and10Be analysis) to reconstruct the evolution of two major ice streams entering the Weddell Sea over 20 000 years. The results demonstrate how marked differences in iceflux at the marine margin of the expanded Antarctic ice sheet led to a major reorganization of ice streams in the Weddell Sea during the last deglaciation, resulting in the eastward migration of the Institute Ice Stream, triggering a significant regional change in ice sheet mass balance during the early to mid Holocene. Thefindings highlight how spatial variability in ice flow can cause marked changes in the pattern,flux and flow direction of ice streams on millennial timescales in this marine ice sheet setting. Given that this sector of the WAIS is assumed to be sensitive to ocean-forced instability and may be influenced by predicted twenty-first century ocean warming, our ability to model and predict abrupt and extensive ice stream diversions is key to a realistic assessment of future ice sheet sensitivity.
Received 13 May 2014, Accepted 14 July 2014
Key words: cosmogenic isotopes, ice stream dynamics, in situ14C, marine ice sheet instability, Weddell Sea, West Antarctic Ice Sheet
Introduction
Recent observations of rapidly accelerating West Antarctic outlet glaciers have prompted a radical shift in the way the sensitivity of marine-terminating ice sheets to ocean forcing is viewed (Rignot et al. 2014). Critical to this
debate is the influence of subglacial topography on
marine-based ice sheet dynamics (commonly referred to as the marine ice sheet instability hypothesis) where positive ice-loss feedbacks may occur when the grounding line is both below sea level and within a basin which deepens towards the centre of the ice sheet (Weertman 1974, Thomas & Bentley 1978). Decadal-scale changes consistent with this mechanism have been implicated in several key outlets of the West Antarctic Ice Sheet (WAIS) (Rignot et al. 2014), suggesting that even small changes at the margins of the Antarctic ice sheets may trigger far-reaching changes in the interior of the Antarctic ice sheet through ice streams, narrow corridors of enhanced iceflow, which control the mass balance of the
Antarctic ice sheets (Cuffey 2011, Golledge et al. 2012, Rignot et al. 2014). However, it remains unclear whether such a long-term transformation in ice sheet dynamics will take place, potentially leading to future collapse and associated rapid sea level rise (Bamber et al. 2009, Rignot et al. 2014). Therefore, understanding the mechanisms that control enhanced flow is key to predicting future WAIS stability (Cuffey 2011, Rignot et al. 2011).
The Weddell Sea embayment (WSE) of Antarctica potentially offers significant insights into this debate. Today the extensive Filchner-Ronne Ice Shelf of the Weddell Sea is partially sustained by the inflow of nine large ice streams that together drain 22% of Antarctica, yet its detailed history of deglaciation since the Last Glacial Maximum (LGM), and particularly during the Holocene, remains poorly constrained (Larter et al. 2012, Stolldorf et al. 2012, Siegert et al. 2013, Hillenbrand et al. 2014). Whilst contemporary satellite remote sensing suggests a modest elevation of the ice sheet surface across much of the region in recent decades (Rignot et al. 2011), there is Antarctic Science 26(6), 674–686 (2014) © Antarctic Science Ltd 2014. This is an Open
Access article, distributed under the terms of the Creative Commons Attribution licence (http://creativecommons.org/licenses/by/3.0/), which permits unrestricted re-use,
distribution, and reproduction in any medium, provided the original work is properly cited. doi:10.1017/S0954102014000613
674
https:/www.cambridge.org/core/terms. https://doi.org/10.1017/S0954102014000613
a mounting body of evidence that indicates ice stream drainage patterns in the region were markedly different during the Holocene, implying that the region is sensitive to external forcings and thus may be vulnerable to past and potentially future change (Siegert et al. 2013). Evidence for this comes from interpretations of airborne
radar-echo sounding (RES), marine geophysical
investigations and satellite imagery, which suggests there has been substantial late Holocene reconfiguration of the ice streams in the Weddell Sea; however, the timing and, critically, the mechanisms driving these changes remain uncertain (Siegert et al. 2013). Understanding these
mechanisms is critical given twenty-first century
projections of ocean warming in the region (Hellmer et al. 2012, Fogwill et al. 2014), and the presence of extensive subglacial basins upstream of the present-day grounding line (Ross et al. 2012).
To assess the response of ice stream configuration in the Weddell Sea to external forcing since the LGM this study generates new high-resolution, whole-continent ice sheet model simulations for comparison with detailed terrestrial and marine geochronological constraints. The combination of these detailed geological ice sheet constraints with the high-resolution palaeo ice sheet model simulations to examine the drivers of ice sheet change over the last 20 000 years allows the response of ice streams to ocean forcing and sea level rise during the transition between
the glacial and interglacial world to be investigated, improving our understanding of ice dynamic responses of the ice streams in the Weddell Sea and wider WAIS to ocean perturbations. Recent studies (e.g. Larter et al. 2012) postulate that three major cross-shelf troughs may have played a role in controlling WSE dynamics during deglaciation, the Rutford Trough (or Ronne Depression), the Hughes Trough and the Thiel Trough (or Filchner or Crary Trough). The combination of high-resolution ice sheet modelling and geological constraints in this study allows the role of these features to be explored more fully.
Ice sheet model simulations
Here the results of high-resolution ice sheet modelling experiments that investigate the dynamic response of an LGM-configuration Antarctic ice sheet to ocean forcing (Golledge et al. 2012, 2013) are presented. The parallel ice sheet model (PISM) is used, a 3-D, thermomechanical, continental ice sheet model, constrained by published geological data that define lateral and vertical extents of the expanded Antarctic ice sheets around the time of the LGM (Golledge et al. 2012). The model combines the shallow-ice and shallow-shelf approximation equations across the entire domain. Therefore, the model is able to capture the dynamic behaviour within grounded ice
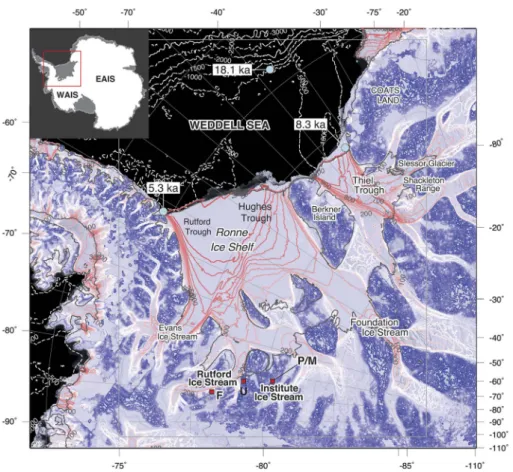
Fig. 1. Weddell Sea embayment (WSE) indicating the sampling locations next to the Rutford and Institute ice streams. Ice sheet surface velocity data (Rignot et al. 2011) highlight the locations of the major ice streams in light colours, and ice rises and slow moving regions in the WSE in darker blue. The sites of marine cores and associated minimum ages for grounding line retreat based upon marine
radiocarbon ages (Hillenbrand et al.
2014) are also shown. F= Flower
Hills, U= Union Glacier,
P/M= Patriot and Marble hills.
DRIVERS OF ABRUPT HOLOCENE SHIFTS IN WEST ANTARCTICA 675
https:/www.cambridge.org/core/terms. https://doi.org/10.1017/S0954102014000613
of Antarctic ice sheets and simulate the drawdown of interior ice by ice streams at high resolution (5 km). In this study, the model uses proxy-based interpretations of oceanic (Lisiecki et al. 2005, Imbrie et al. 2006) and atmospheric (Petit et al. 1999) changes during the last glacial cycle and employs boundary distributions from
modified Bedmap topography (Le Brocq et al. 2010),
temperature and precipitation fields from gridded
datasets (Comiso 2000, Van de Berg 2006), and a
spatially varying geothermal heat flux interpolation
(Shapiro & Ritzwoller 2004).
The ice sheet model computes ice thickness and temperature changes, isostatic depression of topography, migration of grounding lines and the growth of ice shelves. Interaction between modelled ice shelves and their surrounding ocean is accounted for using a mass
balance determination based on heat flux across the
ice-water boundary. Our perturbation experiments use isochronous changes to oceanic heat flux and sea level values. The ice sheet model simulations are based on ocean-perturbation experiments in which the oceanic heatflux and sea level are isochronously increased from 30% to 100% of glacial to interglacial transition values, and by 25 m and 50 m, with respect to LGM values, representative of Holocene values. The response of the ice sheet is considered in terms of changes in velocity
and ice thickness which together yield mass flux and,
importantly, changes in iceflow direction. Geological and geochronological constraints
To provide a temporal context for the modelled ice stream response, new and recalibrated existing geochronological data are used to reconstruct the geometric and temporal changes in the ice streams feeding the western part of the Weddell Sea following the LGM. The terrestrial record constrains altitudinal changes of the former ice stream surface, whereas offshore marine records, from radiocarbon dating of glaciomarine sediments overlying the subglacial deposits, constrain the lateral extent of the ice sheet in the WSE. Both are required to reconstruct the 3-D changes in ice stream geometry and investigate palaeo ice volume changes.
Marine geochronological constraints
The limited available analyses of marine sediment cores (including radiocarbon) from the outer and inner continental shelf of the WSE are used to constrain the lateral extent of the ice sheet, and provide the timing of ice sheet grounding line retreat and establishment of open water conditions (Larter et al. 2012, Stolldorf et al. 2012,
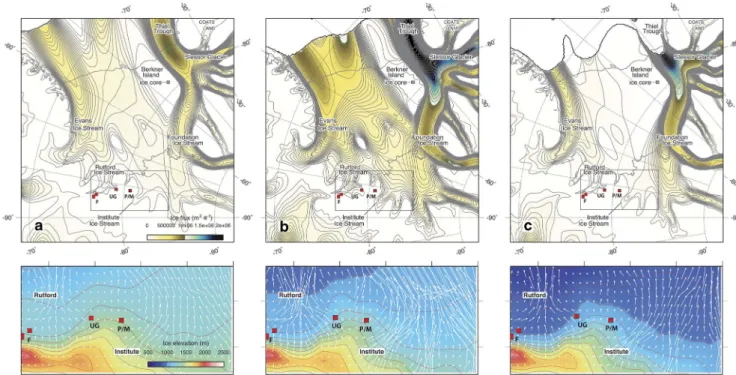
Fig. 2. Simulated regional iceflux (upper panels), together with ice flow direction (white arrows) and ice sheet surface elevation of the Rutford and Institute ice streams (lower panel). a. Post-LGM conditions. b. Initial response to imposed ocean forcing leads to widespread acceleration of iceflow at principal outlets at c. 15 000 model years. c. Continued ice recession then leading to capture of the Institute Ice Stream by the Thiel Trough outlet during the late to mid Holocene. Iceflow vectors in the area of interest
illustrate the change inflow direction taking place between time slices and red squares show the sample locations. F = Flower
Hills, UG = Union Glacier, P/M = Patriot and Marble hills.
676 C.J. FOGWILLet al.
https:/www.cambridge.org/core/terms. https://doi.org/10.1017/S0954102014000613
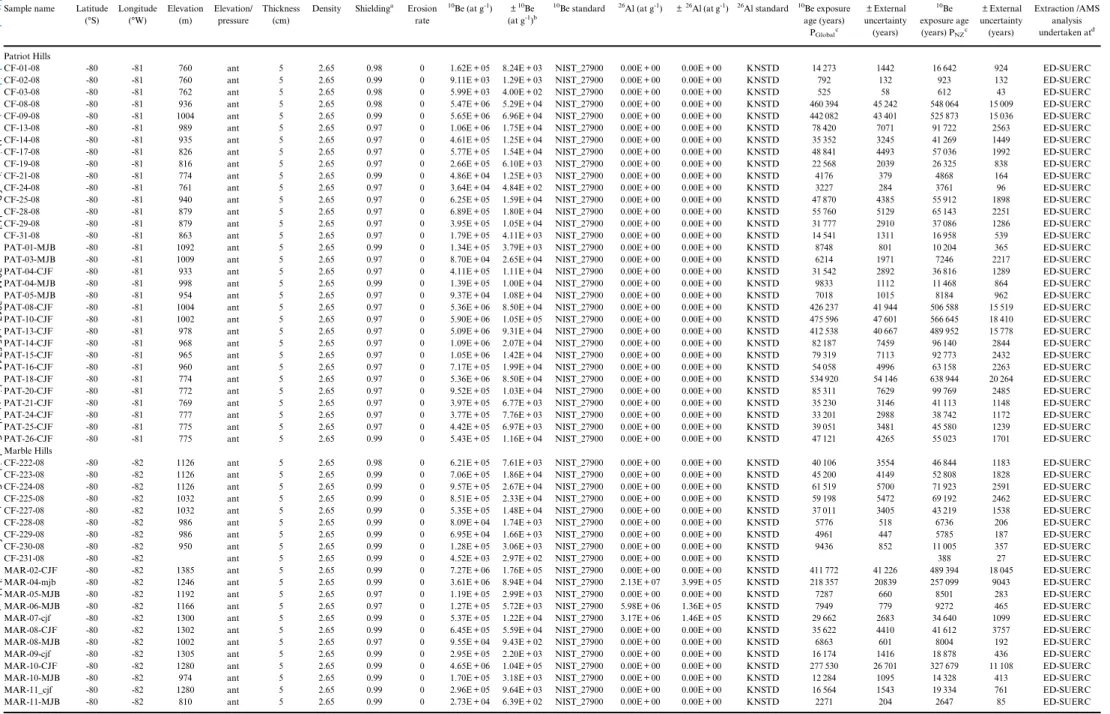
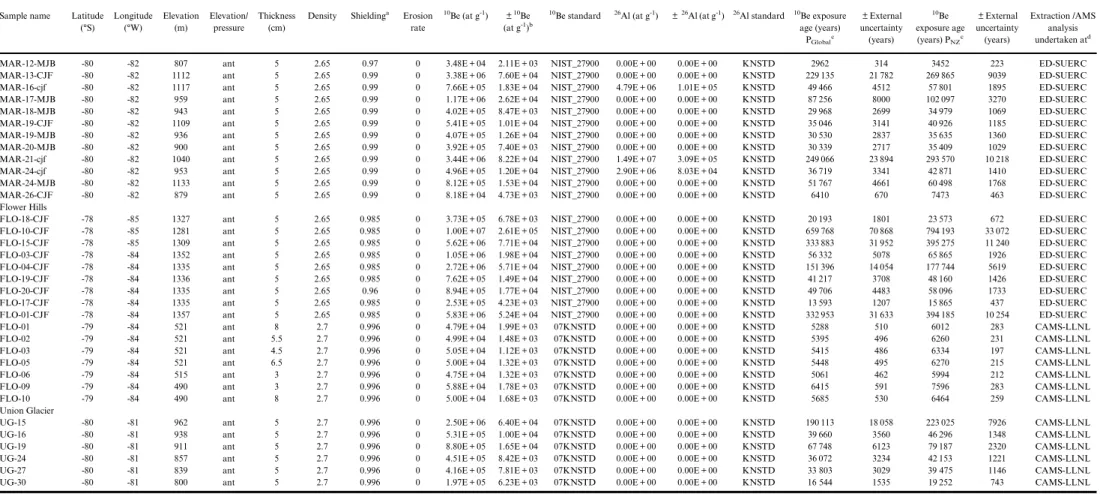
Table I.10Be cosmogenic isotope data from the Patriot and Marble hills recording changes in the Institute Ice Stream, and data from the Flower Hills and Union Glacier recording changes in the Rutford Ice Stream (Fogwill et al. 2012).
Sample name Latitude (°S) Longitude (°W) Elevation (m) Elevation/ pressure Thickness (cm)
Density Shieldinga Erosion
rate
10Be (at g-1) ±10Be
(at g-1)b
10Be standard 26Al (at g-1) ±26Al (at g-1) 26Al standard 10Be exposure
age (years) PGlobalc ± External uncertainty (years) 10Be exposure age (years) PNZc ± External uncertainty (years) Extraction /AMS analysis undertaken atd Patriot Hills
CF-01-08 -80 -81 760 ant 5 2.65 0.98 0 1.62E + 05 8.24E + 03 NIST_27900 0.00E + 00 0.00E + 00 KNSTD 14 273 1442 16 642 924 ED-SUERC CF-02-08 -80 -81 760 ant 5 2.65 0.99 0 9.11E + 03 1.29E + 03 NIST_27900 0.00E + 00 0.00E + 00 KNSTD 792 132 923 132 ED-SUERC CF-03-08 -80 -81 762 ant 5 2.65 0.98 0 5.99E + 03 4.00E + 02 NIST_27900 0.00E + 00 0.00E + 00 KNSTD 525 58 612 43 ED-SUERC CF-08-08 -80 -81 936 ant 5 2.65 0.98 0 5.47E + 06 5.29E + 04 NIST_27900 0.00E + 00 0.00E + 00 KNSTD 460 394 45 242 548 064 15 009 ED-SUERC CF-09-08 -80 -81 1004 ant 5 2.65 0.99 0 5.65E + 06 6.96E + 04 NIST_27900 0.00E + 00 0.00E + 00 KNSTD 442 082 43 401 525 873 15 036 ED-SUERC CF-13-08 -80 -81 989 ant 5 2.65 0.97 0 1.06E + 06 1.75E + 04 NIST_27900 0.00E + 00 0.00E + 00 KNSTD 78 420 7071 91 722 2563 ED-SUERC CF-14-08 -80 -81 935 ant 5 2.65 0.97 0 4.61E + 05 1.25E + 04 NIST_27900 0.00E + 00 0.00E + 00 KNSTD 35 352 3245 41 269 1449 ED-SUERC CF-17-08 -80 -81 826 ant 5 2.65 0.97 0 5.77E + 05 1.54E + 04 NIST_27900 0.00E + 00 0.00E + 00 KNSTD 48 841 4493 57 036 1992 ED-SUERC CF-19-08 -80 -81 816 ant 5 2.65 0.97 0 2.66E + 05 6.10E + 03 NIST_27900 0.00E + 00 0.00E + 00 KNSTD 22 568 2039 26 325 838 ED-SUERC CF-21-08 -80 -81 774 ant 5 2.65 0.99 0 4.86E + 04 1.25E + 03 NIST_27900 0.00E + 00 0.00E + 00 KNSTD 4176 379 4868 164 ED-SUERC CF-24-08 -80 -81 761 ant 5 2.65 0.97 0 3.64E + 04 4.84E + 02 NIST_27900 0.00E + 00 0.00E + 00 KNSTD 3227 284 3761 96 ED-SUERC CF-25-08 -80 -81 940 ant 5 2.65 0.97 0 6.25E + 05 1.59E + 04 NIST_27900 0.00E + 00 0.00E + 00 KNSTD 47 870 4385 55 912 1898 ED-SUERC CF-28-08 -80 -81 879 ant 5 2.65 0.97 0 6.89E + 05 1.80E + 04 NIST_27900 0.00E + 00 0.00E + 00 KNSTD 55 760 5129 65 143 2251 ED-SUERC CF-29-08 -80 -81 879 ant 5 2.65 0.97 0 3.95E + 05 1.05E + 04 NIST_27900 0.00E + 00 0.00E + 00 KNSTD 31 777 2910 37 086 1286 ED-SUERC CF-31-08 -80 -81 863 ant 5 2.65 0.97 0 1.79E + 05 4.11E + 03 NIST_27900 0.00E + 00 0.00E + 00 KNSTD 14 541 1311 16 958 539 ED-SUERC PAT-01-MJB -80 -81 1092 ant 5 2.65 0.99 0 1.34E + 05 3.79E + 03 NIST_27900 0.00E + 00 0.00E + 00 KNSTD 8748 801 10 204 365 ED-SUERC PAT-03-MJB -80 -81 1009 ant 5 2.65 0.97 0 8.70E + 04 2.65E + 04 NIST_27900 0.00E + 00 0.00E + 00 KNSTD 6214 1971 7246 2217 ED-SUERC PAT-04-CJF -80 -81 933 ant 5 2.65 0.97 0 4.11E + 05 1.11E + 04 NIST_27900 0.00E + 00 0.00E + 00 KNSTD 31 542 2892 36 816 1289 ED-SUERC PAT-04-MJB -80 -81 998 ant 5 2.65 0.99 0 1.39E + 05 1.00E + 04 NIST_27900 0.00E + 00 0.00E + 00 KNSTD 9833 1112 11 468 864 ED-SUERC PAT-05-MJB -80 -81 954 ant 5 2.65 0.97 0 9.37E + 04 1.08E + 04 NIST_27900 0.00E + 00 0.00E + 00 KNSTD 7018 1015 8184 962 ED-SUERC PAT-08-CJF -80 -81 1004 ant 5 2.65 0.97 0 5.36E + 06 8.50E + 04 NIST_27900 0.00E + 00 0.00E + 00 KNSTD 426 237 41 944 506 588 15 519 ED-SUERC PAT-10-CJF -80 -81 1002 ant 5 2.65 0.97 0 5.90E + 06 1.05E + 05 NIST_27900 0.00E + 00 0.00E + 00 KNSTD 475 596 47 601 566 645 18 410 ED-SUERC PAT-13-CJF -80 -81 978 ant 5 2.65 0.97 0 5.09E + 06 9.31E + 04 NIST_27900 0.00E + 00 0.00E + 00 KNSTD 412 538 40 667 489 952 15 778 ED-SUERC PAT-14-CJF -80 -81 968 ant 5 2.65 0.97 0 1.09E + 06 2.07E + 04 NIST_27900 0.00E + 00 0.00E + 00 KNSTD 82 187 7459 96 140 2844 ED-SUERC PAT-15-CJF -80 -81 965 ant 5 2.65 0.97 0 1.05E + 06 1.42E + 04 NIST_27900 0.00E + 00 0.00E + 00 KNSTD 79 319 7113 92 773 2432 ED-SUERC PAT-16-CJF -80 -81 960 ant 5 2.65 0.97 0 7.17E + 05 1.99E + 04 NIST_27900 0.00E + 00 0.00E + 00 KNSTD 54 058 4996 63 158 2263 ED-SUERC PAT-18-CJF -80 -81 774 ant 5 2.65 0.97 0 5.36E + 06 8.50E + 04 NIST_27900 0.00E + 00 0.00E + 00 KNSTD 534 920 54 146 638 944 20 264 ED-SUERC PAT-20-CJF -80 -81 772 ant 5 2.65 0.97 0 9.52E + 05 1.03E + 04 NIST_27900 0.00E + 00 0.00E + 00 KNSTD 85 311 7629 99 769 2485 ED-SUERC PAT-21-CJF -80 -81 769 ant 5 2.65 0.97 0 3.97E + 05 6.77E + 03 NIST_27900 0.00E + 00 0.00E + 00 KNSTD 35 230 3146 41 113 1148 ED-SUERC PAT-24-CJF -80 -81 777 ant 5 2.65 0.97 0 3.77E + 05 7.76E + 03 NIST_27900 0.00E + 00 0.00E + 00 KNSTD 33 201 2988 38 742 1172 ED-SUERC PAT-25-CJF -80 -81 775 ant 5 2.65 0.97 0 4.42E + 05 6.97E + 03 NIST_27900 0.00E + 00 0.00E + 00 KNSTD 39 051 3481 45 580 1239 ED-SUERC PAT-26-CJF -80 -81 775 ant 5 2.65 0.99 0 5.43E + 05 1.16E + 04 NIST_27900 0.00E + 00 0.00E + 00 KNSTD 47 121 4265 55 023 1701 ED-SUERC Marble Hills
CF-222-08 -80 -82 1126 ant 5 2.65 0.98 0 6.21E + 05 7.61E + 03 NIST_27900 0.00E + 00 0.00E + 00 KNSTD 40 106 3554 46 844 1183 ED-SUERC CF-223-08 -80 -82 1126 ant 5 2.65 0.99 0 7.06E + 05 1.86E + 04 NIST_27900 0.00E + 00 0.00E + 00 KNSTD 45 200 4149 52 808 1828 ED-SUERC CF-224-08 -80 -82 1126 ant 5 2.65 0.99 0 9.57E + 05 2.67E + 04 NIST_27900 0.00E + 00 0.00E + 00 KNSTD 61 519 5700 71 923 2591 ED-SUERC CF-225-08 -80 -82 1032 ant 5 2.65 0.99 0 8.51E + 05 2.33E + 04 NIST_27900 0.00E + 00 0.00E + 00 KNSTD 59 198 5472 69 192 2462 ED-SUERC CF-227-08 -80 -82 1032 ant 5 2.65 0.99 0 5.35E + 05 1.48E + 04 NIST_27900 0.00E + 00 0.00E + 00 KNSTD 37 011 3405 43 219 1538 ED-SUERC CF-228-08 -80 -82 986 ant 5 2.65 0.99 0 8.09E + 04 1.74E + 03 NIST_27900 0.00E + 00 0.00E + 00 KNSTD 5776 518 6736 206 ED-SUERC CF-229-08 -80 -82 986 ant 5 2.65 0.99 0 6.95E + 04 1.66E + 03 NIST_27900 0.00E + 00 0.00E + 00 KNSTD 4961 447 5785 187 ED-SUERC CF-230-08 -80 -82 950 ant 5 2.65 0.99 0 1.28E + 05 3.06E + 03 NIST_27900 0.00E + 00 0.00E + 00 KNSTD 9436 852 11 005 357 ED-SUERC CF-231-08 -80 -82 ant 5 2.65 0.99 0 4.52E + 03 2.97E + 02 NIST_27900 0.00E + 00 0.00E + 00 KNSTD 388 27 ED-SUERC MAR-02-CJF -80 -82 1385 ant 5 2.65 0.99 0 7.27E + 06 1.76E + 05 NIST_27900 0.00E + 00 0.00E + 00 KNSTD 411 772 41 226 489 394 18 045 ED-SUERC MAR-04-mjb -80 -82 1246 ant 5 2.65 0.99 0 3.61E + 06 8.94E + 04 NIST_27900 2.13E + 07 3.99E + 05 KNSTD 218 357 20839 257 099 9043 ED-SUERC MAR-05-MJB -80 -82 1192 ant 5 2.65 0.97 0 1.19E + 05 2.99E + 03 NIST_27900 0.00E + 00 0.00E + 00 KNSTD 7287 660 8501 283 ED-SUERC MAR-06-MJB -80 -82 1166 ant 5 2.65 0.97 0 1.27E + 05 5.72E + 03 NIST_27900 5.98E + 06 1.36E + 05 KNSTD 7949 779 9272 465 ED-SUERC MAR-07-cjf -80 -82 1300 ant 5 2.65 0.99 0 5.37E + 05 1.22E + 04 NIST_27900 3.17E + 06 1.46E + 05 KNSTD 29 662 2683 34 640 1099 ED-SUERC MAR-08-CJF -80 -82 1302 ant 5 2.65 0.99 0 6.45E + 05 5.59E + 04 NIST_27900 0.00E + 00 0.00E + 00 KNSTD 35 622 4410 41 612 3757 ED-SUERC MAR-08-MJB -80 -82 1002 ant 5 2.65 0.97 0 9.55E + 04 9.43E + 02 NIST_27900 0.00E + 00 0.00E + 00 KNSTD 6863 601 8004 192 ED-SUERC MAR-09-cjf -80 -82 1305 ant 5 2.65 0.99 0 2.95E + 05 2.20E + 03 NIST_27900 0.00E + 00 0.00E + 00 KNSTD 16 174 1416 18 878 436 ED-SUERC MAR-10-CJF -80 -82 1280 ant 5 2.65 0.99 0 4.65E + 06 1.04E + 05 NIST_27900 0.00E + 00 0.00E + 00 KNSTD 277 530 26 701 327 679 11 108 ED-SUERC MAR-10-MJB -80 -82 974 ant 5 2.65 0.99 0 1.70E + 05 3.18E + 03 NIST_27900 0.00E + 00 0.00E + 00 KNSTD 12 284 1095 14 328 413 ED-SUERC MAR-11_cjf -80 -82 1280 ant 5 2.65 0.99 0 2.96E + 05 9.64E + 03 NIST_27900 0.00E + 00 0.00E + 00 KNSTD 16 564 1543 19 334 761 ED-SUERC MAR-11-MJB -80 -82 810 ant 5 2.65 0.99 0 2.73E + 04 6.39E + 02 NIST_27900 0.00E + 00 0.00E + 00 KNSTD 2271 204 2647 85 ED-SUERC
https:/www.cambridge.org/core/terms
.
https://doi.org/10.1017/S0954102014000613
Downloaded from
https:/www.cambridge.org/core
. University of Basel Library
, on
30 May 2017 at 15:57:14
Table I: Continued
Sample name Latitude (°S) Longitude (°W) Elevation (m) Elevation/ pressure Thickness (cm)
Density Shieldinga Erosion
rate
10Be (at g-1) ±10Be
(at g-1)b
10Be standard 26Al (at g-1) ±26Al (at g-1) 26Al standard 10Be exposure
age (years) PGlobalc ± External uncertainty (years) 10Be exposure age (years) PNZc ± External uncertainty (years) Extraction /AMS analysis undertaken atd
MAR-12-MJB -80 -82 807 ant 5 2.65 0.97 0 3.48E + 04 2.11E + 03 NIST_27900 0.00E + 00 0.00E + 00 KNSTD 2962 314 3452 223 ED-SUERC MAR-13-CJF -80 -82 1112 ant 5 2.65 0.99 0 3.38E + 06 7.60E + 04 NIST_27900 0.00E + 00 0.00E + 00 KNSTD 229 135 21 782 269 865 9039 ED-SUERC MAR-16-cjf -80 -82 1117 ant 5 2.65 0.99 0 7.66E + 05 1.83E + 04 NIST_27900 4.79E + 06 1.01E + 05 KNSTD 49 466 4512 57 801 1895 ED-SUERC MAR-17-MJB -80 -82 959 ant 5 2.65 0.99 0 1.17E + 06 2.62E + 04 NIST_27900 0.00E + 00 0.00E + 00 KNSTD 87 256 8000 102 097 3270 ED-SUERC MAR-18-MJB -80 -82 943 ant 5 2.65 0.99 0 4.02E + 05 8.47E + 03 NIST_27900 0.00E + 00 0.00E + 00 KNSTD 29 968 2699 34 979 1069 ED-SUERC MAR-19-CJF -80 -82 1109 ant 5 2.65 0.99 0 5.41E + 05 1.01E + 04 NIST_27900 0.00E + 00 0.00E + 00 KNSTD 35 046 3141 40 926 1185 ED-SUERC MAR-19-MJB -80 -82 936 ant 5 2.65 0.99 0 4.07E + 05 1.26E + 04 NIST_27900 0.00E + 00 0.00E + 00 KNSTD 30 530 2837 35 635 1360 ED-SUERC MAR-20-MJB -80 -82 900 ant 5 2.65 0.99 0 3.92E + 05 7.40E + 03 NIST_27900 0.00E + 00 0.00E + 00 KNSTD 30 339 2717 35 409 1029 ED-SUERC MAR-21-cjf -80 -82 1040 ant 5 2.65 0.99 0 3.44E + 06 8.22E + 04 NIST_27900 1.49E + 07 3.09E + 05 KNSTD 249 066 23 894 293 570 10 218 ED-SUERC MAR-24-cjf -80 -82 953 ant 5 2.65 0.99 0 4.96E + 05 1.20E + 04 NIST_27900 2.90E + 06 8.03E + 04 KNSTD 36 719 3341 42 871 1410 ED-SUERC MAR-24-MJB -80 -82 1133 ant 5 2.65 0.99 0 8.12E + 05 1.53E + 04 NIST_27900 0.00E + 00 0.00E + 00 KNSTD 51 767 4661 60 498 1768 ED-SUERC MAR-26-CJF -80 -82 879 ant 5 2.65 0.99 0 8.18E + 04 4.73E + 03 NIST_27900 0.00E + 00 0.00E + 00 KNSTD 6410 670 7473 463 ED-SUERC Flower Hills
FLO-18-CJF -78 -85 1327 ant 5 2.65 0.985 0 3.73E + 05 6.78E + 03 NIST_27900 0.00E + 00 0.00E + 00 KNSTD 20 193 1801 23 573 672 ED-SUERC FLO-10-CJF -78 -85 1281 ant 5 2.65 0.985 0 1.00E + 07 2.61E + 05 NIST_27900 0.00E + 00 0.00E + 00 KNSTD 659 768 70 868 794 193 33 072 ED-SUERC FLO-15-CJF -78 -85 1309 ant 5 2.65 0.985 0 5.62E + 06 7.71E + 04 NIST_27900 0.00E + 00 0.00E + 00 KNSTD 333 883 31 952 395 275 11 240 ED-SUERC FLO-03-CJF -78 -84 1352 ant 5 2.65 0.985 0 1.05E + 06 1.98E + 04 NIST_27900 0.00E + 00 0.00E + 00 KNSTD 56 332 5078 65 865 1926 ED-SUERC FLO-04-CJF -78 -84 1335 ant 5 2.65 0.985 0 2.72E + 06 5.71E + 04 NIST_27900 0.00E + 00 0.00E + 00 KNSTD 151 396 14 054 177 744 5619 ED-SUERC FLO-19-CJF -78 -84 1336 ant 5 2.65 0.985 0 7.62E + 05 1.49E + 04 NIST_27900 0.00E + 00 0.00E + 00 KNSTD 41 217 3708 48 160 1426 ED-SUERC FLO-20-CJF -78 -84 1335 ant 5 2.65 0.96 0 8.94E + 05 1.77E + 04 NIST_27900 0.00E + 00 0.00E + 00 KNSTD 49 706 4483 58 096 1733 ED-SUERC FLO-17-CJF -78 -84 1335 ant 5 2.65 0.985 0 2.53E + 05 4.23E + 03 NIST_27900 0.00E + 00 0.00E + 00 KNSTD 13 593 1207 15 865 437 ED-SUERC FLO-01-CJF -78 -84 1357 ant 5 2.65 0.985 0 5.83E + 06 5.24E + 04 NIST_27900 0.00E + 00 0.00E + 00 KNSTD 332 953 31 633 394 185 10 254 ED-SUERC FLO-01 -79 -84 521 ant 8 2.7 0.996 0 4.79E + 04 1.99E + 03 07KNSTD 0.00E + 00 0.00E + 00 KNSTD 5288 510 6012 283 CAMS-LLNL FLO-02 -79 -84 521 ant 5.5 2.7 0.996 0 4.99E + 04 1.48E + 03 07KNSTD 0.00E + 00 0.00E + 00 KNSTD 5395 496 6260 231 CAMS-LLNL FLO-03 -79 -84 521 ant 4.5 2.7 0.996 0 5.05E + 04 1.12E + 03 07KNSTD 0.00E + 00 0.00E + 00 KNSTD 5415 486 6334 197 CAMS-LLNL FLO-05 -79 -84 521 ant 6.5 2.7 0.996 0 5.00E + 04 1.32E + 03 07KNSTD 0.00E + 00 0.00E + 00 KNSTD 5448 495 6270 215 CAMS-LLNL FLO-06 -79 -84 515 ant 3 2.7 0.996 0 4.75E + 04 1.32E + 03 07KNSTD 0.00E + 00 0.00E + 00 KNSTD 5061 462 5994 212 CAMS-LLNL FLO-09 -79 -84 490 ant 3 2.7 0.996 0 5.88E + 04 1.78E + 03 07KNSTD 0.00E + 00 0.00E + 00 KNSTD 6415 591 7596 283 CAMS-LLNL FLO-10 -79 -84 490 ant 8 2.7 0.996 0 5.00E + 04 1.68E + 03 07KNSTD 0.00E + 00 0.00E + 00 KNSTD 5685 530 6464 259 CAMS-LLNL Union Glacier
UG-15 -80 -81 962 ant 5 2.7 0.996 0 2.50E + 06 6.40E + 04 07KNSTD 0.00E + 00 0.00E + 00 KNSTD 190 113 18 058 223 025 7926 CAMS-LLNL UG-16 -80 -81 938 ant 5 2.7 0.996 0 5.31E + 05 1.00E + 04 07KNSTD 0.00E + 00 0.00E + 00 KNSTD 39 660 3560 46 296 1348 CAMS-LLNL UG-19 -80 -81 911 ant 5 2.7 0.996 0 8.80E + 05 1.65E + 04 07KNSTD 0.00E + 00 0.00E + 00 KNSTD 67 748 6123 79 187 2320 CAMS-LLNL UG-24 -80 -81 857 ant 5 2.7 0.996 0 4.51E + 05 8.42E + 03 07KNSTD 0.00E + 00 0.00E + 00 KNSTD 36 072 3234 42 153 1221 CAMS-LLNL UG-27 -80 -81 839 ant 5 2.7 0.996 0 4.16E + 05 7.81E + 03 07KNSTD 0.00E + 00 0.00E + 00 KNSTD 33 803 3029 39 475 1146 CAMS-LLNL UG-30 -80 -81 800 ant 5 2.7 0.996 0 1.97E + 05 6.23E + 03 07KNSTD 0.00E + 00 0.00E + 00 KNSTD 16 544 1535 19 252 743 CAMS-LLNL
aRatio of the production rate at the shielded site to that for a 2π surface at the same location calculated using the CRONUS-Earth geometric shielding calculator version 1.1.
bCalculated using 07KNSTD10Be measurement standard and calibration with a reported10Be/9Be ratio 2.85 x 10-1240or to the NIST standard with an assumed isotope ratio of 2.79 x 10⁻¹¹and10Be half-life 1.36 Ma (Chmeleff et al. 2010, Korschinek et al. 2010).
cModel exposure age assuming no inheritance, zero erosion, density 2.65–2.7 g cm-3and standard atmosphere calculated using the CRONUS-Earth10Be-26Al exposure age calculator (Balco et al. 2008) version 2.2 using a constant production rate model and scaling scheme for spallation of Lal (1991)/Stone (2000). Ages based upon global production rate (Pglobal) and New Zealand production rate (PNZ) accordingly.
d
Ed= University of Edinburgh, SUERC = Scottish Universities Environmental Research Centre, CAMS-LLNL = Centre for Accelerator Mass Spectrometry-Lawrence Livermore National Laboratory.
https:/www.cambridge.org/core/terms
.
https://doi.org/10.1017/S0954102014000613
Downloaded from
https:/www.cambridge.org/core
. University of Basel Library
, on
30 May 2017 at 15:57:14
Hillenbrand et al. 2014). Whilst the existing marine chronology is open to interpretation, including possible reworking and the potentially significant changes in Antarctic marine radiocarbon reservoir effect over time (Hillenbrand et al. 2014), the ages are internally coherent, suggesting that they provide reliable constraints on the gradual retreat of the grounding line across the Weddell Sea. An important constraint from the outer continental shelf records grounding line retreat, and suggests open water conditions were established by c. 18.1 ka (Hillenbrand et al. 2014). Two further reliable critical constraints exist close to the sills of the extensive Thiel and Rutford cross-shelf troughs in the Weddell Sea. These record retreat in the eastern Weddell Sea at the head of the Thiel Trough before c. 8.3 ka, and at the head of the Rutford Trough in the western Weddell Sea at c. 5.3 ka (Fig. 1) (Hillenbrand et al. 2014).
Terrestrial geochronological constraints
Although the available marine radiocarbon data is sparse, a more comprehensive terrestrial record of ice stream surface changes is recorded on exposed mountains in the catchments of the Rutford and Institute ice streams. This study combines new10Be and in situ 14C data that record changes of the Rutford Ice Stream with published in situ10Be and26Al cosmogenic isotope data from the catchment of the Institute Ice Stream (Bentley et al. 2010, Fogwill et al. 2012). Terrestrial ice surface elevations through time are constructed by measuring cosmogenic nuclides in erratics glacially transported from sites located in the catchments of the Rutford Ice Stream and Institute
Ice Stream, as suggested by our LGM ice sheet flow
model (Fig. 2). Glacial erratics sampled from steep exposed bedrock surfaces, in the Flower Hills, Union Glacier, and the Patriot and Marble hills (Bentley et al. 2010, Fogwill et al. 2012) (Fig. 1), serve as‘dipsticks’ that allow us to reconstruct past surface elevation changes in the catchments of the ice streams since the LGM.
Samples were reduced to pure quartz at the University of Edinburgh cosmogenic nuclide laboratory and Lawrence Livermore National Laboratories Center for Accelerator Mass Spectrometry (LLNL-CAMS) following standard procedures (Kohl & Nishiizumi 1992, Ivy-Ochs 1996, Stone 2004). The10Be ratios were measured by the AMS facility at LLNL and the Scottish Universities Environmental Research Centre (SUERC) (Xu et al. 2010). Measurements were standardized to the NIST SRM-4325 Be standard material with a revised nominal10Be/9Be ratio of 2.79 x 10⁻¹¹ (Nishiizumi et al. 2007). Samples were corrected for the number of10Be atoms in their associated blanks. Blanks
were spiked with 250μg 9Be carrier (Edinburgh) and
474μg9Be (LLNL-CAMS). The corresponding combined
process and carrier blanks10Be/9Be ratios range between 1.6–5.47 x 10⁻¹⁵. Sample and blank 10Be/9Be analytical
uncertainties and a 2.5% carrier addition uncertainty are propagated into the 1σ analytical uncertainty for nuclide concentrations.
A version of the CRONUS-Earth online age calculator was used to determine the10Be exposure ages (Balco et al.
2008), implementing the New Zealand 10Be production
rate calibration dataset (Putnam et al. 2010), that uses the recently revised10Be half-life (1.387 Ma) (Chmeleff et al. 2010, Korschinek et al. 2010), and Be isotope ratio standardization of Nishiizumi (Nishiizumi et al. 2007). The use of this revised production rate and half-life change impact the apparent exposure ages, causing them to increase by c. 12% from those previously published (Bentley et al. 2010, Fogwill et al. 2012) (Table I). Choice of production rate model and scaling is often a pragmatic one and is an ongoing subject of debate. Here the New Zealand calibration dataset was used to allow comparison with other recent Antarctic studies and in the absence of an Antarctic production rate calibration site. Exposure ages are reported based on the Lal/Stone scaling model for Antarctica; using the same calibration dataset, ages differ by 2–4% depending on the choice of scaling model (Balco et al. 2008). The calculator uses sample thickness and density to standardize nuclide concentrations to the rock surface. The whole rock density is assumed to be 2.65–2.7 g cm-3. No correction for periodic snow cover or for rock-surface erosion was included, as both of which are assumed to be negligible in these sites. An erosion rate of 0.0002 cm yr-1 increases ages by c. 2%.
Uniquely, this study also takes advantage of recent
technological developments in the extraction and
measurement of in situ radiocarbon (14C) from quartz (Hippe et al. 2009, 2013), a cosmogenic nuclide with a
considerably shorter half-life than that of 10Be
(10Be = 1.36 x 10³kyr,14C= 5.73 kyr). As the relatively short half-life of 14C means that in situ14C acquired on exposure during interglacials decays if the sample is covered by ice during a subsequent glacial, the apparent
14
C age reflects the true minimum exposure age of the sample. Crucially, the disparity between the10Be and14C data allows the potential influence of prior exposure or recycling in this setting to be assessed (Lifton et al. 2001, White et al. 2011).
In situ 14C extraction was performed at ETH Zürich following a modified protocol (Hippe et al. 2009, 2013). Quartz aliquots of c. 5 g were preheated at c. 700°C to remove atmospheric 14C contamination followed by the extraction of in situ14C during heating to 1550–1600°C for 2 × 2 hours. The collected CO2 gas was split into
two samples before AMS measurement due to large gas amounts. Samples were then measured with the MICADAS AMS system using the gas ion source (Ruff et al. 2007, Synal et al. 2007, Wacker et al. 2010).
The number of 14C atoms obtained for both splits
DRIVERS OF ABRUPT HOLOCENE SHIFTS IN WEST ANTARCTICA 679
https:/www.cambridge.org/core/terms. https://doi.org/10.1017/S0954102014000613
were summed prior to subtraction of the long-term average processing blank of (3.15 ± 1.19) × 104 14C atoms (± 1 standard deviation, n= 24).
14
C/10Be multi-isotope analysis
For this study, in situ14C exposure ages were calculated with a sea level, high latitude (SLHL) spallogenic production rate of 11.40 ± 0.9 at g-1y-1(Schimmelpfennig et al. 2014). As with10Be, the production rate was scaled to altitude and latitude according to the scaling scheme of Lal/Stone. The contribution due to muon production was calculated using the freely accessible MATLAB code of the CRONUS-Earth online calculator (http.//hess.ess. washington.edu/math/al _be_v2/P_mu_total) (Balco et al. 2008). In order to allow muon scaling for in situ 14C, parameters were adjusted based on the cross sections for
14
C (Heisinger et al. 2002a, 2002b), and corrections for sample thickness and topographical shielding were applied on spallogenic production only.
Combined 14C and10Be analysis is applied to sites in the Flower Hills and Union Glacier (in the catchment of the Rutford Ice Stream) which display a high percentage
of anomalously ‘old’ apparent 10Be exposure ages
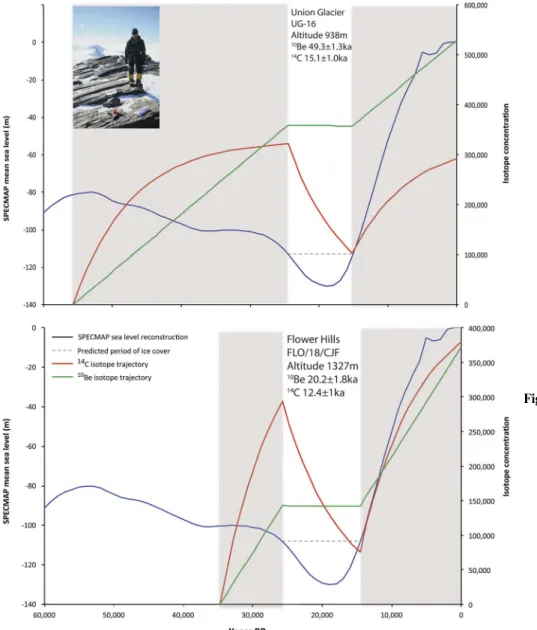
(Table I). The disparity between the in situ14C and10Be data demonstrates that the samples have experienced a complicated exposure history, suggesting either that the cosmogenic nuclide inventories of the erratics were not fully reset by glacial erosion prior to deposition, or that following initial deposition they underwent periods of exposure at different altitudes and/or cover by cold-based ice (White et al. 2011). Using the measured concentrations of both10Be and14C, an iterative model was constructed to calculate the maximum and minimum periods of ice cover each sample could have undergone to explain the differing nuclide concentrations. These periods were then compared with the equivalent periods of ice cover implied by the eustatic sea level data, following a similar approach to studies of the Fennoscandian Ice Sheet (Fabel et al. 2002).
Whilst only a one-way test, this assumes that the erratics experienced periods of ice cover subsequent to initial deposition at any point when sea level was lower (and ice volume greater) than it was at the point of re-exposure given by the14C apparent exposure age (Table II). Using
the measured, minimum and maximum14C exposure ages
of each sample (given by the external errors within the process, to allow for comparability with the independently dated sea level curve), three scenarios for each sample were created, under which all samples apart from UG-27 are shown to have experienced one period of extended ice cover following initial deposition, followed by subsequent re-exposure (Fig. 3). Sample UG-27 has a complex nuclide inventory, possibly reconcilable by either a single or multiple pre-exposure event at a higher altitude than
Ta ble II. 14 C cosm ogen ic isot ope data from the Flower Hills and Union Gla cier. Sample n ame AMS ID Sample mass (g qtz) CO 2 yield (μ g) Fraction modern F 14C a ±F 14C δ 13C( ‰ )( 14C/ 12C) abs (10 -12 ) b ±( 14 C/ 12 C) abs (10 -12 ) 14C (at g -1) c ± 14C (at g -1) M uon production rate (at g -1 yr -1) Production rate (spallation a t g -1 yr -1) d 14C E xposure age (years) e ± External uncertainty (years) FLO-18-CJFa 47425.1.1 19.8 0.835 0.010 -22.45 0.990 0.012 FLO-18-CJFb 47425.1.2 19.6 0.854 0.010 -18.63 1.021 0.011 Total 5.28 3.66E + 0 5 3 .92E + 03 7.25 4 9.93 1 4 5 61 744 FLO-19-CJFa 47424.1.1 17.7 0.958 0.011 -25.37 1.129 0.013 FLO-19-CJFb 47424.1.2 17.9 0.972 0.012 -18.62 1.162 0.014 Total 4.98 4.00E + 0 5 4 .34E + 03 7.28 5 0.30 1 8 7 74 961 UG16-2 47426.1.1 9.5 0.553 0.012 -28.84 0.647 0.014 Total 0.99 2.76E + 0 5 1 .41E + 04 6.20 4 2.48 1 5 1 01 1077 UG27a 47422.1.1 23.9 0.351 0.005 -21.61 0.416 0.006 UG27b 47422.1.2 23.9 0.360 0.006 -20.08 0.429 0.007 Total 5.11583 1.90E + 0 5 3 .26E +03 5.95 3 9.19 8 081 4 27 aNor malized to δ 13 C o f -25 ‰VPDB and AD 1950 . bCalculated aft er eq. (1) in Hippe et al . 2009 . cBla nk correc ted; calcu lated after eq. (2) in Hippe et al . 2009 . dCorre cted for sa mple thic kness and topogra phical shielding; see Table I for correc tion factors . eExp osure age assuming no inheritance, zero erosi on, density 2.7 g cm -3, w ith a cons tant pro duction ra te and scalin g sc heme for spallation of La l (1991)/Stone (200 0). 680 C.J. FOGWILLet al. https:/www.cambridge.org/core/terms. https://doi.org/10.1017/S0954102014000613
present. For the remaining samples, a scenario is identified that agrees with the periods of ice cover stipulated by the cosmogenic nuclide data and the sea level reconstruction: a single extended period of ice cover following initial deposition, and subsequent re-exposure during the last deglaciation (Fig. 3). This suggests that the disparity between the 14C/10Be is probably a result of cover by cold-based ice, and demonstrates that the use of another isotope paired alongside14C can provide insights into the depositional history of the samples, allowing for a more confident interpretation of the surface trajectory of the Rutford Ice Stream.
Results
To examine the dynamic glaciological changes recorded from our geological reconstruction,firstly the changes to
geometry and ice flow pattern triggered by post-LGM
increases in oceanic heatflux and sea level were assessed. The patterns of iceflow predicted by the model under this scenario are shown in Fig. 2. The initial response of the LGM ice sheet to ocean and atmospheric forcing is depicted in Fig. 2a, and is marked by almost uniform grounding line retreat across the WSE, coupled with high discharge rates through all of the major cross-shelf troughs. The predicted ice sheet surface remains above 1300 m in the catchments of both ice streams.
Figure 2b shows the rapid increase in predicted iceflux in response to the prescribed ocean forcing, with acceleration offlow at the marine margins and concomitant drawdown of the ice sheet surface in the WSE. Although ice flux is greatest at the head of the deep Thiel Trough and its tributaries, ice from both the Rutford Ice Stream and Institute Ice Stream continue to discharge through the Rutford Trough and the extended Evans Trough on the western side of the WSE. Due to the location of the two ice
Fig. 3. Modelled relationship between
10
Be/14C isotope concentrations, time and sea level used as a proxy for global ice volume (Imbrie & McIntyre 2006) for samples FLO/18/ CJF and UG16. Proposed periods of
sample exposure are defined by the
grey boxes. The altitude and apparent exposure ages based upon the measured10Be and14C inventories of the samples are noted. The inset photo shows sample FLO/18/CJF, a quartzite erratic on striated agrilite bedrock typical of the samples analysed.
DRIVERS OF ABRUPT HOLOCENE SHIFTS IN WEST ANTARCTICA 681
https:/www.cambridge.org/core/terms. https://doi.org/10.1017/S0954102014000613
streams relative to the grounding line, this leads to the start of a marked and rapid drawdown of the Rutford Ice Stream at this time when compared to the Institute, reflected in rapid altitudinal change in the catchment of the Rutford Ice Stream after 15 ka (Fig. 2b).
Under continued oceanic forcing, grounding line retreat in the WSE becomes markedly asymmetric, with faster retreat taking place in the Thiel Trough (eastern WSE) than in the west (Fig. 2c upper panel). Consequently, the inland ice sheet surface gradient switches from its formerly north-easterly direction to a more east-south-easterly direction, with the effect that ice discharging in the Institute and Möller ice streams is diverted towards the Thiel Trough (Fig. 2c lower panel). Thus at this point, drainage of these neighbouring ice streams becomes governed by the locations of two separate grounding lines c. 300 km apart. Their behaviour is thus decoupled from one another, allowing independent thinning trajectories during deglaciation.
Discussion
The geological reconstructions presented here mirror the results of the ice sheet model simulation, and provide a
chronological framework to examine the physical effects of grounding line retreat away from the marine margin. The results demonstrate that the surface of the Rutford Ice Stream and Institute Ice Stream exceeded 1300 m in altitude at the LGM, buttressed by grounded ice in the Weddell Sea (Fig. 4, see Tables I & II for details). Geologically this upper limit of the ice stream surfaces is defined based on the absence of any apparently ‘young’ (post-LGM) exposure ages above this altitude (Bentley et al. 2010, 2011, Clark 2011), and the presence of locally derived LGM-age ice in the Patriot Hills, as demonstrated by recent analysis of the exposed blue ice in the Institute Ice Stream catchment (Turney et al. 2013). Based upon this interpretation it is apparent that the Rutford and Institute ice streams maintained their LGM surface profiles until 16 ka, away from the marine margins of the retreating grounding line despite rising sea level and regional ocean circulation and temperature changes (Fig. 4). This is supported by comparison of the ice stream trajectories with post-LGM eustatic global sea level, which suggest a delayed response of both the Rutford and the Institute ice streams to global sea level rise.
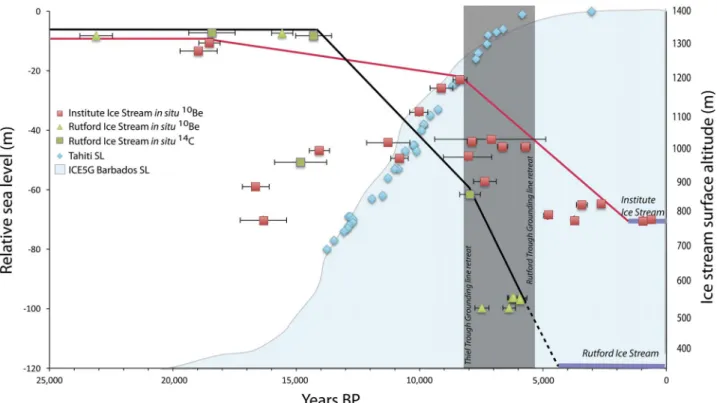
After c. 16 ka the results suggest that the surface trajectories of the two ice streams began to diverge (Fig. 4). Fig. 4. Reconstructed ice stream trajectories over the last 25 000 years from terrestrial cosmogenic nuclides in glacially transported
erratics (in situ14C and10Be ± 1 standard deviation). The profiles of the Rutford and Institute ice streams are shown in green and
red, respectively. The grey column defines the timing of inner continental shelf deglaciation of the Thiel Trough and the Rutford Trough, based upon the available calibrated marine14C constraints (Hillenbrand et al. 2012, 2014), reflecting the proposed period
of ice stream capture of the Institute Ice Stream by the Thiel Trough. For comparison, global relative sea level rise reconstructed from Tahiti (Bard et al. 1996, Bard 2003) and Barbados (Peltier & Fairbanks 2006) are plotted.
682 C.J. FOGWILLet al.
https:/www.cambridge.org/core/terms. https://doi.org/10.1017/S0954102014000613
Initially the Institute Ice Stream thinned slowly, dropping in elevation by only 100 m between c. 20 and c. 8.5 ka. Subsequently the rate of decay increased markedly after c. 8.5 ka, thinning 380 m in c. 6000 years, to reach the present ice sheet surface elevation by c. 2 ka, supporting interpretations of the regional isostatic response derived from GPS constraints (Argus et al. 2011).
The Institute Ice Stream’s surface trajectory contrasts with that of the Rutford Ice Stream, which maintained an altitude of over 1300 m until decay was initiated at c. 14.5 ka (Fig. 4). At this time, the Rutford apparently decayed rapidly, thinning by c. 900 m between c. 14.5 ka and c. 6 ka. Although the trajectory of the Rutford Ice Stream after c. 6 ka between the lower sample sites (520–490 m) and the present ice stream surface altitude cannot be fully defined, a lack of geomorphological evidence on the steep slopes between these altitudes suggests that the downward thinning trajectory of the Rutford Ice Stream continued in response to grounding line retreat across the inner shelf of the western Weddell Sea at c. 5.3 ka (Fig. 1) (Hillenbrand et al. 2012).
Whilst the terrestrial geological reconstruction presented here is unable to rule out if this thinning of either the Rutford or Institute ice streams continued below present levels into the late Holocene this is unlikely based upon independent evidence from the region which suggests relative stability since c. 4 ka (Argus et al. 2011, Turney et al. 2013). The combination of stability of ice in the catchment of the Institute Ice Stream, and the regional isostatic uplift signal argues that there was no significant recent loss (and subsequent rapid re-expansion) of the deep basins upstream of the present grounding line, as has been suggested from the interpretation of regional airborne RES (Siegert et al. 2013).
Together, the ice sheet model simulations and geological reconstruction presented in the this study demonstrate asymmetry in ice dynamics between the Rutford Ice Stream and Institute Ice Stream during the last glacial-interglacial transition, which realigns during the mid
Holocene between c. 8.3 and 5.3 ka. This reflects a
regional-scale diversion of ice discharge in the Institute Ice Stream due to ice stream capture by the Thiel Trough palaeo ice stream after grounding line retreat between c. 8.3 and 5.3 ka, which impacted regional mass balance in this sector of the WAIS (Fig. 2c). Significantly, this analysis shows that both the Institute and Möller ice streams are susceptible to capture. Additionally, this interpretation corroborates a recent interpretation of marine geophysical evidence which suggests that the Foundation Ice Stream may also be affected by ice streamflow diversion (Larter et al. 2012). All other modelled outlets in the western WSE continue to drain through Rutford Trough, regardless of grounding line position or dynamics.
This threshold-controlled behaviour of the Institute and Möller ice streams is probably a consequence of their
central position between the two major cross-shelf troughs, implying that subglacial topography underlying the ice stream does not significantly restrict flow to a particular route. This has important ramifications for future ice sheet dynamics in the WSE, suggesting that predicted twenty-first century ocean warming in the Thiel Trough (Fogwill et al. 2012, Hellmer et al. 2014) could re-instigate capture of these ice streams. Such a divergence may lead to a marked response due to the deep subglacial basins that exist upstream of the grounding lines (Ross et al. 2012). Whilst previous studies have highlighted switches in ice stream direction using different approaches, including marine geophysical techniques (e.g. Larter et al. 2012), glaciological investigations (Conway et al. 2002) and ice sheet modelling studies (Payne 1999), none have been independently verified by the combined ice sheet modelling and empirical geological approach as described here.
Whilst surface exposure ages in the eastern Weddell Sea suggest that the modelled ice sheet may be too thick in this region at the LGM (Golledge et al. 2012), the limited thickening implied by empirical terrestrial data (Fogwill et al. 2004, Hein et al. 2011), coupled with the greatly advanced grounding line position interpreted from marine geological data (Hillenbrand et al. 2014), can only be reconciled with a surface slope of the LGM grounded ice sheet that is similar to that of the present ice shelf. This suggests an extremely low basal shear stress (< 15 kPa), and it is acknowledged that this disagreement with the observations requires further investigation.
In summary, the asynchronous response of the Rutford Ice Stream and Institute Ice Stream to post-LGM ice
sheet reconfiguration reflects the combination of
streaming ice flow and spatially variable bathymetric
controls on the inner continental shelf, which caused tipping points to be passed during deglaciation, leading to jumps between stableflow patterns. Importantly, both of these major arteries of the WAIS show a remarkable delay in their response to external forcing, particularly sea level, implying that other internal mechanisms are at work. When aligned to marine records, these data reveal that the onset and rate of deglaciation of the Rutford Ice Stream and Institute Ice Stream are controlled independently by grounding line retreat within the Thiel and Rutford troughs, respectively. Thesefindings support recent inference from marine and terrestrial geophysical surveys, which suggest that during deglaciation ice-drainage pathways in the WSE may well have differed from those observed today (Larter et al. 2012, Stolldorf et al. 2012, Siegert et al. 2013). Importantly, these reconstructions, together with independent constraints (Argus et al. 2011, Turney et al. 2013), do not suggest that the Institute Ice Stream has undergone significant drawdown during the late Holocene or subsequent significant re-expansion (Siegert et al. 2013); rather, the
DRIVERS OF ABRUPT HOLOCENE SHIFTS IN WEST ANTARCTICA 683
https:/www.cambridge.org/core/terms. https://doi.org/10.1017/S0954102014000613
results suggest that late Holocene ice stream reconfiguration of the Weddell Sea was driven by spatially variable ice flux at the marine margin, which modulated the direction of individual ice streams of the WAIS during the early Holocene.
Conclusions
The data presented here have demonstrated that two major ice streams of the WSE had an asynchronous response to ocean-forced grounding line retreat. To understand the mechanism for these divergent trends, flow changes predicted by our high-resolution ice sheet simulation, which simulated grounding line retreat in the WSE, were analysed. The decoupling of the surface trajectories of the two ice streams was driven by differences in the rate of grounding line retreat across the WSE, resulting in the Institute Ice Stream switching direction by more than 60° and discharging ice into the Thiel Trough during the early Holocene, rather than the Rutford Trough as it does at present. The new terrestrial geochronological constraints (in situ14C and10Be) reveal that although these two adjacent ice streams exhibited similar surface geometries at the end of the LGM, the pattern of ice surface lowering contrasted markedly after this, with asynchronous thinning trajectories during the late to mid Holocene.
Thesefindings highlight that spatial variability in ice flow can trigger marked changes in the pattern, flux and flow direction of extensive ice streams on millennial timescales, markedly changing regional ice sheet mass balance. A detailed understanding of these abrupt diversions is critical to improve predictions for future WAIS stability in light of the sensitivity of the Institute Ice Stream to marine ice sheet instability today, with its present grounding line below mean sea level at the head of an extensive subglacial trough. Given this evidence of
potential flow switches in the WSE, and in light of
projected twenty-first century regional ocean warming in the Thiel Trough, the ability to predict these abrupt and extensive diversions is a priority within the glaciological community, achievable only through the coupling of high-resolution ice sheet and ocean models.
Acknowledgements
This research was supported by the Australian Research Council (FL100100195, FT1201000004 and LP120200724), and UK National Environmental Research Council (AFI 05/03). Fieldwork was supported by Antarctic Logistics and Expeditions and the British Antarctic Survey. NRG gratefully acknowledges support from Victoria University of Wellington and GNS Science. CJF wishes to thank Dr Neil Ross for helpful discussions, Prof David Sugden
for instigating this work, and Dr Claus-Dieter Hillenbrand and two anonymous reviewers for their helpful comments. Author contributions
CJF, CSMT and NRG conceived the project. NRG undertook the ice sheet modelling experiments and designed the model simulation with CJF. CJF and
DHR analysed the 10Be samples at the University of
Edinburgh and Lawrence Livermore National Laboratory,
respectively. KH, RW and LW developed the 14C
extraction line and gas measurement techniques at ETH Zürich. CJF, DHR, KH, EBR, RSJ and RW analysed the 10Be/14C data interpretation. All authors discussed the results and implications, and commented on the manuscript at all stages.
References
ARGUS, D.F., BLEWITT, G., PELTIER, W.R. & KREEMER, C. 2011. Rise of the Ellsworth mountains and parts of the East Antarctic coast observed with GPS. Geophysical Research Letters, 38, 10.1029/ 2011GL048025.
BALCO, G., STONE, J.O., LIFTON, N.A. & DUNAI, T.J. 2008. A complete and easily accessible means of calculating surface exposure ages or erosion rates from 10Be and 26Al measurements. Quaternary
Geochronology, 3, 174–195.
BAMBER, J.L., RIVA, R.E.M., VERMEERSEN, B.L.A. & LEBROCQ, A.M. 2009. Reassessment of the potential sea-level rise from a collapse of the West Antarctic Ice Sheet. Science, 324, 901–903.
BARD, E. 2003. Tahiti deglacial relative sea level reconstruction. IGBP PAGES/World Data Center for Paleoclimatology Data Contribution Series #2003-028. Boulder, CO: NOAA/NGDC Paleoclimatology Program.
BARD, E., HAMELIN, B., ARNOLD, M., MONTAGGIONI, L., CABIOCH, G., FAURE, G. & ROUGERIE, F. 1996. Deglacial sea level record from Tahiti corals and the timing of meltwater discharge. Nature, 382, 241–244.
BENTLEY, M.J., FOGWILL, C.J., LE BROCQ, A.M., HUBBARD, A.L., SUGDEN, D.E., DUNAI, T.J. & FREEMAN, S.P.H.T. 2010. Deglacial history of the West Antarctic Ice Sheet in the Weddell Sea embayment: constraints on past ice volume change. Geology, 38, 411–414.
BENTLEY, M.J., SUGDEN, D.E., FOGWILL, C.J., LE BROCQ, A.M., HUBBARD, A.L., DUNAI, T.J. & FREEMAN, S.P.H.T. 2011. Deglacial history of the West Antarctic Ice Sheet in the Weddell Sea embayment: constraints on past ice volume change: REPLY. Geology, 39, 10.1130/G32140Y.1.
CHMELEFF, J.,VONBLANCKENBURG, F., KOSSERT, K. & JAKOB, D. 2010. Determination of the10Be half-life by multicollector ICP-MS and
liquid scintillation counting. Nuclear Instruments and Methods in Physics Research, B268, 192–199.
CLARK, P.U. 2011. Deglacial history of the West Antarctic Ice Sheet in the Weddell Sea embayment: constraints on past ice volume change: COMMENT. Geology, 39, 10.1130/G31533C.1.
COMISO, J. 2000. Variability and trends in Antarctic surface temperatures from in situ and satellite infrared measurements. Journal of Climate, 13, 1674–1696.
CONWAY, H., CATANIA, G., RAYMOND, C.F., GADES, A.M., SCAMBOS, T.A. & ENGELHARDT, H. 2002. Switch offlow direction in an Antarctic ice stream. Nature, 419, 465–467.
CUFFEY, K.M. 2011. Antarctic iceflow revealed. Science, 333, 1386–1387.
684 C.J. FOGWILLet al.
https:/www.cambridge.org/core/terms. https://doi.org/10.1017/S0954102014000613
FABEL, D., STROEVEN, A.P., HARBOR, J., KLEMAN, J., ELMORE, D. & FINK, D. 2002. Landscape preservation under Fennoscandian ice sheets determined from in situ produced Be-10 and Al-26. Earth and Planetary Science Letters, 201, 397–406.
FOGWILL, C.J., HEIN, A.S., BENTLEY, M.J. & SUGDEN, D.E. 2012. Do blue-ice moraines in the Heritage Range show the West Antarctic Ice Sheet survived the last interglacial? Palaeogeography, Palaeoclimatology, Palaeoecology, 335, 61–70.
FOGWILL, C.J., BENTLEY, M.J., SUGDEN, D.E., KERR, A.R. & KUBIK, P.W. 2004. Cosmogenic nuclides10Be and26Al imply limited Antarctic ice
sheet thickening and low erosion in the Shackleton Range for>1 m.y. Geology, 32, 265–268.
FOGWILL, C.J., TURNEY, C.S.M., MEISSNER, K.J., GOLLEDGE, N.R., SPENCE, P., ROBERTS, J.L., ENGLAND, M.H., JONES, R.T. & CARTER, L. 2014. Testing the sensitivity of the East Antarctic Ice Sheet to Southern Ocean dynamics: past changes and future implications. Journal of Quaternary Science, 29, 91–98.
GOLLEDGE, N.R., FOGWILL, C.J., MACKINTOSH, A.N. & BUCKLEY, K.M. 2012. Dynamics of the Last Glacial Maximum Antarctic ice-sheet and its response to ocean forcing. Proceedings of the National Academy of Sciences of the United States of America, 109, 16 052–16 056. GOLLEDGE, N.R., LEVY, R.H., MCKAY, R.M., FOGWILL, C.J., WHITE, D.A.,
GRAHAM, A.G.C., SMITH, J.A., HILLENBRAND, C.-D., LICHT, K.J., DENTON, G.H., ACKERT, R.P., MAAS, S.M. & HALL, B.L. 2013. Glaciology and geological signature of the Last Glacial Maximum Antarctic ice sheet. Quaternary Science Reviews, 78, 225–247. HEIN, A.S., FOGWILL, C.J., SUGDEN, D.E. & XU, S. 2011. Glacial/
interglacial ice-stream stability in the Weddell Sea embayment, Antarctica. Earth and Planetary Science Letters, 307, 211–221. HEISINGER, B., LAL, D., JULL, A.J.T., KUBIK, P., IVY-OCHS, S., KNIE, K.
& NOLTE, E. 2002a. Production of selected cosmogenic radionuclides by muons. 2. Capture of negative muons. Earth and Planetary Science Letters, 200, 357–369.
HEISINGER, B., LAL, D., JULL, A.J.T., KUBIK, P., IVY-OCHS, S., NEUMAIER, S., KNIE, K., LAZAREV, V. & NOLTE, E. 2002b. Production of selected cosmogenic radionuclides by muons. 1. Fast muons. Earth and Planetary Science Letters, 200, 345–355. HELLMER, H.H., KAUKER, F., TIMMERMANN, R., DETERMANN, J. & RAE, J.
2012. Twenty-first-century warming of a large Antarctic ice-shelf cavity by a redirected coastal current. Nature, 485, 225–228.
HILLENBRAND, C.D., MELLES, M., KUHN, G. & LARTER, R.D. 2012. Marine geological constraints for the grounding-line position of the Antarctic ice sheet on the southern Weddell Sea shelf at the Last Glacial Maximum. Quaternary Science Reviews, 32, 25–47. HILLENBRAND, C.D., BENTLEY, M.J., STOLLDORF, T.D., HEIN, A.S.,
KUHN, G., GRAHAM, A.G.C., FOGWILL, C.J., KRISTOFFERSEN, Y., SMITH, J.A., ANDERSON, J.B., LARTER, R.D., MELLES, M., HODGSON, D., MULVANEY, R. & SUGDEN, D.E. 2014. Reconstruction of changes in the Weddell Sea sector of the Antarctic Ice Sheet since the Last Glacial Maximum. Quaternary Science Reviews, 10.1016/j. quascirev.2013.10.016.
HIPPE, K., KOBER, F., BAUR, H., RUFF, M., WACKER, L. & WIELER, R. 2009. The current performance of the in situ14C extraction line at ETH. Quaternary Geochronology, 4, 493–500.
HIPPE, K., KOBER, F., WACKER, L., FAHRNI, S.M., IVY-OCHS, S., AKÇAR, N., SCHLUCHTER, C. & WIELER, R. 2013. An update on in situ cosmogenic
14C analysis at ETH Zürich. Nuclear Instruments and Methods in
Physics Research Section, B294, 81–86.
IMBRIE, J.D. & MCINTYRE, A. 2006. SPECMAP time scale developed by Imbrie et al. 1984 based on normalized planktonic records (normalized O-18 vs time, specmap.017). Earth System Science Data, 10.15941PANGAEA.441706
IVY-OCHS, S. 1996. The dating of rock surfaces using in situ produced10Be,
26Al and36Cl, with examples from Antarctica and the Swiss Alps.
PhD thesis, Zurich ETH, 197 pp. [Unpublished].
KOHL, C.P. & NISHIIZUMI, K. 1992. Chemical isolation of quartz for measurement of in-situ produced cosmogenic nuclides. Geochimica et Cosmochimica Acta, 56, 3583–3587.
KORSCHINEK, G., BERGMAIER, A., FAESTERMANN, T., et al. 2010. A new value for the half-life of10Be by heavy-ion elastic recoil detection and liquid scintillation counting. Nuclear Instruments and Methods in Physics Research Section, B268, 187–191.
LARTER, R.D., GRAHAM, A.G.C., HILLENBRAND, C.-D., SMITH, J.A. & GALES, J.A. 2012. Late Quaternary grounded ice extent in the Filchner Trough, Weddell Sea, Antarctica. new marine geophysical evidence. Quaternary Science Reviews, 53, 111–122.
LEBROCQ, A., PAYNE, A. & VIELI, A. 2010. An improved Antarctic dataset for high resolution numerical ice sheet models (ALBMAP v1). Earth System Science Data, 2, 247–260.
LIFTON, N.A., JULL, A.J.T. & QUADE, J. 2001. A new extraction technique and production rate estimate for in situ cosmogenic14C
in quartz. Geochimica et Cosmochimica Acta, 65, 1953–1969. LISIECKI, L.E. & RAYMO, M.E. 2005. A Pliocene-Pleistocene stack of 57
globally distributed benthic 18O records. Paleoceanography, 20,
10.1029/2004PA001071.
NISHIIZUMI, K., IMAMURA, M., CAFFEE, M.W., SOUTHON, J.R., FINKEL, R.C. & MCANINCH, J. 2007. Absolute calibration of10Be AMS standards. Nuclear Instruments and Methods in Physics Research Section, B258, 403–413.
PAYNE, A.J. 1999. A thermomechanical model of ice flow in West Antarctica. Climate Dynamics, 15, 115–125.
PELTIER, W.R. & FAIRBANKS, R.G. 2006. Global glacial ice volume and Last Glacial Maximum duration from an extended Barbados sea level record. Quaternary Science Reviews, 25, 3322–3337.
PETIT, J.R., JOUZEL, J., RAYNAUD, D., et al. 1999. Climate and atmospheric history of the past 420,000 years from the Vostok ice core, Antarctica. Nature, 399, 429–436.
PUTNAM, A.E., SCHAEFER, J.M., BARRELL, D.J.A., VANDERGOES, M., DENTON, G.H., KAPLAN, M.R., FINKEL, R.C., SCHWARTZ, R., GOEHRING, B.M. & KELLEY, S.E. 2010. In situ cosmogenic 10Be production-rate calibration from the Southern Alps, New Zealand. Quaternary Geochronology, 5, 392–409.
RIGNOT, E., MOUGINOT, J. & SCHEUCHL, B. 2011. Ice flow of the Antarctic ice sheet. Science, 333, 1427–1430.
RIGNOT, E., MOUGINOT, J., MORLIGHEM, M., SEROUSSI, H. & SCHEUCHL, B. 2014. Widespread, rapid grounding line retreat of Pine Island, Thwaites, Smith and Kohler glaciers, West Antarctica from 1992 to 2011. Geophysical Research Letters, 41, 3502–3509.
ROSS, N., BINGHAM, R.G., CORR, H.F.J., FERRACCIOLI, F., JORDAN, T.A., LE BROCQ, A., RIPPIN, D.M., YOUNG, D., BLANKENSHIP, D.D. & SIEGERT, M.J. 2012. Steep reverse bed slope at the grounding line of the Weddell Sea sector in West Antarctica. Nature Geoscience, 5, 393–396.
RUFF, M., WACKER, L., GAGGELER, H.W., SUTER, M., SYNAL, H.A. & SZIDAT, S. 2007. A gas ion source for radiocarbon measurements at 200 kV. Radiocarbon, 49, 307–314.
SCHIMMELPFENNIG, I., SCHAEFER, J.M., AKÇAR, N., KOFFMAN, T., IVY-OCHS, S., SCHWARTZ, R., FINKEL, R.C., ZIMMERMAN, S. & SCHLÜCHTER, C. 2014. A chronology of Holocene and Little Ice Age glacier culminations of the Steingletscher, Central Alps, Switzerland, based on high-sensitivity beryllium-10 moraine dating. Earth and Planetary Science Letters, 393, 220–230.
SHAPIRO, N.M. & RITZWOLLER, M.H. 2004. Inferring surface heat flux distributions guided by a global seismic model: particular application to Antarctica. Earth and Planetary Science Letters, 223, 213–224.
SIEGERT, M., ROSS, N., CORR, H., KINGSLAKE, J. & HINDMARSH, R. 2013. Late Holocene ice-flow reconfiguration in the Weddell Sea sector of West Antarctica. Quaternary Science Reviews, 78, 98–107.
DRIVERS OF ABRUPT HOLOCENE SHIFTS IN WEST ANTARCTICA 685
https:/www.cambridge.org/core/terms. https://doi.org/10.1017/S0954102014000613
STOLLDORF, T., SCHENKE, H.W. & ANDERSON, J.B. 2012. LGM ice sheet extent in the Weddell Sea. evidence for diachronous behavior of Antarctic ice sheets. Quaternary Science Reviews, 48, 20–31. STONE, J.O. 2004. Extraction of Al and Be from quartz for isotopic
analysis. Seattle, WA: Cosmogenic Nuclide Laboratories at the University of Washington, 8 pp. Available at: http://depts. washington.edu/cosmolab/chem/Al-26_Be-10.pdf.
SYNAL, H.A., STOCKER, M. & SUTER, M. 2007. MICADAS: a new compact radiocarbon AMS system. Instruments and Methods in Physics Research, B259, 7–13.
THOMAS, R.H. & BENTLEY, C.R. 1978. A model for Holocene retreat of the West Antarctic Ice Sheet. Quaternary Research, 10, 150–170.
TURNEY, C., FOGWILL, C.,VANOMMEN, T.D., MOY, A.D., ETHERIDGE, D., RUBINO, M., CURRAN, M.A.J. & RIVERA, A. 2013. Late Pleistocene and early Holocene change in the Weddell Sea: a new climate record from the Patriot Hills, Ellsworth Mountains, West Antarctica. Journal of Quaternary Science, 28, 697–704.
VAN DE BERG, W.J., VAN DEN BROEKE, M.R., REIJMER, C.H. & VANMEIJGAARD, E. 2006. Reassessment of the Antarctic surface mass balance using calibrated output of a regional atmospheric climate model. Journal of Geophysical Research - Atmospheres, 111, 10.1029/ 2005JD006495.
WACKER, L., BONANI, G., FRIEDRICH, M., HAJDAS, I., KROMER, B., NEMEC, M., RUFF, M., SUTER, M., SYNAL, H.A. & VOCKENHUBER, C. 2010. MICADAS: routine and high-precision radiocarbon dating. Radiocarbon, 52, 252–262.
WEERTMAN, J. 1974. Stability of the junction of an ice sheet and an ice shelf. Journal of Glaciology, 13, 3–11.
WHITE, D., FÜLÖP, R.H., BISHOP, P., MACKINTOSH, A. & COOK, G. 2011. Can in-situ cosmogenic14C be used to assess the in
fluence of clast recycling on exposure dating of ice retreat in Antarctica? Quaternary Geochronology, 6, 289–294.
XU, S., DOUGANS, A.B., FREEMAN, S.P.H.T., SCHNABEL, C. & WILCKEN, K.M. 2010. Improved10Be and26Al-AMS with a 5MV spectrometer. Nuclear
Instruments and Methods in Physics Research Section, B268, 736–738.
686 C.J. FOGWILLet al.
https:/www.cambridge.org/core/terms. https://doi.org/10.1017/S0954102014000613