HAL Id: inserm-00271468
https://www.hal.inserm.fr/inserm-00271468
Submitted on 13 May 2008
HAL is a multi-disciplinary open access archive for the deposit and dissemination of sci-entific research documents, whether they are pub-lished or not. The documents may come from teaching and research institutions in France or abroad, or from public or private research centers.
L’archive ouverte pluridisciplinaire HAL, est destinée au dépôt et à la diffusion de documents scientifiques de niveau recherche, publiés ou non, émanant des établissements d’enseignement et de recherche français ou étrangers, des laboratoires publics ou privés.
Performance of a short dietary questionnaire to assess
nutrient intake using regression-based weights.
Marie-Noël Vercambre, Marie-Christine Boutron-Ruault, Maryvonne
Niravong, Claudine Berr, Françoise Clavel-Chapelon, Stéphane Ragusa
To cite this version:
Marie-Noël Vercambre, Marie-Christine Boutron-Ruault, Maryvonne Niravong, Claudine Berr, Françoise Clavel-Chapelon, et al.. Performance of a short dietary questionnaire to assess nutrient intake using regression-based weights.: Evaluation of a short dietary questionnaire. Public Health Nutrition, Cambridge University Press (CUP), 2008, pp.1-6. �10.1017/S1368980008002310�. �inserm-00271468�
Accepted in Public Health Nutrition, March 2008
Performance of a short dietary questionnaire to assess nutrient intake using regression-based weights
Short title: Evaluation of a short dietary questionnaire
Marie-Noël Vercambre1,2 Marie-Christine Boutron-Ruault1 Maryvonne Niravong1 Claudine Berr2 Françoise Clavel-Chapelon1 Stéphane Ragusa1 Authors’ affiliations 1
INSERM(Institut National de la Santé et de la Recherche Médicale), ERI 20, EA 4045, and Institut Gustave Roussy, Villejuif, F-94805 France
2
INSERM, U888, Montpellier, F-34093 France; Univ Montpellier1, Montpellier, F-34000 France.
Corresponding author:
Françoise Clavel-Chapelon ([email protected]) Tel: (+33) 1 42 11 41 48
Fax: (+33) 1 42 11 40 00
INSERM ERI-20, E3N-EPIC study Institut Gustave-Roussy, Espace Tubiana 39 rue Camille Desmoulins
94805 Villejuif Cedex France
Word count: Abstract: 249; Text: 2,161
Keywords: nutrient; dietary questionnaire; evaluation study; epidemiological method;
prevention
HAL author manuscript inserm-00271468, version 1
HAL author manuscript
HAL author manuscript inserm-00271468, version 1
HAL author manuscript
Abstract:
Objectives: To evaluate the performance of a short dietary questionnaire, using weights to
estimate nutrient intake.
Design: Using dietary data collected in 1993-1995 from a large cohort of French women,
stepwise regression was used to identify the food-groups that best predicted nutrient intakes,
resulting in a short list of 23-foods. This list was used to design a 23-item dietary
questionnaire. Nutrient intake was estimated from the answers to the 23 questions, applying
weights to each response. Weights were calculated from the large database as regression
coefficients of the nutrient intake against the 23 food-groups. In 2005-2006, 103 women
responded (at a one-year interval) to both the short questionnaire and a previously validated
dietary history questionnaire. Intakes of 20 nutrients and energy estimated from these two
questionnaires were compared.
Setting: French adult female population.
Subjects: For developing the instrument, 73,034 women aged 41-72 years. For testing, 103
women aged 55-80 years in 2005.
Results: Mean nutrient intakes generally differed by less than 10% between the two methods.
Correlation coefficients of nutrient intakes ranged from 0.23 for vitamin D to more than 0.65
for magnesium, vitamin B3 and alcohol. For most nutrients, at least 70% of subjects fell into
the same or an adjacent quintile when classified by either of the two questionnaires.
Conclusions: In light of both its strengths and limitations, this short questionnaire could be
used in French adult women to obtain some general nutritional information, notably for
adjustment purposes when response to an extensive questionnaire cannot be obtained.
Introduction
Currently, the leading causes of death in developed countries are chronic diseases such as
cancer, cardiovascular disease and dementia. Diet appears to play a major role in their
aetiology (1-3). Therefore, reliable assessment of nutritional intake is needed for
epidemiological studies but also for screening of potentially inappropriate diet. Several tools
are available, including 24 h recall and food frequency questionnaires, but they require time
for completion and are often difficult to interpret. Other instruments are more simple, but
were designed to assess intake only of specific nutrients (4-7).
We sought to estimate a wide range of nutritional intakes and thus developed an original
dietary assessment method based on responses to a 23-item dietary questionnaire. We
performed an evaluation study of this method in a sample of 103 French women. We report
here its capacity to estimate 20 nutrient and energy intakes, taking as the reference a
previously validated dietary history questionnaire.
Methods
Development of the instrument
Selection of food items that predict nutrient intake
In developing the short questionnaire, we concentrated our efforts on dietary intake
assessment of five nutrients often known to be in deficit in the French female population:
calcium, iron, magnesium, vitamin B6 and omega3 fatty acids (8).
To identify food items which best predicted intakes of these five nutrients, we analyzed
dietary data collected in 1993-1995 from a cohort of French women from the National
Education System, the E3N study (9). This ongoing prospective cohort was initiated in 1990.
It represents the French part of the European Prospective Investigation into Cancer and
Nutrition (EPIC) study (10). Available dietary data included average daily individual intakes
of 208 food and beverage items, as well as energy and various macro- and micronutrient
intakes. For simplification, we first reduced the number of available food groups from 208 to
121 by summing up items of similar nutritional content and pertaining to the same dietary
pattern. For example, white bread and white sandwich loaf were grouped into a single “white bread” item; fresh fish and canned fish were grouped into a single “fish” item.
We then implemented ascending stepwise regression analyses in the E3N population
(n=73,034 ) to identify, among the 121 food groups, those that best predicted nutrient intakes
of interest. For each of the five nutrients selected to develop the questionnaire, we retained the
set of food-groups that enabled to model intake with an R2 of at least 75%, so as to maximize
precision on the nutrients while minimizing the number of retained foods or food groups. This
first step led to a short list of foods.
In a second step, another set of regression models was implemented (still among the 73,034
women) for a wider range of nutrients (20 in total + energy) than the 5 initially used to
implement the short list. Each nutrient to be estimated was modeled as the dependent variable
against the short list of foods as independent variables; the coefficient thus obtained were the
weights to be subsequently used to estimate the nutrient intake from the short questionnaire.
Building up the short questionnaire
The short questionnaire was then built up by formulating specific questions for each retained
food in the above-described short list. Responses were closed-ended with discrete modalities
representing possible and meaningful amounts of consumption. It is noteworthy that since
nutrient intake is calculated using the linear combination of mean food intake reported in the
short questionnaire with their corresponding weight, the estimation no longer requests the use
of a food composition table. .
Evaluation study
Subjects and study design
In the evaluation study, 150 women who responded to the seventh questionnaire of the E3N
cohort were randomly selected and in April 2005 were requested to complete an extensive
two-part dietary history questionnaire. The first part contained questions on the quantity and
frequency of consumption of food groups, while the second consisted of qualitative questions.
A booklet of photographs accompanied the questionnaire in order to facilitate estimation of
portion sizes. Both the questionnaire and the illustrated booklet had been validated previously
(11;12), taking as reference the average of twelve 24 h dietary recalls obtained at monthly
intervals over a 1-year period. Approximately one year later (May 2006), the short dietary
questionnaire was sent to the 119 women who had satisfactorily completed the extensive
dietary history questionnaire. Among them, 16 were excluded because of non-response to the
short questionnaire. Finally, 103 women were included in the evaluation study. As compared
to the 47 women excluded, these 103 women were younger (mean age=65.3 vs. 65.9 years),
more educated (83.5% vs. 78.7% with at least 12 years of education) and leaner (mean body
max index =22.4kg/m2 vs. 23.1), but none of these associations reached significance level.
Reference values of average daily dietary intakes of energy and nutrient were computed on
the basis of responses to the extensive dietary questionnaire using a food composition table
derived from the French national database (13). We also estimated intakes of the same
nutrients on the basis of the short questionnaire, using the regression-based method exposed
above.
Statistical analysis
Means and standard deviations (SD) of nutritional intakes in the 103 women sampled were
estimated by the two methods. Relative over- or underestimation was expressed as percentage
of the ratio (intake estimated from the short dietary questionnaire)/(intake calculated from the
extensive questionnaire). Spearman correlations were then used to compare individual intakes
between the two methods. Since the capacity of a questionnaire to classify or rank individuals
by level of nutrient intake is usually greater than the ability to measure group means,
cross-classification between the short questionnaire and the extensive one was also examined: data
were grouped into tertiles and quintiles, and percentages of individuals with concordant
classification (respectively, same tertile/ same or adjacent quintile) were computed.
Results
Of the initial 121 food-groups, 23 were finally retained in the short list. The number of food
items required to reach R2=0.75 in modeling each nutrient intake through ascending stepwise
regression ranged from 3 for calcium or omega3 fatty acids, up to 10 food-groups for iron.
The 23-item questionnaire is provided in appendix.
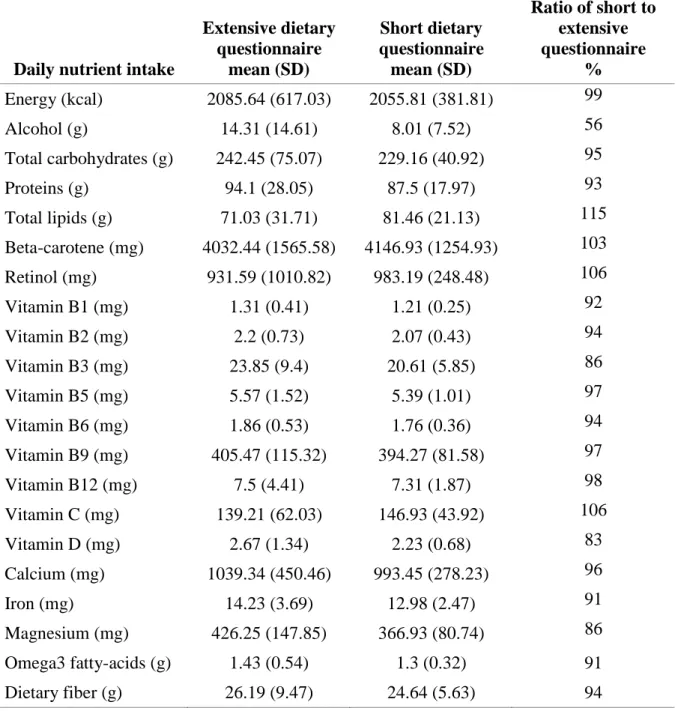
Absolute mean nutritional intake levels produced from the short dietary questionnaire
compared favorably with those based on the extensive questionnaire (Table 1). Overall, the
short questionnaire tended to slightly underestimate mean nutrient intakes compared to the
extensive one. Most mean estimated intakes were within 90-100% of intake levels based on
the extensive questionnaire (reference intakes), and all intakes were within 83-106% of
reference intakes with the notable exception of alcohol (underestimation by 56%).
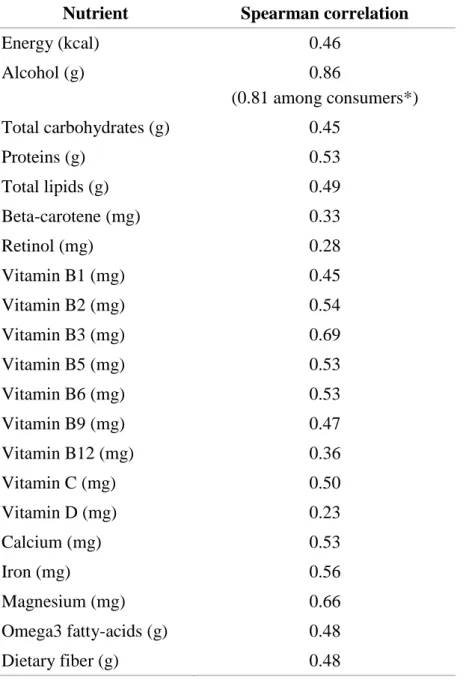
Spearman correlation coefficients between nutritional intake values from the two
questionnaires were lowest (<0.3) for vitamin D and retinol and highest (>0.65) for
magnesium, vitamin B3 and alcohol (Table 2). Overall, correlations were found to be equal to
or higher than 0.50 for half the tested nutritional intakes.
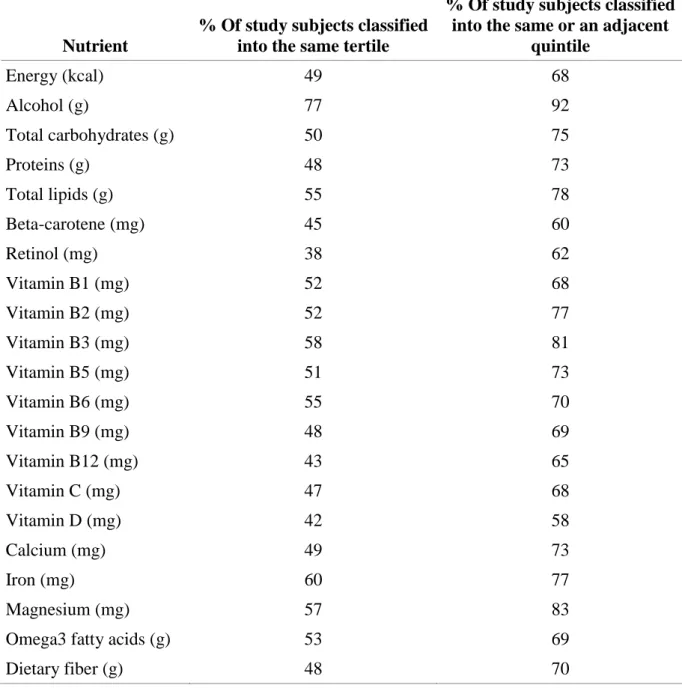
Comparison of tertile and quintile cross-classification of subjects from both questionnaires
(Table 3) showed that for 12 of the 20 nutrients analyzed, at least 70 % of subjects, when
classified with either method, fell into the same or an adjacent quintile.
Discussion
Our weighted 23-item dietary questionnaire proved successful in estimating mean intakes of
energy and most nutrients. In addition, correlation coefficients observed in the present study
(mostly between 0.4 and 0.7) were comparable to those observed in other validation studies of
dietary questionnaires, which mainly chose diet records as the reference for dietary
assessment (14-25). Because of the method used to develop the short questionnaire, the two
sets of nutrient intakes we used in our evaluation study may be considered as dependant on
one another. However, it must be emphasized that the weights were calculated on a very large data set of 73,034 women, thus making them quite “robust” and rather independent of the
103-women evaluation sub-sample. In addition, the “long” questionnaire used for obtaining
these weights was answered to in 1993-1995, while the evaluation study took place more than
10 years later. Finally, the structure of the short and the long questionnaire in the evaluation
study are quite different thus limiting recall of the previous answers: the long questionnaire
considered each daily meal separately and asked for extensive information (frequency and
portion size) on food items potentially consumed during the considered meal, whereas the
short questionnaire asked for mean consumption during a day, or a week, or a month
depending of the investigated food.
To the best of our knowledge, no published questionnaire considered less than 30 food items
except for the 17-item screener developed by Thompson et al. (23) and the 8-item food
frequency questionnaire validated by Bogers et al (22). However, these two instruments were
specifically developed to estimate fruit and vegetable intake, and relative validity indices were
not available for a wide range of nutrients.
In general, a short questionnaire may not be adequate for accurately assessing consumption of
certain specific nutrients (when not expressly designed for that purpose). The problem may
arise when some rare foods have a very high concentration of a specific nutrient (e.g. liver for
retinol); it also arises for lipid-soluble vitamins, specifically for vitamin E, and most fatty
acids, which would request addition of several questions on intake of vegetable fats. Indeed
our questionnaire was not designed to assess such nutrients, and results confirmed mediocre
estimates (data not tabulated). Although it is possible to increase the number of considered
food groups or gather more detailed information (open-ended questions on portion size and
frequency of use), the more complex the dietary questionnaire, the lower the compliance.
Since diet history questionnaires may be lengthy and end up with a non-negligible rate of
non-response, an easy-to-fill dietary questionnaire may well be the only solution for obtaining
some general nutritional information from non-respondents.
Finally, the purpose of the dietary survey will guide the choice of the dietary questionnaire.
The absolute individual intake level may not be required; ranking of subjects can be
sufficiently informative, notably in the case of adjustment for nutritional intake in
epidemiological studies, and our short questionnaire proved satisfactory to rank individuals
for most nutrients. For example, while absolute individual alcohol intake was clearly
underestimated in the short questionnaire, categorization of the subjects according to alcohol
proved satisfactory. In the opposite, mean population estimates of vitamin D and
beta-carotene intakes were close to those from the extensive questionnaire, and sufficient for
surveillance purposes at the public health level; however ranking of individuals for these
nutrients was mediocre, which was not unexpected for lipid-soluble vitamins as discussed
above. Indeed, correct classification by chance alone to within the same or adjacent quintile is
expected in 52% of subjects(16), and it has been suggested that ranking was not satisfactory
when less than 70% (which corresponds to a Kappa value for cross-classification of quintiles
around 0.40).
It must also be stressed that the validity of the new tool could be influenced by different
sources of error involved in the method. First, the validity of the short questionnaire depends
on the ability of respondents to report their usual pattern of intake (evaluation of consumed
quantities/ adequacy between reality and available modalities in the answer). Second, it is
possible that the regression-based method gives a less satisfactory performance if weights
used to compute intakes do not suit the population responding to the short questionnaire. In
the present case, the short questionnaire was developed from data only from women;
moreover, their education level was particularly high compared to that of the general
population (most of them were teachers). However, the weights appeared relatively stable
towards sample modification. Further analyses in subgroups of the initial dataset (for
example, among women with less than 12 years of education) showed weights of a similar
magnitude as those computed in the whole sample, allowing to argue that our instrument can
be used in other French female populations, and possibly in other female European
populations.
In any case, the general methodology exposed in the present article could be used to adapt the
short questionnaire to other populations. In designing a new version, it will be interesting to
customize the food-items list for the specific country or region, to adapt the length and format
of the answers, and to evaluate the performance of the method through an evaluation study in
a sample from the target population. It would also be necessary to compute weights adapted
from an adequate database.
In conclusion, the performance of this new instrument, as compared to an extensive validated
dietary questionnaire, appears satisfactory for most examined nutrients. The originality of our
study relies mostly on the regression-based approach used to develop the short dietary
assessment tool. The main strength of this short questionnaire is that it is easy to respond and
not time-consuming. Therefore and given its rather good performance in ranking individuals,
the present short questionnaire seems appropriate as dietary assessment tool in studies in
which nutrition is not central but nevertheless required for adjustment purposes. Its use as a
screening method for detecting low-adherence to nutritional advice, especially when a longer
questionnaire cannot be obtained warrants further investigation.
Reference list
1. Key TJ, Allen NE, Spencer EA, Travis RC. The effect of diet on risk of cancer. Lancet
2002;360:861-8.
2. De Caterina R, Zampolli A, Del Turco S, Madonna R, Massaro M. Nutritional
mechanisms that influence cardiovascular disease. Am.J Clin.Nutr 2006;83:421S-6S.
3. Luchsinger JA, Mayeux R. Dietary factors and Alzheimer's disease. Lancet Neurol.
2004;3:579-87.
4. Taylor RW, Goulding A. Validation of a short food frequency questionnaire to assess
calcium intake in children aged 3 to 6 years. Eur.J Clin.Nutr 1998;52:464-5.
5. Rohrmann S, Becker N. Development of a short questionnaire to assess the dietary
intake of heterocyclic aromatic amines. Public Health Nutr 2002;5:699-705.
6. Pufulete M, Emery PW, Nelson M, Sanders TA. Validation of a short food frequency
questionnaire to assess folate intake. Br.J Nutr 2002;87:383-90.
7. Blalock SJ, Norton LL, Patel RA, Cabral K, Thomas CL. Development and assessment
of a short instrument for assessing dietary intakes of calcium and vitamin D. J
Am.Pharm.Assoc.(2003.) 2003;43:685-93.
8. Martin A. Apports nutritionnels conseillés pour la population française (French). Paris:
TEC & DOC, 2001.
9. Clavel-Chapelon F, van Liere MJ, Giubout C et al. E3N, a French cohort study on
cancer risk factors. E3N Group. Etude Epidemiologique aupres de femmes de
l'Education Nationale. Eur.J Cancer Prev. 1997;6:473-8.
10. Riboli E. Nutrition and cancer: background and rationale of the European Prospective
Investigation into Cancer and Nutrition (EPIC). Ann.Oncol. 1992;3:783-91.
11. van Liere MJ, Lucas F, Clavel F, Slimani N, Villeminot S. Relative validity and
reproducibility of a French dietary history questionnaire. Int.J.Epidemiol. 1997;26 Suppl
1:S128-S136.
12. Lucas F, Niravong M, Villeminot S, Kaaks R, Clavel-Chapelon F. Estimation of food
portion size using photographs: validity, strength, weaknesses and recommendations. J
Human Nutr Dietetics 1995;8:65-74.
13. Favier J.C., Ireland-Ripert J., Toque C., Feinberg M. Répertoire général des aliments.
Table de composition (Food composition table) CIQUAL-REGAL (French). INRA;
AFSSA; CIQUAL; TEC & DOC, 1995.
14. Willett WC, Sampson L, Stampfer MJ et al. Reproducibility and validity of a
semiquantitative food frequency questionnaire. Am.J Epidemiol. 1985;122:51-65.
15. Block G, Hartman AM, Naughton D. A reduced dietary questionnaire: development and
validation. Epidemiology 1990;1:58-64.
16. Horwath CC. Validity of a short food frequency questionnaire for estimating nutrient
intake in elderly people. Br.J Nutr 1993;70:3-14.
17. Takatsuka N, Kurisu Y, Nagata C, Owaki A, Kawakami N, Shimizu H. Validation of
18. Egami I, Wakai K, Kato K et al. A simple food frequency questionnaire for Japanese
diet--Part II. Reproducibility and validity for nutrient intakes. J Epidemiol.
1999;9:227-34.
19. Lee KY, Uchida K, Shirota T, Kono S. Validity of a self-administered food frequency
questionnaire against 7-day dietary records in four seasons. J Nutr Sci
Vitaminol.(Tokyo) 2002;48:467-76.
20. Tsubono Y, Kobayashi M, Sasaki S, Tsugane S. Validity and reproducibility of a
self-administered food frequency questionnaire used in the baseline survey of the JPHC
Study Cohort I. J Epidemiol. 2003;13:S125-S133.
21. Ogawa K, Tsubono Y, Nishino Y et al. Validation of a food-frequency questionnaire for
cohort studies in rural Japan. Public Health Nutr 2003;6:147-57.
22. Bogers RP, Van Assema P, Kester AD, Westerterp KR, Dagnelie PC. Reproducibility,
validity, and responsiveness to change of a short questionnaire for measuring fruit and
vegetable intake. Am.J Epidemiol. 2004;159:900-9.
23. Thompson FE, Midthune D, Subar AF, Kahle LL, Schatzkin A, Kipnis V. Performance
of a short tool to assess dietary intakes of fruits and vegetables, percentage energy from
fat and fibre. Public Health Nutr 2004;7:1097-105.
24. Tokudome Y, Goto C, Imaeda N et al. Relative validity of a short food frequency
questionnaire for assessing nutrient intake versus three-day weighed diet records in
middle-aged Japanese. J Epidemiol. 2005;15:135-45.
25. Roddam AW, Spencer E, Banks E et al. Reproducibility of a short semi-quantitative
food group questionnaire and its performance in estimating nutrient intake compared
with a 7-day diet diary in the Million Women Study. Public Health Nutr 2005;8:201-13.
Appendix: Dietary questionnaire
Please tick the box corresponding to your usual dietary consumption. One box per question.
Per day…
1/ How much white bread do you consume per day?
(1 “baguette”= 250g ; 1 “ficelle”= 120g ; 1 loaf of French bread= 400g) O 0g O 30g O 60g O 90g O 120g O 150g O 200g O 250g and + 2/ How much whole-meal bread do you consume per day?
O 0g O 15g O 30g O 45g O 60g O 75g O 90g O 120g O 150g and + 3/ How many cups of milk do you drink per day? (1 small cup= 70 ml ; 1 bowl = 4 cups) O 0 O 1/2 O 1 O 2 O 3 O 4 O 5 and +
4/ How many cups of coffee do you drink per day? (1 small cup= 70 ml ; 1 bowl = 4 cups) O 0 O 1 O 2 O 3 O 4 O 5 O 6 O 7 O 8 O 9 and +
5/ How many portions of cheese do you consume per day? (1 portion = 30g) O 0 O 1/4 O 1/2 O 1 O 2 O 3 O 4 O5 and +
6/ How much fruit do you consume per day? (1 apple= 1 pear= 1 banana= 200g)
O 0g O 50g O 100g O 150g O 200g O 250g O 300g O 350g O 400g O 500g O 600g and +
7/ How many tablespoons of oil do you consume per day? (for cooking, seasoning, etc. O 0 O 1/4 O 1/2 O 1 O 1,5 O 2 O 3 O 4 O 5 and +
8/ How many portions of butter do you consume per day?
(on slices of bread, for cooking, seasoning, etc. 1 individual portion= 10g) O 0 O 1/4 O 1/2 O 1 O 1,5 O 2 O 3 O 4 O 5 and +
Per week…
9a/ How many times do you eat lettuce per week?
O 0 O 1 O 2 O 3 O 4 O 5 O 6 O 7 O 8 O 9 and + 9b/ How many portions each time? (1 portion = 60g)
O 0 O 1/2 O 1 O 1,5 O 2
10/ How many portions of French beans do you consume per week? (1 portion = 100g) O 0 O 1/2 O 1 O 1,5 O 2 O 2,5 O 3 and +
11/ How many portions of cooked carrots do you consume per week? (1 portion = 100g) O 0 O 1/2 O 1 O 1,5 O 2 O 2,5 O 3 and +
12/ How many portions of legumes (whole lentils, beans, etc. do you consume per week? (1 portion = 100g)
O 0 O 1/2 O 1 O 1,5 O 2 O 2,5 O 3 O 3,5 and +
13/ How many portions of chips or fried potatoes do you consume per week? (1 portion = 100g)
O 0 O 1/4 O 1/2 O 1 O 2 O 3 O 4 O 5 and + 14/ How many eggs do you consume per week?
O 0 O 1 O 2 O 3 O 4 O 5 O 6 and +
15/ How many portions of fish do you consume per week? (1 breaded fish= 50g) O 0g O 50g O 100g O 150g O 200g O 300g O 400g O 500g and + 16/ How much poultry (chicken, turkey, rabbit.) do you consume per week? ( 1 leg = 100g)
O 0g O 50g O 100g O 150g O 200g O 300g O 400g O 500g and + 17/ How much pork (chop, ham, sausage.) do you consume per week?
( 1 chop= 2 slices of ham= 2 sausages = 100g)
O 0g O 50g O 100g O 150g O 200g O 300g O 400g O 500g and + 18/ How much beef do you consume per week? (1 steak of medium size = 100g) O 0g O 50g O 100g O 150g O 200g O 300g O 400g O 500g and + 19/ How much wine do you drink per week?
O 0 O 1 glass O 2 glasses O 3 glasses O 1 bottle O 2 bottles O 3 bottles O 4 bottles and +
20/ How many yogurts do you consume per week?
O 0 O 1 O 2 O 3 O 4 O 5 O 6 O 7 O 8 O 9 O 10 O 11 and + 21/ How much chocolate or how many chocolate bars do you consume per week? O 0 O 2 squares O1 bar O 2 bars O 3 bars O 1 block O 2 blocks and +
Per month…
22/ How many bags of breakfast cereal do you consume per month? (1 bag = 375g) O 0 O 1 O 2 O 3 O 4 O 5 and +
23/ How many portions of nuts (walnuts, peanuts, almonds, etc.) do you consume per month? (1 portion = 60g)
O 0 O 1/2 O 1 O 2 O 3 O 4 O 5 O 6 and +
Acknowledgments
The E3N study is supported by the French League against Cancer, the European Community, the 3M Company, the “Mutuelle Générale de l’Education Nationale”, the French Institute of Health and Medical Research, the Gustave Roussy Institute and several general councils in France. M.-N. Vercambre is on a grant from Statlife and the “Association Nationale de la Recherche Technique”. Stéphane Ragusa is “Maître de Conférence associé” at the Université Pierre et Marie Curie and is responsible for Statlife.
This research would not have been possible without the excellent cooperation of the women who so willingly participated in the E3N study. Our grateful thanks go to Céline Bellenguez, Marie Hospitel and Bérengère Fournier for their preliminary work on the topic, to Tiba
Baroukh for fruitful discussions concerning programs for dietary data analysis, to all members of the E3N group and to Jerri Bram for assistance with English editing.
Author contributions:
F. Clavel-Chapelon had full access to all data in the study and takes responsibility for the integrity of the data. MN. Vercambre takes responsibility for the accuracy of data analysis. Study concept and design: Ragusa, Vercambre. Acquisition of data and statistical analysis: Clavel-Chapelon, Vercambre. Drafting of the manuscript: Vercambre. Critical revision of the manuscript for important intellectual content: Vercambre, Boutron-Ruault, Clavel-Chapelon, Berr, Ragusa. Study supervision: Clavel-Chapelon, Ragusa.
Table 1. Basic statistics for average daily intakes of energy and 20 macro- and micronutrients as estimated by an extensive or a 23-item dietary questionnaire in 103 women from the E3N cohort, France, 2005-2006
Daily nutrient intake
Extensive dietary questionnaire mean (SD) Short dietary questionnaire mean (SD) Ratio of short to extensive questionnaire % Energy (kcal) 2085.64 (617.03) 2055.81 (381.81) 99 Alcohol (g) 14.31 (14.61) 8.01 (7.52) 56 Total carbohydrates (g) 242.45 (75.07) 229.16 (40.92) 95 Proteins (g) 94.1 (28.05) 87.5 (17.97) 93 Total lipids (g) 71.03 (31.71) 81.46 (21.13) 115 Beta-carotene (mg) 4032.44 (1565.58) 4146.93 (1254.93) 103 Retinol (mg) 931.59 (1010.82) 983.19 (248.48) 106 Vitamin B1 (mg) 1.31 (0.41) 1.21 (0.25) 92 Vitamin B2 (mg) 2.2 (0.73) 2.07 (0.43) 94 Vitamin B3 (mg) 23.85 (9.4) 20.61 (5.85) 86 Vitamin B5 (mg) 5.57 (1.52) 5.39 (1.01) 97 Vitamin B6 (mg) 1.86 (0.53) 1.76 (0.36) 94 Vitamin B9 (mg) 405.47 (115.32) 394.27 (81.58) 97 Vitamin B12 (mg) 7.5 (4.41) 7.31 (1.87) 98 Vitamin C (mg) 139.21 (62.03) 146.93 (43.92) 106 Vitamin D (mg) 2.67 (1.34) 2.23 (0.68) 83 Calcium (mg) 1039.34 (450.46) 993.45 (278.23) 96 Iron (mg) 14.23 (3.69) 12.98 (2.47) 91 Magnesium (mg) 426.25 (147.85) 366.93 (80.74) 86 Omega3 fatty-acids (g) 1.43 (0.54) 1.3 (0.32) 91 Dietary fiber (g) 26.19 (9.47) 24.64 (5.63) 94
Table 2. Spearman correlation coefficients for comparison between an extensive and a 23-item dietary questionnaire in 103 women from the E3N cohort, France, 2005-2006
Nutrient Spearman correlation
Energy (kcal) 0.46 Alcohol (g) 0.86 (0.81 among consumers*) Total carbohydrates (g) 0.45 Proteins (g) 0.53 Total lipids (g) 0.49 Beta-carotene (mg) 0.33 Retinol (mg) 0.28 Vitamin B1 (mg) 0.45 Vitamin B2 (mg) 0.54 Vitamin B3 (mg) 0.69 Vitamin B5 (mg) 0.53 Vitamin B6 (mg) 0.53 Vitamin B9 (mg) 0.47 Vitamin B12 (mg) 0.36 Vitamin C (mg) 0.50 Vitamin D (mg) 0.23 Calcium (mg) 0.53 Iron (mg) 0.56 Magnesium (mg) 0.66 Omega3 fatty-acids (g) 0.48 Dietary fiber (g) 0.48
* Alcohol consumers = women whose alcohol intake was non-null from one or the other dietary questionnaire. Consumer frequency: n =85
Table 3. Agreement between classification by intake level using the extensive dietary questionnaire and the 23-item questionnaire in 103 women from the E3N cohort, France, 2005-2006
Nutrient
% Of study subjects classified into the same tertile
% Of study subjects classified into the same or an adjacent
quintile Energy (kcal) 49 68 Alcohol (g) 77 92 Total carbohydrates (g) 50 75 Proteins (g) 48 73 Total lipids (g) 55 78 Beta-carotene (mg) 45 60 Retinol (mg) 38 62 Vitamin B1 (mg) 52 68 Vitamin B2 (mg) 52 77 Vitamin B3 (mg) 58 81 Vitamin B5 (mg) 51 73 Vitamin B6 (mg) 55 70 Vitamin B9 (mg) 48 69 Vitamin B12 (mg) 43 65 Vitamin C (mg) 47 68 Vitamin D (mg) 42 58 Calcium (mg) 49 73 Iron (mg) 60 77 Magnesium (mg) 57 83
Omega3 fatty acids (g) 53 69
Dietary fiber (g) 48 70