MRS Energy & Sustainability : A Review Journal
page 1 of 40
© Materials Research Society, 2014 doi:10.1557/mre.2014.9
ABSTRACT
Owing to advances in micro- and nanofabrication methods over the last two decades, the degree of sophistication with which solid
sur-faces can be engineered today has caused a resurgence of interest in the topic of engineering sursur-faces for phase change heat transfer.
This review aims at bridging the gap between the material sciences and heat transfer communities. It makes the argument that optimum
surfaces need to address the specifi cities of phase change heat transfer in the way that a key matches its lock. This calls for the design
and fabrication of adaptive surfaces with multiscale textures and non-uniform wettability.
Among numerous challenges to meet the rising global energy demand in a sustainable manner, improving phase change heat transfer has
been at the forefront of engineering research for decades. The high heat transfer rates associated with phase change heat transfer are
essen-tial to energy and industry applications; but phase change is also inherently associated with poor thermodynamic effi ciency at low heat fl ux,
and violent instabilities at high heat fl ux. Engineers have tried since the 1930s to fabricate solid surfaces that improve phase change heat
transfer. The development of micro and nanotechnologies has made feasible the high-resolution control of surface texture and chemistry over
length scales ranging from molecular levels to centimeters. This paper reviews the fabrication techniques available for metallic and silicon-based
surfaces, considering sintered and polymeric coatings. The infl uence of such surfaces in multiphase processes of high practical interest,
e.g., boiling, condensation, freezing, and the associated physical phenomena are reviewed. The case is made that while engineers are in
prin-ciple able to manufacture surfaces with optimum nucleation or thermofl uid transport characteristics, more theoretical and experimental efforts
are needed to guide the design and cost-effective fabrication of surfaces that not only satisfy the existing technological needs, but also
cata-lyze new discoveries.
Keywords : phase transformation , coating , texture , microstructure , energy generation
REVIEW
Surface engineering for phase
change heat transfer: A review
Daniel Attinger and Christophe Frankiewicz , Department of Mechanical Engineering , Iowa State University , Ames , IA 50011 , USA
Amy R. Betz , Department of Mechanical and Nuclear Engineering , Kansas State University , Manhattan , KS 66506 , USA
Thomas M. Schutzius , Department of Mechanical and Industrial Engineering , University of Illinois at Chicago , Chicago , IL 60607 , USA; and Department of Mechanical and Process Engineering , ETH Zurich , 8092 Zurich , Switzerland
Ranjan Ganguly , Department of Mechanical and Industrial Engineering , University of Illinois at Chicago , Chicago , IL 60607 , USA; and
Department of Power Engineering , Jadavpur University , Kolkata 700098 , India
Arindam Das , Department of Mechanical and Industrial Engineering , University of Illinois at Chicago , Chicago , IL 60607 , USA
Chang-Jin Kim , Department of Mechanical and Aerospace Engineering , University of California , Los Angeles , CA 90095 , USA
Constantine M. Megaridis , Department of Mechanical and Industrial Engineering , University of Illinois at Chicago , Chicago , IL 60607 , USA Address all correspondence to Daniel Attinger at attinger@iastate.edu and Constantine M. Megaridis at cmm@uic.edu
Introduction
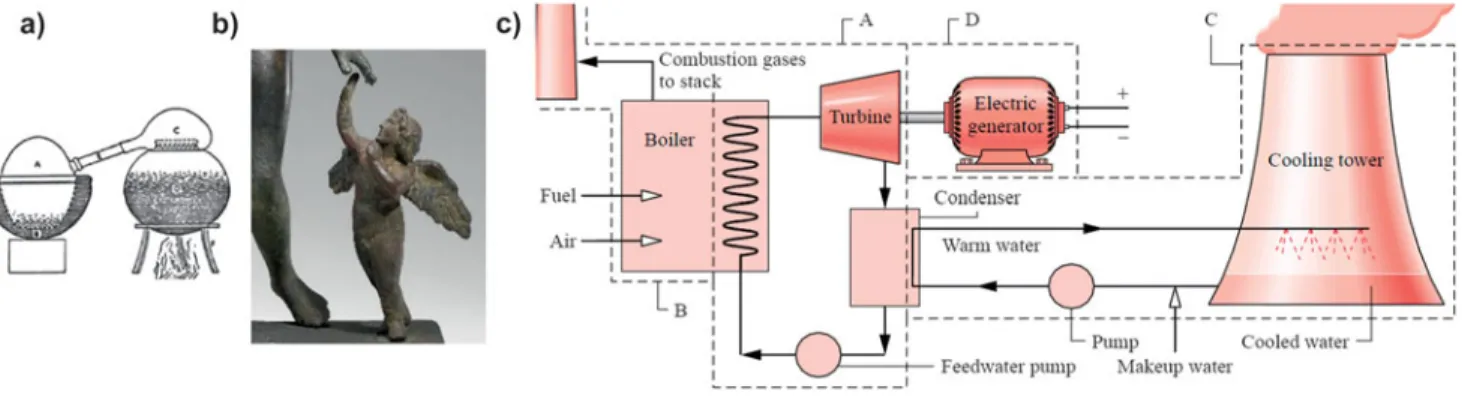
This review discusses the increasingly important contri-butions of advanced materials and novel fabrication tech-niques in enhancing phase change heat transfer and the related energy applications. Technologies based on phase change heat transfer have been serving mankind for more than two millennia, 1 with some examples shown in Fig. 1 .
Phase change is essential to energy applications, where it drasti-cally enhances heat transfer because latent heat is typidrasti-cally much larger than sensible heat. 2 For instance, the latent heat
needed to boil one gram of water ( h = 2260 J/g) is more than 100 times larger than the heat required to increase the tem-perature of the same amount of water by 5 K ( c p Δ T = 21 J g −1 ).
In addition, phase change is frequently accompanied by fast and large changes in specifi c volume, which result in enhanced heat transfer due to convection.
Three phase change processes with industrial relevance are considered in a synthetic manner: boiling, condensation, and ice/frost formation. After a presentation of how to characterize phase change, the properties of an optimum surface for each of these three modes of phase change is described; then some fabri-cation/manufacturing techniques available to modify surface texture and chemistry are described; next, the ways that these techniques have been used to date to enhance phase change
heat transfer are reviewed. An emphasis is placed on the fast-developing area of wettability engineering, which relies on manipulating both surface texture and chemistry using special techniques and advanced materials. Then, an assessment is given on the prospective energetic, economic, and environ-mental benefits of advanced surface engineering for phase change heat transfer. Finally, several research needs and priori-ties are identifi ed and outlined, toward the goal of engineering optimum surfaces for phase change heat transfer. The review also aims at bridging the gap between the materials and heat transfer communities toward the common goal of designing and deploying optimum material systems with enhanced heat transfer performance and increased thermodynamic effi cien-cies, thus achieving more sustainable energy transmission and production.
Characterization of phase change heat transfer
As mentioned in the introduction, the amount of heat exchanged during phase change heat transfer is very high. Therefore, phase change heat transfer is desired in many industrial applications, 5 such as during thermal generationof electricity, desalination, metallurgy, electronics cooling, and food processing. Industrial applications with phase change typically use water-based fluids or refrigerants, depending on considerations of the amount of heat to be transferred, operating conditions, and interactions of the fluid with elec-tronic components. 6 Figure 2 describes and compares the three
phase change processes considered in this review, according to their physical mechanisms, time scales and length scales. Boiling, condensation, and frost formation are each multiphase and quasi-steady processes, as shown in Fig. 2 with circular color arrows. For instance, nucleate boiling involves the temporal sequence of nucleation, bubble growth and detach-ment, and a similar cycle is observed for condensation and freezing, as described in the caption of Fig. 2 . As will be demonstrated later in this section, these quasi-steady processes
Figure 1. Human beings have relied on phase change heat transfer from Antiquity to now, to satisfy needs such as (a) alcohol production by distillation 1
(ca. 600 BCE, India), (b) metal casting for military or artistic purposes (Eros with Aphrodite, bronze, ca. 100 BCE), and (c) boiling and condensation for mechanical power, since the industrial revolution of the 19th century. 4 Figures (a, b, c) reprinted with respective permissions of ASME, by courtesy of the
Getty's Open Content Program, and with the permission of the Taylor and Francis Group.
DISCUSSION POINTS
• Today’s manufacturing abilities vastly outgrow our ability to measure, design and model phase change heat transfer devices. Over the last 40 years, the basic performance of phase change heat transfer surfaces, i.e. their effi ciency and power dissipa-tion, has not improved signifi cantly.
• The rational design of optimum surfaces for phase change heat transfer is currently almost impossible, because the physics is too complex and still poorly understood.
exchange heat optimally when the solid surface is in contact with both the discrete and continuous fl uid phases, e.g., the respective vapor and liquid in the case of nucleate boiling. However, phase change processes can experience instability toward a steady state of lower thermodynamic efficiency. After this transition, shown with an upward black arrow in Fig. 2 , the solid surface is in contact with only one fluid phase, e.g., with vapor in the case of film boiling. In fact, the art of designing optimum surfaces for phase change heat transfer relies on keeping the solid surfaces in contact with both the continuous and discrete fluid phases, for the sake of optimum thermodynamic performance.
A traditional description of these phase change processes is given with the phase diagram in Fig. 3 . The diagram also describes the terminologies used in this review: boiling (liquid to vapor phase change); condensation (vapor to liquid); sublima-tion (solid to vapor); desublimasublima-tion (vapor to solid), also known as atmospheric deposition; melting (solid to liquid); solidifi-cation or freezing (liquid to solid); icing describes the trans-formation of water to ice. The term frosting is used for the vapor to solid phase change. However, frosting may also describe the transition from vapor to solid via the liquid phase.
Thermodynamically, a first measure of phase change heat transfer performance is the maximum heat flux exchanged Figure 2. Synthetic representation and universal features of phase change heat transfer during boiling, 7 – 13 condensation, 14 – 17 or frost formation. 18 , 19
The most effi cient mode thermodynamically is the quasi-steady state represented by circular arrows. Time and length scales are listed for each stage of this mode. In boiling, it involves the succession of bubble nucleation (a), growth (b), and detachment (c). In condensation, it involves the succession of drop nucleation (a), growth (b), coalescence (c), and detachment (d). In desublimation or atmospheric frost growth, it involves crystal growth (a), layer growth (b), then dendrite or bulk growth (c), and removal by external forces, like scraping (d). When phase change occurs faster than the removal of the discrete phase, instability occurs and each process transitions towards a single-phase regime which is thermodynamically less effi cient. Photograph of the boiling process is reprinted from Ref. 11 , copyright 2012, with permission from Elsevier. Photograph of the condensation process is reprinted with permission from Ref. 16 , copyright 2012 American Chemical Society. Photograph of the frost process is reprinted with permission from Ref. 20 . Copyright 2010 American Chemical Society.
Figure 3. The phase change processes considered in this review can all be described in a pressure (log scale) – temperature diagram. The points A, C, and E illustrate the thermodynamic discussion in boiling, section “Characteristics of optimum surfaces for boiling heat transfer”, whereas the points B, D, and E are relevant to condensation, section “Characteristics of optimum surfaces for condensation heat transfer.”
between a solid surface and the fl uid. For a boiling fl uid, the crit-ical heat fl ux (CHF) is the highest heat fl ux that can be exchanged, before the individual vapor bubbles merge into a vapor layer that insulates the surface from the liquid. Optimizing CHF can be seen as optimizing the heat transport, in the sense implied by the fi rst principle of thermodynamics.
A second measure of performance of phase change heat transfer is the heat transfer coeffi cient, HTC = q ″/ Δ Τ , the ratio of the heat fl ux q ″ to the difference in temperature between the solid surface and the fl uid. HTCs are a measure of thermody-namic effi ciency of heat transport, in the meaning of the second law. HTCs associated with phase change are typically one to two orders of magnitude larger than HTCs in single phase, because the latent heat minimizes Δ Τ .
The characteristics of a solid surface that maximize HTC depend on the fl uid and the Δ Τ . The largest HTCs are typically achieved in regimes where both the continuous and discrete phases are in contact with the solid surface, such as the nucleate boiling regime or the analogous regime of dropwise condensa-tion (DwC). 21 In these regimes, the solid surface interacts with
multiple liquid and vapor volumes, maximizing interfacial and convective transport. For that reason, wettability engineering could play a critical role to improve phase change heat transfer. If q ″ is increased beyond CHF, the HTC is drastically reduced because heat is no longer transferred convectively but radia-tively. This causes a significant and often destructive surface temperature increase, 22 – 24 called dry-out and recently seen in
Fukushima, Japan. 25 Similar considerations can be made for
condensation, where the transition from DwC to fi lm condensa-tion (FC) drastically reduces HTC.
An optimum surface for phase change heat transfer is there-fore a surface that optimizes heat transport according to the fi rst and second principles of thermodynamics.
Phase change heat transfer is diffi cult to model or investi-gate experimentally, because it is a transient and multiscale phenomenon involving dynamic motion of multiple inter-faces. The inherent complexity of phase change heat transfer appears in Table 1 , which lists the forces and mechanisms gov-erning the associated transport of heat and mass. Tradition-ally, the relative importance of pairs of forces or mechanisms is expressed with dimensionless numbers. Heat and mass transport is characterized with the Fourier, Biot, Nusselt, and Jakob numbers. Fluid fl ow is characterized with the Reynolds, Bond, Weber, Froude, capillary, and Galilei numbers, as well as the drag coeffi cient. The relative importance of fl uid fl ow transport – as compared with heat and mass transport – is expressed in terms of the Prandtl, Schmidt, Grashof, and Eckert numbers. The infl uence of geometric/physical proper-ties is expressed with numbers such as void fraction, wetting angle, density ratio, viscosity ratio, and surface roughness. This extraordinary large quantity of twenty dimensionless numbers suggests that phase change heat transfer cannot be described with general theories, and that full similarity is impossible to obtain in experimental studies. 26
Table 1. List of the fl uid phases for typical phase change heat transfer processes, with the mechanisms and forces involved.
Boiling
Condensation
Desublimation
Freezing
Continuous phase
Liquid
Vapor
Vapor
Liquid
Discrete phase
Vapor
Liquid
Solid
Solid
Wettability that promotes nucleation
Hydrophobic
Hydrophilic
Hydrophilic
Debated
Wettability that delays transition from
high to low thermodynamic effi ciency
Hydrophilic
Hydrophobic
Hydrophobic
Debated
Forces that promote discrete phase
detachment from substrate
Buoyancy, shear, inertia
Gravity, surface
tension, shear
Shear
Inertia, external
stress
Forces that promote discrete phase
attachment to substrate
Surface tension
Surface tension,
gravity, inertia
Gravity, surface
tension, adhesion
Adhesion
Dominant heat transfer mechanism
at low q /Δ T
Single phase convection
Single phase
convection
Single phase
convection
Single-phase (liquid)
convection
Dominant heat transfer mechanism
at high q , below CHF
Multiphase convection
Multiphase
convection
Convection (primarily)
and conduction
Conduction,
convection
Dominant mechanism for q above CHF
Radiation
Single phase
convection
Finally, let us consider how the development of micro- and nanotechnologies has impacted phase change heat transfer over the last 40 years. Drastic improvements have been made in implementing phase change heat transfer solutions closer to the heat source, 6 as in electronics packaging. However, has the
development of micro- and nanotechnologies improved the pri-mary performance of surfaces for phase change heat transfer, such as the CHF and HTC? Figure 4 shows that, for the widely studied process of water boiling on a copper surface, HTCs have been stable over the last 40 years, while CHFs have increased by a factor 2-3. These improvements are signifi cant; however, several other technologies, such as computing power or energy density in batteries, have improved their performance by orders of magnitude over the same 40 years. Also, the theoretical limits of these improvements are either largely unknown or much higher, as exemplifi ed by the “kinetic limit” obtained using the kinetic theory for the maximum heat fl ux. This limit can be reached if all molecules are emitted at the speed of sound from the liquid–vapor interface. As established by Schrage, 27
for water at atmospheric pressure, the kinetic limit is defi ned as q CHF , K = 0.741 c ρ v h fg ≈ 1.6 × 10 4 W cm −2 , where c is the speed
of sound and ρ v is the vapor density; this value is plotted in red
in Fig. 4 . In that context, it seems worthy to review the funda-mental mechanisms that govern phase change heat transfer, and new ways of engineering surfaces to enhance these mecha-nisms, with the ultimate goal to raise the practically attained performance closer to theoretical limits.
Characteristics of optimum surfaces for boiling heat transfer
Boiling is a multiphase and multiscale energy transfer pro-cess from a heated surface to a liquid resulting in its vigorous vaporization. The fi rst boiling curves, relating the heat fl ux to the superheat temperature of a solid surface, were measured byNukiyama. 39 Applications of boiling vary, but in general, surfaces
can be engineered to facilitate nucleation or maximizing the CHF by preventing fi lm boiling. 27 , 40 – 51 Let us describe here the physical
aspects of the nucleation process, nucleate boiling and CHF, with emphasis on the contributions of the solid–fl uid interface.
As a starting point, we summarize the thermodynamic processes of vapor formation in boiling, based on the exten-sive descriptions in Refs. 5 and 52 . In Fig. 3 , the solid line corresponds to the coexistence or binodal curve, where both liquid and vapor can exist in a stable state. Metastable states can also exist in the vicinity of the binodal curve. For instance, point A is a metastable liquid state, and B a metastable vapor state.
Nucleation
Nucleation can occur at a solid surface, or within the bulk of the metastable liquid; the former process is called “hetero-geneous nucleation,” while the latter is called “homo“hetero-geneous nucleation.” Equilibrium thermodynamics can be used to pre-dict the conditions for the incipience of boiling, i.e., the gener-ation of a stable vapor nucleus.
For a closed system at thermodynamic equilibrium, constant pressure and temperature, boiling occurs under conditions of thermal, mechanical, and chemical equilibrium. 52 The thermal
equilibrium means that the temperatures of the vapor phase and the liquid phase are equal. The radius r * of a vapor nucleus in mechanical equilibrium with the surrounding liquid is given by the Young–Laplace equation
G = s _ _ a σ − = (1)
In engineering systems, the requirement of chemical equi-librium corresponds to p V ≈ p sat , i.e., p C ≈ p E (in Fig. 3 for a pure
Figure 4. In the representative process of water boiling on a heated copper surface, 40 years of micro- and nanoengineering of surfaces have not signifi cantly improved HTCs (at Δ T = 5 K). CHF values remain well below the thermodynamic limit. Studies 28 – 32 , 34 – 38 , 118 , 168 , 182 , 234 are referenced with the
liquid). Thus, boiling involves the phase change of a metastable liquid at a pressure lower than the saturated pressure (point A at T L and p L in Fig. 3 ) into a stable vapor phase (point C, usually
approximated by E at T L and p sat > p L ).
The superheat temperature Δ T = T L − T sat required for a
nucleus to grow spontaneously is obtained from the pressure difference in Eq. (1) , often using a linear approximation of the P – T saturation curve 52 as S s S E E A a σ Δ = (2)
The incipience of boiling can be determined by considering the evolution of vapor nuclei. Nuclei occur naturally in the bulk liquid by density fl uctuations, and may either collapse or grow depending on their Gibbs free energy 5
s W^\ s u r t a 8 a a ¬ ® = π σ − (3)
The Gibbs free energy corresponds to the thermodynamic work required for the creation of a nucleus with radius r in the bulk fl uid. By the second principle of thermodynamics, the nuclei that will grow spontaneously are the ones with ∂8W^\ ∂ ≤a { . From Eq. (3) , G hom is maximum at r *, and only the nuclei with r > r * will
grow spontaneously. 53 In engineering systems, the incipience of
boiling corresponds to the production of stable vapor nuclei at a rate J of 10 3 –10 7 cm −3 s −1 , with J depending exponentially on the
ratio of the free energy of the equilibrium vapor nucleus, over the Boltzmann constant k B times the system temperature 5
W^\ 3 = Tg_ 8 a ; 4 Z E ¬ ® − ~ (4)
with C being a function of the liquid properties. For water at atmospheric pressure, a nucleation rate J = 10 7 cm −3 s −1
corre-sponds to a superheat temperature of 204 °C with pressure dif-ference larger than 8 atm and vapor nuclei with sizes O(30 nm). These temperature and pressure values are much larger than experimental values on technical surfaces, where the onset of nucleate boiling typically occurs at a superheat of 6–10 °C . 54 , 55
Homogeneous nucleation appears therefore to play a weak role in boiling applications.
Indeed, it is commonly assumed that the solid–fl uid interface facilitates the nucleation process. This ‘heterogeneous nuclea-tion’ process is described, for atomically smooth surfaces, by a reduction of the free energy when nuclei are created on a surface 56 + θ+ θ θ = φ φ = − s WTc W^\ WTc 3 = s sR^b R^b bX] fXcW u P]S Tg_ 8 8 8 a ; < Z E ¬ ® ~ (5)
Here, θ is the wetting angle, as defi ned in section “Wettabil-ity engineering”, and K depends on the physical properties of the liquid and the solid. Heterogeneous nucleation is observed for J = O(10 10 m −2 s −1 ). 52 For superhydrophobic surfaces, ϕ tends
exponentially toward 0, so that nucleation occurs at negligible superheat; for metallic surfaces with θ ≈ 30°, ϕ tends toward 1, negating the thermodynamic advantage of nucleating on a sur-face rather than in the bulk. In fact, the superheat estimated using the above two equations ( Δ T ≈ 188 °C for smooth Tefl on with θ = 120° or 211 °C for smooth metal with θ = 30°) is again much higher than the 6–10 °C superheat observed with water on real surfaces.
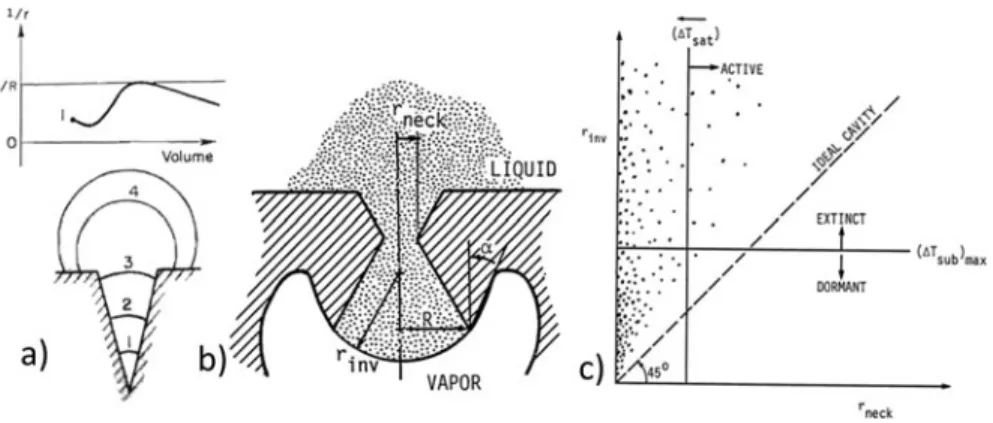
In fact, surfaces typically facilitate nucleation because of their natural pits and cavities. Gas or vapor entrapped in these geometries enhances the process of heterogeneous nuclea-tion. Rigorous analysis of how a complex geometry enhances nucleation is possible and presented in section “Engineered surfaces for boiling heat transfer.” It is however a challenging task given the inherent randomness in surface texture and chemistry. As a result, experiments are typically conducted to measure the rate of nucleation or the spatial density of active nucleation sites n . Qi and Klausner 57 describe the infl uence of the
material and surface texture on the density of nucleation sites. Wang and Dhir 42 used optical microscopy to measure
distri-butions of cavity sizes on surfaces with different wettabilities ( θ = 90°, 35°, and 18°). They obtained a distribution of cavi-ties of the form b
\
] ∝5− with 2 < m < 5.4, depending on the diameter of the cavity mouth D . They also found the number of active nucleation sites n to be proportional to (1 − cos θ ) D −6 .
Recently, Betz et al. 58 measured n as a function of Δ T for a wide
range of wetting angles [ Fig. 5(a) ]. They found that nucleation occurred on a superhydrophobic surface at superheats that were two orders of magnitude lower than those on a smooth hydrophilic surface.
For real surfaces , a general trend similar to the one obtained on ideal surfaces is illustrated in Fig. 5(a) : the lower the surface wettability, the lower superheat needed for nucleation.
Nucleate boiling
At higher superheat, suffi cient to sustain the quasi-steady regime of nucleate boiling (see Fig. 2 ), the heat and mass transfer is complex and transient, involving (i) convective heat transport driven by buoyancy and moving bubbles, 40 , 60 , 61
(ii) evaporation at the surface and wetting line of the growing bubbles, 62 , 63 and (iii) motion of the wetting line in the
pres-ence of fast evaporation. 8 , 64 Numerous models have been
pro-posed to describe nucleate boiling. 65 For instance, Fig. 5(b)
shows the inverted stagnation fl ow model of Tien, 59 widely
used to estimate the HTC in nucleate boiling. It assumes a similarity between the hydrodynamic fl ow of a bubble column rising from a heated surface and the stagnation fl ow against a wall, and illustrates the wide range of length scales present in boiling.
Most models of nucleate pool boiling describe the heat fl ux as a power law 52 :
`''∝ ΔE ]2 3 (6)
with 1 ≤ A ≤ 1.8 and 0.3 ≤ B ≤ 0.5. A numerical study of Abarajith and Dhir 66 investigated the influence of the
wetting angle on the growth and departure of a single bubble. The simulation method was based on the finite-difference method with interface reconstruction by the level set method. The contact angle was varied from 1° to 90° by changing the Hamaker constant, and HTC was found to increase with increasing contact angles for moderate levels of superheat.
When the heat fl ux increases, transition from nucleate to fi lm boiling occurs, and radiative heat transport becomes the dominant transport mechanism. The CHF is the maximum heat fl ux reached at this transition, and its mechanism has been considerably investigated because of its industrial rele-vance. 67 For hydrophilic systems, the model by Zuber 46
con-siders that at high heat fl ux, single bubbles coalesce to form vapor columns. A velocity shear between the bulk liquid and these columns is induced by buoyancy, and CHF occurs when the resulting Helmholtz instability merges columns into a vapor layer, insulating the heated surface from the liquid. 52
Lienhard and Dhir 68 refi ned this model, assuming that the
pitch between the columns equals the wavelength of Rayleigh– Taylor instabilities. They obtained the following equation for the heat fl ux at CHF: r u s 497 = G =G = G G `'' =4 ρ W ¢σVρ ρ ρ− ¯± (7)
where C L is a constant equal to 0.149 (Ref. 68 ) or 0.131. 46
A second model by Haramura and Katto 69 assumed that the
Helmholtz instability along large vapor bubbles results in the formation of a stable liquid microlayer between the heated sur-face and the bubbles. Small Helmholtz-stable vapor jets pierce the liquid microlayer, connecting the nucleation sites with the bubbles. CHF occurs when the microlayer has totally evapo-rated. Experimental studies with water were found in very good agreement with this model. 52
The two hydrodynamic models above assume a very wettable surface. The effect of wettability on CHF has been studied experimentally, 50 , 70 establishing that hydrophobic surfaces
have lower CHF than hydrophilic surfaces.
The effect of wettability on CHF was modeled analytically by Kandlikar, 71 who proposed that CHF occurs when the
momen-tum fl ux caused by evaporation at the contact line overcomes gravity and surface tension forces, creating a vapor blanket. This can be modeled replacing the constant C L by a function of
θ in Eq. (7) . Dhir and Liaw 72 developed a computational model
valid from nucleate to transition boiling, assuming that the energy from the superheated wall is transferred by conduction through the microlayer. Their results estimated CHF for mostly nonwetting surface, with θ as a parameter. Finally, Theofanous 48
suggests that “CHF is controlled by the microhydrodynamics and rupture of an extended liquid microlayer, sitting and vapor-izing autonomously on the heater surface,” a process which is infl uenced by surface wettability.
From this body of experiments and theories, a dilemma appears given the above considerations on nucleation and CHF. On the one hand, HTCs at low heat fl ux are enhanced on sur-faces with low wettability. On the other hand, HTCs at high heat fl uxes are enhanced on surfaces with high wettability, and so is the CHF.
Characteristics of optimum surfaces for condensation heat
transfer
Like boiling, condensation is a multiscale and multiphase phenomenon. In technical applications, condensation refers to the phase change of a metastable vapor (point B in Fig. 3 ) into a stable liquid (point D). Condensation has been studied on typical engineering geometries, along plates and channels, or inside channels, as reviewed in Ref. 73 . For the sake of Figure 5. Boiling occurs over a wide range of length scales. Plot (a) shows how nucleation is infl uenced by the surface microtexture and chemistry, that is the wettability, 58 with θ denoting the wetting angle, as defi ned in section “Wettability engineering”. In nucleate boiling (b), the length scales 59 range from
micrometer (the thermal boundary layer), to millimeter (the bubble diameter), to centimeter (the pitch s between bubble columns). Figure (a) is reprinted from Ref. 58 , copyright 2013, and (b) is reprinted from Ref. 59 , copyright 1962, both with permission from Elsevier.
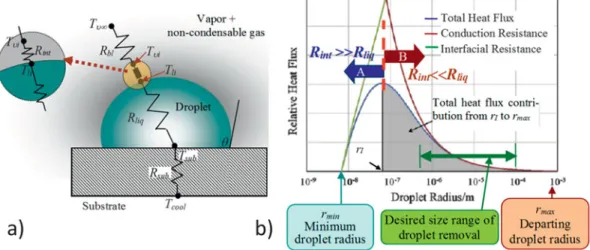
Figure 6. Thermal aspects and length scales in dropwise condensation (DwC). (a) Schematic representation of thermal resistances associated with DwC [ R bl : vapor boundary layer thermal resistance (present if the vapor phase has noncondensable gases), R int : vapor–liquid interface thermal resistance, R liq :
liquid conductive thermal resistance, R sub : substrate thermal resistance. Temperature legends – T υ ∞ : far stream vapor; T υ i : interface (vapor side); T li :
interface (liquid side); T sub : substrate (droplet base); T cool : subcooled surface]. (b) Infl uence of the drop size on the relative heat fl ux contributions. Reprinted
from Ref. 90 , copyright 2013, with permission from Elsevier.
simplicity, this review is focused on external condensation, which may occur either as a liquid fi lm (FC) or in the form of individual drops (DwC), see Table 1 . DwC is facilitated for fl uids with high surface tension or on low-energy surfaces, 74 and
occurs via the quasi-steady process described in Fig. 2 . For many engineering applications, the condensate is water which tends to wet metal surfaces, and the condensing droplets even-tually end up forming a fi lm on the surface, leading to FC. By its geometry and multiphase structure, DwC is a process analog to convective boiling. DwC typically occurs in dehumidifi cation or ammonia-based processes, while FC is prevalent in most other technical applications.
When the affi nity between the condensing liquid and the solid surface is high, droplets of condensate nucleate on myriads of nucleation sites (nanoscale surface defects) on the cooled sub-strate. The droplets grow by sustained condensation caused by continuous cooling; droplet growth also occurs by impact and coalescence during the sliding of drops caused by gravity or by coalescence induced by droplet growth. 75 Heat transfer
takes place from the gas phase to the substrate through the con-densing droplets (except on areas that are not covered with droplets, where the heat transfer is direct). In DwC, progressive coalescence exposes new domains on the substrate for fresh nucleation and growth. DwC has received much attention from the heat transfer community due to its potential to produce HTCs that are an order of magnitude larger than in the FC mode. 76 Despite the initial promise for high performance, and
extensive research over several decades – barring a hiatus in the '90s – achievement of sustained DwC has remained elusive till this date. The DwC process, its performance and technical applications have been extensively reviewed in Ref. 74 , which also describes a theoretical prediction of the HTC. Several
groups have made notable contributions to the theoretical and experimental characterization of DwC and the pertinent heat transfer correlations since its fi rst report. 77
The mechanism responsible for DwC is subject to debate, 52
be it either drops nucleating and growing on a dry surface 78
or drops resulting from the breakup of an unstable thin fi lm. 79
The process of heterogeneous nucleation relies on reducing the Gibbs free energy associated with the creation of solid nuclei on the condensing surface. As in the case of boiling in section “Characteristics of optimum surfaces for boiling heat trans-fer”, the Gibbs free energy for heterogeneous nucleation of condensate also depends on the homogeneous free energy and the liquid contact angle (in its vapor), so that
(
s)
WTc W^\ fXcW r u s sR^b R^b bX]
8 8
Δ = Δ φ, φ = − θ − θ θ (8)
The factor ϕ in Eq. (8) is the analog to that in Eq. (5) , which implies the exact opposite trend as in boiling, that is, hetero-geneous nucleation in condensation is easier on a hydrophilic surface rather than on a hydrophobic one.
Theoretical models 80 – 82 to predict DwC heat transfer rates
typically consider the heat transfer across a single hemispher-ical condensing droplet as shown in Fig. 6(a) . The temperature difference Δ T = ( T υ ∞ − T cool ) that drives the heat fl ux is partly
offset by the subcooling required to condense on a convex liq-uid droplet of radius r . The subcooling can be approximated as
Δ ≅E sEbPcσ ρW aUV , with h fg the latent heat, combining Eq. (2)
and the Clausius–Clapeyron equation, and the same equation can be used to estimate the minimum viable droplet radius for a given subcooling Δ T , see Fig. 6(b) .
Resistances to DwC heat transfer are due to thermal conduc-tion ( R liq ) through the liquid drop and mass transfer at the
liquid–vapor interface ( R int ). 52 The substrate thermal resistance
( R sub ) may also play a role due to droplet recalescence , i.e., the
rejection of the latent heat of condensation. 83 On an actual
con-densing substrate, droplets of different sizes coexist: the ratio of the number of largest drops ( ∼ 1 mm) to the smallest drops (1 nm) being typically 10 6 . For inclined surfaces, the largest size r
max at
which the droplet slides by gravity is found to increase with increasing liquid surface tension and contact angle hysteresis, and decreases with increasing equilibrium contact angle and tilt angle. 84
The determination of the overall condensation HTC across the condenser surface requires integrating the heat fl ux at each droplet base, as obtained from the thermal resistance model described in Fig. 6(a) over the entire spectrum of droplet sizes ( r min < r < r max ) and estimating the driving degree of subcooling
Δ T = ( T υ ∞ − T cool ). A closed form solution of this model does not
exist, and even numerical solutions are challenging due to the large range of droplet sizes involved, see Fig. 6(b) . Measure-ments show that the drop-size distribution follows a statistically time-invariant pattern. For smaller droplets with r min < r < r E ,
where r E = (4 n ) −1/2 with the nucleation site density n on the
order of 10 13 –10 15 m −2 (Ref. 85 ), the distribution of drop sizes
can be obtained from a population balance. 86 For larger
drop-lets with r E < r < r max , the fractional surface area covered by
a droplet with base radius greater than r follows the distribution in Refs. 75 , 86 , and 87 . Substantial effort has been expended in numerical simulations of droplet nucleation 88 and drop growth
and coalescence. 87
Besides the thermophysical properties of the fluid and the solid substrate, the HTC in DwC also depends on other key parameters like degree of subcooling, heat fl ux, maximum droplet radius, presence of noncondensable gases, and gas phase pressure. The HTC increases with the degree of subcool-ing or the surface heat fl ux due to enhanced activation of nucle-ation sites. 89 The droplet size also has an impact on HTC.
Bonner 90 showed that for droplet radii less than a few hundred
nanometers, the overall heat transfer is limited by R int , while for
larger droplets, the infl uence of R liq dominates [see Fig. 6(b) ].
Effective DwC technologies, therefore, should typically aim at removing the droplets from the surface before they grow too large, preferably at an order of magnitude lower than the capil-lary length of the liquid. 14 Interestingly, the HTC is severely
reduced in the presence of even minute amounts of a noncon-densable gas 74 , 91 : HTCs are reduced by up to 30% for DwC 92 and
50% for FC 93 with a concentration of noncondensable gas of
0.5% by volume. This illustrates that noncondensable gases infl uence the nucleation process in condensation, as they also do in boiling. Besides, the presence of air adds a diffusion resist-ance ( R bl ) to steam–air boundary layers 93 [see Fig. 6(a) ] and alters
the relative contribution of latent and sensible heat transfer. 92
Most importantly, several industrial applications involve con-densation of binary fl uids, where Marangoni stresses promote similar structures to DwC. 94 , 95 Vapor-side pressure infl uences
the HTC primarily through the R int . Tanasawa 96 reported
that for water vapor DwC, HTC varied from 0.383 MW m −2
K −1 at 0.01 atm to 15.7 MW m −2 K −1 at 1 atm.
Forces responsible for the removal of the condensate are dif-ferent in nature and weaker in condensation than in boiling, see Table 1 . This removal typically occurs by shear or gravity forces; rather than shear and buoyancy in boiling.
When the solid surface removes less condensate than that condensing on the surface, a thick fi lm forms on the surface, and FC occurs. FC typically features one order of magnitude lower HTCs than DwC, 52 because (i) much of the condensing
surface that is covered with the liquid fi lm cannot offer hetero-geneous nucleation sites, and (ii) the liquid fi lm offers a consid-erable thermal resistance.
The transition from drop- to fi lm-wise condensation, sche-matically shown in Fig. 2 , is a process similar to the boiling tran-sition from nucleate to fi lm boiling, and similarly, it is poorly understood. A typical value of the peak heat fl ux corresponding to that transition for steam is 10 MW m −2 , as reported in Ref. 74 .
At least two transition mechanisms have been proposed for the transition from DwC to FC 74 : (i) under high heat fl ux, the droplet
growth rate exceeds the condensate removal rate, leading to increased coverage of condenser surface area by the condensate and merging, or (ii) the density of active nucleation sites increases with increasing Δ T , leading to a situation where condensates from neighboring active nucleation sites merge into a wetted patch.
Nusselt provided a simple model for HTC in FC, assuming laminar fl ow, pure vapor and negligible convection 97
ρ ρ ρ υ∞ − = μ − r u t = = G = = R^^[ 9E4 {zut VW ZUV = E E ¯ ¡ ° ¡ ° ¡ ° ¢ ± (9)
with L , μ L , and k L standing, respectively, for the length of
a vertical plate, viscosity of the liquid, and thermal conduc-tivity of the liquid. Later, Rohsenow 98 included thermal
advection effects with a latent heat term that depends on the Jakob number.
To summarize, the salient issues specifi c to condensation on solid substrates are (i) the design of substrates that promote het-erogeneous nucleation, and (ii) the effi cient drainage of the fi lm or the evacuation (removal) of the drops from the condensing surface. The fi rst factor bears a direct infl uence of the surface wettability, while the second depends both on the condensing surface and the acting physical forces.
Characteristics of optimum surfaces for freezing
and desublimation
As per the defi nitions related to Fig. 3 and Table 1 , there are at least eight terms describing phase change from or toward the solid phase. Solidifi cation (freezing) commonly occurs in tech-nological processes, such as free-form manufacturing, rapid prototyping, metals processing, microelectronic fabrication, etc. Despite the large number of technologically relevant fl uids that can undergo solidifi cation, for the sake of simplicity, this section concentrates only on aqueous systems.
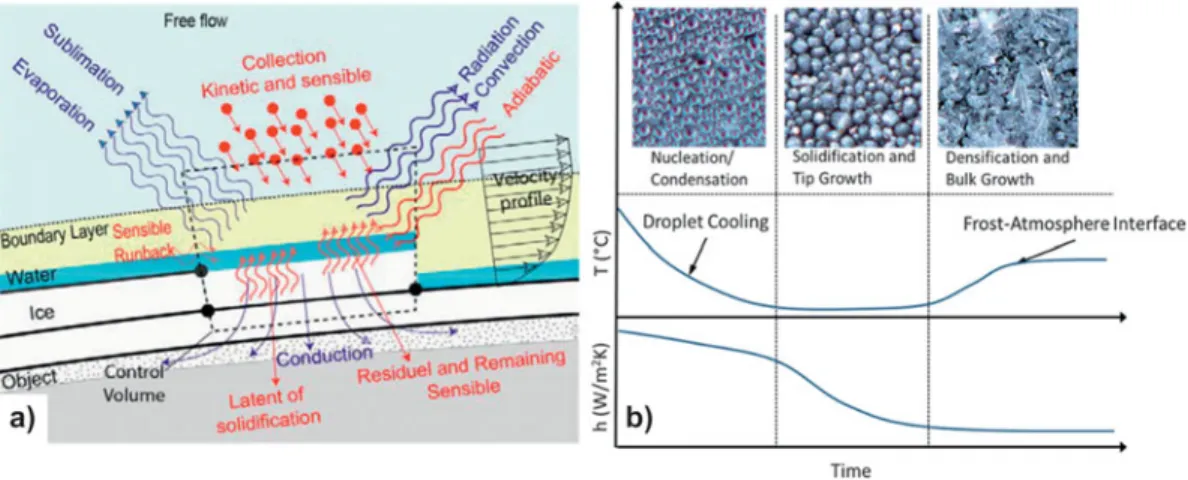
During the densifi cation and bulk-growth phase, the frost thickness and density increase, resulting in signifi cantly lower thermal conductivity and reduced heat transfer, see Fig. 7(a) .
Eventually, the frost thickness reaches a maximum, as shown in Fig. 2 : the temperature of the frost surface is no longer cold enough to promote further frost growth, and an equilibrium heat fl ux is reached. 99 Measuring HTCs in freezing confi gurations
poses formidable challenges, as roughness changes continuously on ice-covered surfaces. The roughness controls the boundary layer structure in the vicinity of the solid, in turn affecting the convective fl ow structure around the body, the resulting heat transfer and the droplet collection effi ciency, which in turn, infl uence the ice shape. 100 The high dependence of HTC on the
specifi c conditions of each problem prevents generalizations and makes the development of HTC correlations diffi cult. HTCs up to 2 kW m −2 K −1 have been measured for ice accreted on airfoils in
wet (vapor rich) and dry (vapor poor) regimes. 100 For water frosts
deposited on a cooled plate from a humid air stream, HTCs in the range 20–60 W m −2 K −1 were reported. 99 Various correlations
for HTC under frosting conditions as related to refrigeration applications are given in the review by Iragorry et al. 101
For most technical applications, ice and frost have negative consequences and surfaces that mitigate their buildup are desired. For example, in refrigeration systems, frost can form an insulating layer which impedes heat transfer 101 , 102 or increase
pressure drop in ducts. Ice formation on planes can prevent the movement of ailerons and decrease aircraft safety. Ice can also adversely impact the safety and operation of wind turbines, marine vessels, and offshore oil platforms. 103 Moreover, frost
and ice buildup can make systems brittle or heavy, leading to catastrophic failure. For applications where frost avoidance is desired, an ideal surface must prevent nucleation.
Freezing/Icing
The formation of ice from a metastable supercooled liquid occurs via ice nuclei, i.e., tiny transient crystalline clusters existing in various sizes within the water phase. Continuous
size fl uctuations of these clusters occur due to the simultaneous addition of molecules and detachment of the same. Based upon the various thermodynamic parameters, the nucleus size may grow large enough to become stable, i.e., for growth to become more probable than decay. This designates the critical size for stability, and hence further nucleation of the solid phase. Stabil-ity of ice nuclei mainly depends upon their surface-to-volume ratio. As the size of the ice phase increases, this ratio decreases, thus making the number of molecules returning to the liquid from the ice surface far less signifi cant compared to the number of interior molecules, hence establishing stability of the nucleus and facilitating growth. Nucleation of this type is known as homogeneous nucleation. There exists another type of nuclea-tion where the nucleus forms on some pre-existing solid struc-ture, thus making the stability of the nucleus more probable. This type of nucleation is known as heterogeneous nucleation and is far more common than homogeneous nucleation due to its smaller free energy barrier, as described in section “Charac-teristics of optimum surfaces for boiling heat transfer”. Hence, heterogeneous nucleation is sought for technical applications; it is also similar to the nucleation process discussed in the con-densation section. As seen from Eq. (8) , which also applies here, increasing the contact angle delays condensation, and thus ice formation. 104 – 110 In fact, since high contact angles decrease the
contact area between the water and the cold surface, if the pres-sure is high enough to condense fi rst and then freeze water, the decreased contact area will slow heat transfer and delay freezing time. 105 Additionally, low energy surfaces usually have low
adhesion to water and ice 105 ; coupled with engineered forced
convection, these surfaces effi ciently prevent ice buildup. In addition to ice formation within the liquid water phase, ice can also form on a solid surface directly from the vapor state; this phenomenon is known as desublimation or atmospheric deposi-tion. The term frosting is also used to describe this process (see section “Characterization of phase change heat transfer”). Figure 7. Thermal aspects and spatial features in icing and frosting. (a) Schematic depiction of processes involved in ice accretion on the top of a solid object exposed to a free fl ow in conditions conducive to freezing. Reprinted from Ref. 100 , copyright 2005, with permission from Elsevier. (b) Photographs (top) of the three stages of condensation frosting on a hydrophilic surface shown with the corresponding temporal evolution of temperature and HTC (bottom). Pictured areas are 1 mm × 1 mm, from coauthor A.R.B.
Desublimation/Frosting
Frost is formed when humid air comes in contact with a solid surface at a temperature below the freezing temperature of water. Frost can form either by condensing then freezing or directly through solid deposition. 104 In the former, frost
forma-tion has two distinct phases similar to the condensaforma-tion process: nucleation and growth. Before frost forms, the heat transfer is dominated by single phase convection. At the onset of nucle-ation, heat transfer is dominated by multiphase convection. In frosting, nucleation depends on surface structure and the availability of nucleation sites.
Several studies have been conducted on the ice/frost repellency of superhydrophobic surfaces. 20 , 105 , 110 Due to the
increased surface area and roughness, some superhydrophobic surfaces have also shown increased frost nucleation compared to smooth hydrophobic surfaces. 105 , 108 Other research has
also shown that a low contact angle hysteresis prevents frost nucleation. 111 Kim et al. 111 studied liquid-infused porous
sur-faces, which provide a defect-free molecularly fl at liquid inter-face, while maintaining a high contact angle. The lowest rates of frosting were observed on surfaces that had both a high contact angle and low contact angle hysteresis.
After nucleation and cooling, frost goes through two distinct growth phases, see Fig. 7(b) . First, the frost goes through the solidifi cation and tip growth stage, with conduction and mul-tiphase convection dominating the heat transfer. Then, dur-ing the densifi cation and bulk-growth stage, the temperature increases at the interface between the frost and the atmosphere and the frost layer eventually reaches an equilibrium thickness and temperature with the environment. During this period, the heat transfer is dominated by conduction. The fi nal frost thick-ness depends on the surface temperature and relative humidity. The thermal conductivity of the surface has been shown to affect frost growth. 112 On low thermal conductivity surfaces,
a supercooled millimeter-sized droplet freezes slowly, with evaporation triggered by the latent heat released upon recales-cent freezing. Eventually, the gas volume around the droplet reaches saturation and vapor microdroplets coalesce to form droplets that deposit around the main droplet, eventually crystallizing and forming a frost halo. Experiments in Ref. 112 under controlled humidity conditions establish how a balance between heat diffusion and vapor transport determines the fi nal expansion of the frozen condensate halo, which, in turn, con-trols frost formation and propagation.
The surface energy may also infl uence the frost growth and density. 109 Once a thin layer of frost is deposited, the surface
energy of the base surface should no longer affect the growth of subsequent frost. 107 , 113 However, the surface energy infl uences
the initial shape of the crystal, therefore modifying the kinet-ics and changing the dendritic frost growth patterns. 109 , 114 , 115
Experimental evidence suggests that hydrophilic surfaces pro-duce a higher density frost, 114 while hydrophobic surfaces form
more dendrites creating a looser frost structure. 114
In summary, surfaces with low wettability prevent, delay, or slow down the formation of ice from a metastable,
supercooled liquid. The role of roughness on frost formation is not clear at present. Also, the more wettable the surface, the denser the frost layer.
State of the art methods for micro- and
nanofabrication of surfaces
Several approaches and numerous techniques are available to fabricate the surfaces of interest for phase change heat trans-fer. The phase change on a solid surface is affected by the energy and texture of the surface. The surface energy is of chemical nature but manifests itself physically as a contact angle. Aside from some practical issues, such as changes over time and tem-perature, the surface energy is a relatively simple parameter as it is inherent to each material. The surface texture, on the other hand, is geometric in nature and can have many variables, such as pitch (periodicity), spacing, depth, shape, and randomness. Another important variation for phase change heat transfer is the local control of the surface energy and texture, i.e., a surface can juxtapose regions with different chemistries and textures. These infi nite possibilities of multiscale spatial arrangements leave ample room for heat transfer enhancement. Here we dis-cuss the fabrication methods used to control the energy and texture of surfaces for phase change heat transfer.
Surface machining and roughening
Compared with a smooth surface, a roughened surface enhances the phase change heat transfer by increasing the net contact area for heat transfer and the number of nucleation or precipitation sites. 116 To roughen the surface, various
mechani-cal methods have been used, such as sandpapering and abrasive blasting. 117 The surface structures obtained are relatively
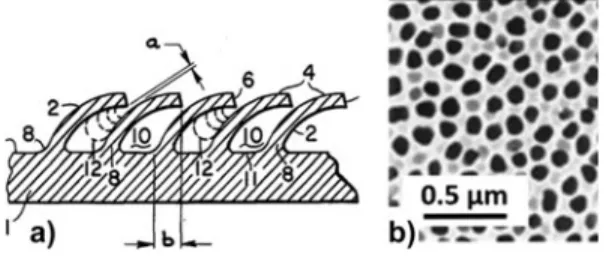
sim-ple, i.e., consisting essentially of low peaks and valleys, and ran-domly distributed. Conventional machining has also been used to obtain more elaborate surface structures aimed specifi cally to enhance nucleate boiling, e.g., Fig. 8(a) . These surface struc-tures show a regular pattern due to the sequential nature of the sharp-tip machining processes. Chemical and electrochemical methods can produce more pronounced and complex structures, such as porous surfaces, e.g., Fig. 8(b) . The surface structures
Figure 8. Examples of surface machining and roughening: (a) machined surface with bent fi ns to enhance nucleate boiling, from patent 118 ; gap a is
in the 25–125 μ m range; (b) electrochemically processed porous alumina (Anodisc TM ).
are randomly distributed, but the roughness parameters (e.g., average pitch, porosity) can be controlled by the processing conditions, such as etchant chemistry, etching time, and cur-rent density. The roughening processes are suitable for large area and mass manufacturing, while the machining processes are less economical. Because of their high thermal conductivity, metallic surfaces are preferable for phase change heat transfer.
Surface coating
Surface textures can be added on the base surface by coat-ing. Compared with the subtractive methods of the previous section, the coated textures can be more complex in geometry and more versatile in material selection. The texture can be as complex as a three-dimensional porous network, and the material can be a metal, ceramic, polymer, or a combination of them. The coating methods are numerous, including sintering, spray coating, dip coating, plasma coating, electroplating, and gluing, just to name a few. For metal oxides, Zhou et al. 119
elec-trodeposited manganese oxide from an ionic liquid to grow a number of different morphologies, including nanoparticles and nanofi bers, on glass substrates. Jiang et al. 120 used a
hydrother-mal process to grow titania nanowire arrays and porous frame-works on titanium substrate. For metals, Dhal and Erb 121
flame-sprayed metal-oxide particles on a metal substrate to form porously interconnected open-cell nucleation sites. Jiang and Malshe 122 electrosprayed cubic boron nitride (cBN)
partic-ulates with sizes smaller than 2 μ m, as shown in Fig. 9(a) , on a tungsten carbide cobalt (WC–Co) substrate. While most methods produced random structures over large areas, Kim and Bergles 123
formed a controlled porous surface by sintering a single layer of large copper particles on a layer of smaller copper particles, as shown in Fig. 9(b) . The large pores formed between the large particles on top were intended to promote boiling nuclea-tion, while the small doubly re-entrant cavities formed between the small particles below were to help preserve the trapped vapor during subcooling and assist the incipient nucleation when reheated. Not limited by the material, You and O'Connor 124
developed a method to glue dispersed particles into highly
porous structures, as depicted in Fig. 9(c) . Because a polymeric material glues the particles together, a wide range of materials can be used as the constituent particles. The resulting porous surface was used to enhance boiling heat transfer for cooling electronics by immersion.
The surface structures made with coating techniques tend to be complex and randomly distributed in size and shape. The size of the structures and the thickness of the coating can vary from a few nanometers to hundreds of micrometers.
Lithographic fabrication
In contrast to the surface roughening and coating processes, which produce mostly a random distribution of certain surface structures and sizes, lithographic processes can produce surface textures of exact shapes and sizes. The lithographic patterns can be at the micrometer scale using standard photolithography or at the nanometer scale using electron-beam lithography. There are other related fabrication methods, such as interference lithogra-phy, but they usually have additional limitations. The patterns may be formed by a lithographic process of photoresist coated on the surface or by direct printing using the so-called soft lithogra-phy. Using the well-defi ned patterns as an etching mask, the sub-strate is carved out by various sophisticated etching processes to create surface textures with depths or heights up to hundreds of micrometer. The etching is usually not performed after soft lithography, which is most convenient when the surface texture is merely a pattern of a thin layer including a chemical coating. Requiring a clean room and expensive equipment, lithographic fabrication is not suitable for large-area applications. However, it provides a unique capability to study the phase change on textured surfaces with sizes and shapes that correspond exactly to the desired designs. Available are a variety of powerful micromachining techniques developed in the fi eld of micro elec-tro mechanical systems (MEMS) as well as conventional micro-fabrication techniques for integrated circuit (IC) manufacturing. The two main shortcomings of lithography are the cost of fabrication and the limited area (i.e., sample size). If accept-able, soft lithography 125 can reduce the cost signifi cantly and
interference lithography 126 can cover a larger area (possibly
several meter 127 ). While silicon is the material of choice for
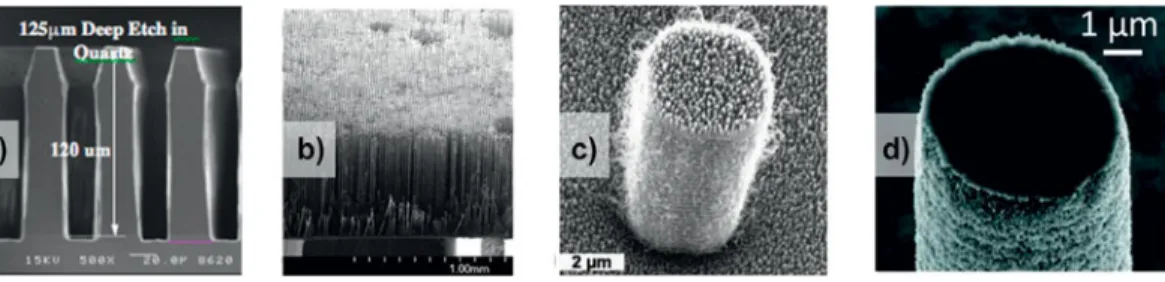
lith-ographic fabrication, other materials such as glass [ Fig. 10(a) ], polymers and metals [ Fig. 10(b) ] can also be processed with reduced capabilities (e.g., limited etching depth for glass) or with additional steps (e.g., molding step for metals).
Multiscale surface textures
Surface textures featuring multiple length scales are called multiscale or hierarchical 130 ; several such textures are reviewed
by Lu and Kandlikar. 131 For example, a surface of interest may
have millimeter scale features, whose surfaces are covered with microstructures, whose surfaces are covered with nanostruc-tures, as shown in Figs. 10(c) and 10(d) . After fabricating the post structure by silicon deep reactive ion etching, nanoscale roughness was formed by depositing carbon nanotubes to study DwC [ Fig. 10(c) ]. 15 A similar result has been obtained by
Figure 9. Examples of surface coatings: (a) SEM image of an electrospray boron nitride coating, reprinted from Ref. 122 , copyright 2011, with permission from Elsevier. (b) Cross-sectional SEM picture of a controlled porous surface fabricated by sintering copper particles of increasing diameters on a copper substrate to study incipient boiling, reprinted from Ref. 123 , permission requested from Hemisphere Publishing. The large particles on top are ∼ 250 μ m in diameter. (c) Schematic of a porous surface obtained by gluing particles for electronics cooling, from US patent. 124
a galvanic displacement process 129 but with an additional level
of sophistication by nanostructuring either all surfaces or all except the top surface of the microstructures [ Fig. 10(d) ]. 128 If
the nanoscale roughness was desired only on the side surfaces of the posts, a masking step was added to protect the top sur-faces of the posts from the roughening step. Recently, biotem-plates have been used to fabricate multiscale surfaces. 132
As a summary, Table 2 reviews all the processing methods by category and mentions the distribution, size, and shape of the patterns as well as the suitable material and scale of application.
Wettability engineering
Wettability describes the spreading of a liquid on a surface. Wettability engineering is important in, e.g., the automotive industry for repelling water from windshields or paints, 136
preventing fouling, 137 and reducing friction in moving parts 138 ;
in the marine industry to prevent fouling 139 ; in the electric
power industry to prevent fouling on solar cells 140 ; in biology to
prevent bacterial contamination, 141 , 142 and in the electronic 143
and chemical industries. 144
The wettability of a surface can be modifi ed by engineering its texture and (or) its chemistry. A first characterization of wettability is the static wetting of liquid droplets on flat sub-strates. 145 – 147 Figure 11 shows the possible wetting regimes
of sessile droplets on a substrate, where θ E is Young's contact
angle, and the spreading parameter S is defi ned as
D = σ − σ + σDG
(
D= =G)
(10)where σ SV , σ SL , and σ LV are the surface tension at the solid/
vapor, solid/liquid, and liquid/vapor interfaces, respectively. 146
When S > 0, a liquid droplet will completely (or perfectly) wet the substrate (i.e . , θ E = 0°) to form a liquid fi lm with nanoscale
thickness. This property is typically obtained on surfaces that have high values of σ SV (≈500–5000 mN m −1 ), e.g., metals. 146
When S < 0, a liquid droplet will partially wet the substrate forming a nonzero contact angle (i.e., θ E > 0°). When θ E ≤ 90°
a substrate is called wetting or – in the special case of
water – hydrophilic. When θ E > 90° a substrate is called
nonwet-ting or – in the special case of water – hydrophobic. This hydro-phobic regime is usually observed on substrates which have lower values of σ SV ( σ SV ≈ 10–50 mN m −1 ), e.g., plastics. 146 By
balancing the horizontal projections of capillary forces at the triple contact line, Young 148 and Dupré 149 thereafter obtained
R^bθ = σ − σ6
<
DG D=>
σ=G (11) From Eq. (11) , θ E is a function of the liquid, solid, and vaporproperties, so that a surface which is nonwetting to a liquid may be wetting to another.
Thereafter, Wenzel 150 and Cassie and Baxter 151 described
how surface texture infl uences wettability, see Fig. 11 . Wenzel assumed that the droplet completely wets the rough surface whereas Cassie and Baxter stated that air was trapped in the rough solid–liquid interface. Later, 152 it was shown that both
states could be obtained, depending on the scale of the rough-ness. Wetting states intermediate between the Cassie–Baxter and Wenzel states have also been reported. 153 – 155 The apparent
contact angle ( θ *) of a liquid droplet in a Wenzel wetting state can be defi ned as
R^b aR^b 6
∗
θ = θ (12)
with r being the roughness, defined as the ratio of the true surface area to the projected surface area. For the hydropho-bic case ( θ E > 90°), the Cassie–Baxter case is preferred to the
Wenzel state if θ E is larger than a critical angle θ C , with
(
) (
)
θ = Φ −4 D − ΦD
R^b r a , where Φ S is the solid–liquid fractional
surface area, and the value of the apparent Cassie–Baxter con-tact angle is 146
R^bθ = − + Φ∗ r D
(
R^bθ +6 r )
(13)For the hydrophilic case ( θ E < 90°), the Cassie–Baxter
case is pre ferred to the Wenzel state if θ E < θ C , with
(
) (
)
4 D D
R^bθ = r− Φ a− Φ , and the value of the apparent Cassie– Baxter contact angle is
R^bθ = + Φ r D
(
R^bθ −6 r )
(14)Figure 10. Examples of photolithographic processes to create high aspect ratio geometries and multiscale features on solid surfaces. (a) Cross-sectional SEM picture of glass surface textures fabricated by photolithography and deep reactive ion etching on a glass (quartz) substrate. (b) SEM picture of a dense array of 600 μm-tall freestanding Ni posts (diameter = 5 μ m; pitch = 14 μ m; height-to-diameter aspect ratio = 120) fabricated by electroplating into deep pores formed by photoelectrochemical etching on silicon wafer. Copyright 2011, IEEE. Reprinted with permission from Ref. 128 . (c, d) Microscale posts covered with nanoscale features. Figures are reprinted from Refs. 15 and 129 with the permissions of AIP Publishing LLC (Copyright 2007) and the American Chemical Society (copyright 2011), respectively.
Table 2. Microfabrication techniques available for phase change heat transfer applications.
Category
Processing
type
Fabrication
method
Distribution of
the patterns
Shapes
(and size)
Suitable
scale of the
application
Material
Roughening
or machining
Subtractive
Sandpapering,
sandblasting
Random
Random ( μ m)
Large
(mass
production)
Copper
117Machining Regular
Controlled
( μ m to mm)
Medium
Metal
118Chemical,
electrochemical
Random
Controlled
(10–200 nm)
Medium
Alumina
(Anodisc™)
Coating Additive
Sintering
Random
Complex
( μ m to mm)
Large
Oxide particles
121;
Copper particles
on copper
123Electrospraying Random
Random
and complex
Medium
cBN particles
on XC–Co
122Gluing Random
Controlled
(1 μ m to
∼ 100 μ m)
Large
Metal or ceramic
particles
124Lithographic
fabrication
Additive
or subtractive
Photolithography,
e-beam
lithography
Regular
Controlled
(nm to
∼ 100 μ m)
Small
Si pillars on Si
133;
metal pillars
on Si
128Interference
lithography
Regular
Controlled
(100 nm to
∼ 1 μ m)
Medium
Si pillars on Si
134;
Ti, Al and Au
pillars on glass
135For hydrophobic surfaces, the more enhanced the surface texture is the more probable the Cassie-Baxter state. When θ * > 150°, the solid surface is said to be superhydrophobic . In general, roughness tends to increase θ * on a hydrophobic surface and the likelihood of a superhydrophobic wetting state ( θ * → 180°). Reciprocally, the superhydrophilic wetting state ( θ * → 0°) is also observed by roughening an originally hydrophilic substrate. 146 Note that superhydrophilicity is
some-times also associated with a fast spreading. 156 As it relates to
phase change heat transfer, the Cassie–Baxter wetting state plays an important role in enhancing DwC behavior 157 and
stabilizing Leidenfrost vapor layers. 158
In addition to these considerations, it is important to add that roughness influences both the static contact angle and the so-called contact angle hysteresis (difference between the advancing and receding values). In the classic experi-ment of Johnson and Dettre, 159 advancing and receding
con-tact angles were measured as a function of the roughness of a wax sample with constant chemical properties. The main outcome of this experiment was that an increase in the
roughness caused an increase of the advancing contact angle and a decrease of the receding angle (increase of the hystere-sis) until a saturation value. At this point, the hysteresis dras-tically decreased and the receding angle became closer to the advancing contact angle. Texturing the surface appears consequently as an efficient strategy to change the wetting behavior. 146 It is interesting to note that droplets on
superhy-drophobic surfaces in the Cassie–Baxter state have a low con-tact angle hysteresis. In many cases, though not all (see rose petal effect ), superhydrophobic surfaces characteristically have low contact angle hysteresis; this leads to drops having low sliding angles and ultimately self-cleaning behavior (slid-ing angle < 10°; lotus effect ). A small hysteresis has been pro-posed to be a necessary condition to the superhydrophobicity of a surface. 147 Tilting the surface will result in a rolling
motion of the droplet, as shown experimentally. 160 , 161 The
sliding or roll-off angle has significance in condensation pro-cesses as it plays a role in removing (also called shedding) droplets of condensate, 154 see section “Engineered surfaces