HAL Id: hal-00296325
https://hal.archives-ouvertes.fr/hal-00296325
Submitted on 5 Sep 2007
HAL is a multi-disciplinary open access
archive for the deposit and dissemination of
sci-entific research documents, whether they are
pub-lished or not. The documents may come from
teaching and research institutions in France or
abroad, or from public or private research centers.
L’archive ouverte pluridisciplinaire HAL, est
destinée au dépôt et à la diffusion de documents
scientifiques de niveau recherche, publiés ou non,
émanant des établissements d’enseignement et de
recherche français ou étrangers, des laboratoires
publics ou privés.
uncertainties in global modelling
H. Tost, P. Jöckel, J. Lelieveld
To cite this version:
H. Tost, P. Jöckel, J. Lelieveld. Lightning and convection parameterisations ? uncertainties in global
modelling. Atmospheric Chemistry and Physics, European Geosciences Union, 2007, 7 (17),
pp.4553-4568. �hal-00296325�
www.atmos-chem-phys.net/7/4553/2007/ © Author(s) 2007. This work is licensed under a Creative Commons License.
Atmospheric
Chemistry
and Physics
Lightning and convection parameterisations – uncertainties in
global modelling
H. Tost, P. J¨ockel, and J. Lelieveld
Atmospheric Chemistry Department, Max Planck Institute for Chemistry, P.O. Box 3060, 55020 Mainz, Germany Received: 13 April 2007 – Published in Atmos. Chem. Phys. Discuss.: 21 May 2007
Revised: 14 August 2007 – Accepted: 17 August 2007 – Published: 5 September 2007
Abstract. The simulation of convection, lightning and
con-sequent NOx emissions with global atmospheric chemistry
models is associated with large uncertainties since these pro-cesses are heavily parameterised. Each parameterisation by itself has deficiencies and the combination of these substan-tially increases the uncertainties compared to the individ-ual parameterisations. In this study several combinations of state-of-the-art convection and lightning parameterisations are used in simulations with the global atmospheric chem-istry general circulation model ECHAM5/MESSy, and are evaluated against lightning observations. A wide range in the spatial and temporal variability of the simulated flash densities is found, attributed to both types of parameteri-sations. Some combinations perform well, whereas others are hardly applicable. In addition to resolution dependent rescaling parameters, each combination of lightning and con-vection schemes requires individual scaling to reproduce the observed flash frequencies. The resulting NOx profiles are
inter-compared, however definite conclusions about the most realistic profiles can currently not be drawn.
1 Introduction
Lightning represents one of the most energetic phenomena in the Earth’s atmosphere. In the troposphere flashes are the only natural process that can break up the highly stable triple bonds of molecular nitrogen, transforming N2into reactive
nitrogen species which strongly influence the chemistry of the upper troposphere (e.g. Labrador et al., 2005; Schumann and Huntrieser, 2007, and references therein). Therefore, an accurate representation of lightning in global models of the atmosphere is crucial. Additionally, lightning represents an
Correspondence to: H. Tost
important factor in the ignition of wild fires (e.g. Jacobson, 2002).
In contrast to small scale process models (e.g. Barthe et al., 2005) atmospheric chemistry general circulation mod-els (AC-GCMs) generally do not represent the global electri-cal circuit, e.g. the electrielectri-cal field and the detailed processes involved in cloud electrification and discharges. Instead the lightning and the subsequent NOxformation are determined
with the help of (semi-)empirical parameterisations. Since it is difficult to measure such emissions in situ or by remote sensing, there is a high uncertainty in the total amount of NOx globally produced by lightning, i.e. ranging from 2 to
8 Tg N/yr (e.g. Schumann and Huntrieser, 2007).
The occurrence of flashes on the other hand can be ob-served from satellites, e.g. the LIS/OTD missions (Christian et al., 1999, 2003; Thomas et al., 2000), and an extensive cli-matology has been established over the last decade and has been used for comparisons with parameterisations. Even if the occurrence of flashes could be predicted accurately by the model, uncertainties in the NOxemissions remain, since
the amount of NOxproduced per flash is not a constant. It
varies with flash strength, extension, type, branching, and additional aspects. The amount of NOxper flash in a
“typ-ical thunderstorm” varies by more than an order of magni-tude ((2−40)×1025NO molecules per flash, Schumann and Huntrieser, 2007). Nevertheless, the accurate prediction of flash occurrence is a prerequisite to estimate lightning pro-duced NOxemissions in the upper troposphere.
A problem with most parameterisations (some will be de-scribed in detail below) is that they are mainly derived em-pirically from correlations between other observable quan-tities. However, their applicability to the global scale and extended time periods of several years is limited since the heterogeneity of phenomena can only be represented approx-imately. Nevertheless, these parameterisations are used in global AC-GCMs since the assimilation of observed flashes at every model time step is computationally not feasible and
not necessarily consistent with the desired occurrence of con-vection in the model. Furthermore, for the calculation of future scenarios such techniques are not applicable and the lightning has to be parameterised.
Petersen and Rutledge (1998) found a relationship be-tween convective precipitation and lighting with the goal to estimate the rain rate from observed flashes. Even though a precipitation estimate can be made from lightning events, this study concludes that this is only valid for long-term av-erages, and not to individual precipitation and related light-ning events (Petersen and Rutledge, 1998). Further studies of Petersen et al. (2005) combining satellite observations of precipitation ice water content and flashes show that the cor-relation of these two parameters can be applied globally, al-most for individual events, but unfortunately convection pa-rameterisations include too strongly simplified cloud micro-physics so that the ice water content is difficult to determine accurately. Therefore, the implementation of a lightning pa-rameterisation for GCMs based on the ice water content is not straight-forward.
On the other hand, the simulation of lightning based on convection parameterisations offers the possibility to investi-gate how realistic these schemes describe the processes. In a previous study (Tost et al., 2006) we analysed convection on a global scale with respect to temperature and the hydrologi-cal cycle using several convection parameterisations, but did not discuss the convective dynamics, e.g. the convective mass fluxes. With the help of the updraft based lightning schemes (details below), the updraft strength can be correlated to the observable quantity of flashes.
The next section introduces the model and the parameter-isations used, Sect. 3 the simulation setup, Sect. 4 presents the analysed results, and the conclusions are given in Sect. 5.
2 Model description
In this study the AC-GCM ECHAM5/MESSy (E5/M1) (J¨ockel et al., 2006) has been applied. It is based on the general circulation model ECHAM5 (Roeckner et al., 2006) (version 5.3) and the Modular Earth Submodel Sys-tem (J¨ockel et al., 2005) (version 1.3).
Most of the meteorological processes are calculated by ECHAM5 based on a spectral representation of the prog-nostic variables vorticity, divergence, temperature, and the logarithm of the surface pressure, as well as grid point repre-sentations of specific humidity, cloud water, and cloud ice. In the vertical a hybrid pressure coordinate system is ap-plied. The processes of radiation and cloud microphysics are parameterised, as described in the ECHAM5 documentation (Roeckner et al., 2003, 2004).
Additionally, the MESSy infrastructure and some of the submodels, i.e. an extended convection submodel (Tost et al., 2006) containing additional parameterisations, an extended lightning NOxemission submodel (LNOX) and the
diagnos-tic tropopause and planetary boundary layer height submodel (TROPOP) have been used. The output frequency for the lightning and convection data for this study is set to hourly average values, and to six hourly averages for the other me-teorological data.
2.1 Convection parameterisations
The convection parameterisations included in the CON-VECT submodel are:
– The Tiedtke (1989) scheme with modifications by
Nor-deng (1994) (further denoted as T1). This scheme is used as the default convection parameterisation.
– The convection parameterisation of the operational
ECMWF model (IFS cycle 29r1b (Bechtold et al., 2004, and references therein), denoted as EC), which is a fur-ther development of the Tiedtke (1989) scheme;
– The Zhang-McFarlane-Hack scheme (Zhang and
Mc-Farlane, 1995; Hack, 1994) (ZH) as applied in the MATCH model (Rasch et al., 1997; Lawrence et al., 1999) and a version with an extended evaporation scheme (Wilcox, 2003), denoted as ZHW;
– The scheme of Bechtold et al. (2001), denoted as B1.
For a more detailed comparison of these schemes, their de-tailed configurations and extensions, and their influence on the hydrological cycle we refer to Tost et al. (2006) and Tost (2006).
2.2 Lightning parameterisations
The LNOX submodel applied in this study encompasses the widely used lightning NOx parameterisation by Price and
Rind (1992) with further updates (Price and Rind, 1993, 1994; Price et al., 1997a,b) based on the correlation between the convective cloud top height (in the model determined as the altitude of the top level, in which a convective updraft mass flux is calculated) and the occurrence of flashes derived from regional observations (P cth):
Fc=3.44 × 10⁻⁵·H4.90 (1)
Fo=6.40 × 10⁻⁴·H1.73,
with Fcrepresenting the continental and Fothe oceanic flash frequencies and H the convective cloud top height in kilome-tres above ground. For each grid box the total flash frequency is determined with the fractional land-sea mask.
In addition, the parameterisation by Grewe et al. (2001) is included, linking updraft velocity as a measure of convective strength and associated cloud electrification with the flash frequency (G updr):
d = cloud topX i=cloud bottom hi w = cloud topX i=cloud bottom Mi ρi · hi d .
F is the flash frequency, w the updraft velocity, hi the grid box height, d the cloud thickness, Mi the updraft mass flux and ρi the air density. Note that there is no differentiation between land and sea, assuming that the weaker intensity of convection (and consequently less intense cloud electrifica-tion) over the ocean is represented adequately by the convec-tion parameterisaconvec-tion.
Allen and Pickering (2002) propose two additional poly-nomial parameterisations for lightning occurrence, one also based on the updraft strength at a specific altitude (A updr): Fcg=a + b · M+c · M2+d · M3+e · M4, (3) and another on the amount of convective precipitation at the surface (A prec):
Fcg=ai+bi ·P +ci·P2+di·P3+ei·P4 (4) with M the updraft mass flux at an altitude of 0.44σ1, and P the convective precipitation at the surface (only for precipita-tion stronger than 7 mm/day). The parameters2are constants taken from Allen and Pickering (2002) without any modifi-cations, considering the lightning scheme was proposed as a scheme for global models.
For the total flash frequency (over both land and ocean) calculated with the A prec scheme a weighting with the frac-tional land-sea mask has been applied (similar to the P cth scheme). Note that these polynomial parameterisations de-termine the cloud-to-ground flashes (Fcg) only, whereas the first two approaches give the total flash frequency (cloud-to-ground and in-cloud). Nevertheless, with the help of the re-lationship between cloud-to-ground and total flash frequency by Price and Rind (1993), for all four schemes the total amount of flashes and the fractionation into cloud-to-ground and in-cloud can be determined.
The amount of NOx emitted by lightning is
cal-culated using a number of 6.7×1026molecules/flash (≈15.6 kg N/flash) for cloud-to-ground flashes. The ratio of NOx production by IC flashes is lower by a factor of 0.1.
Both these numbers are uncertain, but are within the range proposed by Schumann and Huntrieser (2007).
1In this case σ is the ratio between pressure and surface pressure. 2The index i in Eq. (4) represents land (l) or ocean (o), the
val-ues are as follows: a=−2.34E−2, b=3.08E−1, c=−7.19E−1,
d=5.23E−1, e=−3.71E−2 and al=−3.75E−2, bl=−4.76E−2,
cl=5.41E−3, dl=3.21E−4, el=−2.93E−6, and ao=−5.23E−2,
bo=−4.80E−2, co=5.45E−3, do=3.68E−5, eo=−2.42E−7; the corresponding units are chosen such that after the multiplica-tion with the respective quantity the unit of a flash frequency (1/s) is achieved.
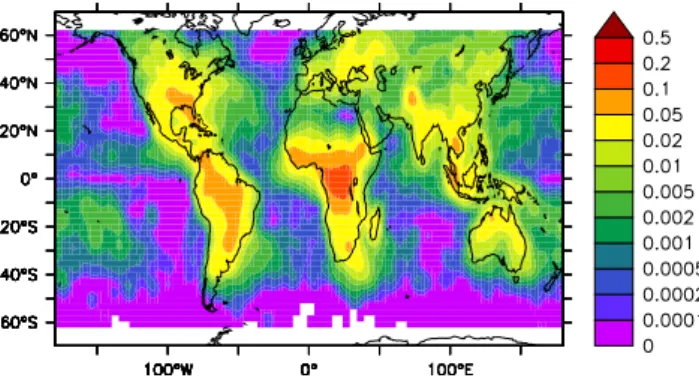
Fig. 1. Observed annual average flash density in flashes/(km2day) for the year 1999 from LIS/OTD data from 60◦S to 60◦N.
3 Simulation setup
A set of five simulations has been performed with a hori-zontal resolution of T42 (≈2.8◦×2.8◦of the corresponding quadratic Gaussian grid) and 31 layers in the vertical direc-tion (the midpoint of the uppermost layer is at 10 hPa). In each simulation all four lightning parameterisations are ap-plied simultaneously and the emitted NOx is vertically
dis-tributed according to a parameterisation of Pickering et al. (1998). Horizontal resolution dependent scaling factors for the flash densities have been applied as proposed in the original articles describing the lightning parameterisation schemes. The individual simulation setups differ only with respect to the convection scheme selected via a namelist. Consequently, all simulations have been performed with the same executable. Because of the feedback of the convection on the atmospheric dynamics, the meteorology is different for each simulation.
The simulation has been performed for the year 1999, with several months of model spin-up. To overcome the issue of different meteorology in the various simulations the “nudg-ing” (Newtonian relaxation) technique (Jeuken et al., 1996; van Aalst et al., 2004; J¨ockel et al., 2006) with ECMWF operational analysis data of vorticity, divergence, tempera-ture and surface pressure for the year 1999 is applied in the free troposphere with a similar nudging profile as in J¨ockel et al. (2006). Even though the influence of the nudging is relatively small (the nudging coefficients are comparable to J¨ockel et al., 2006), it is sufficient to achieve similar meteo-rological patterns as observed in this specific year.
4 Results
Observational datasets
Observed lightning data is used from the LIS (Christian et al., 1999; Thomas et al., 2000) and OTD (Christian
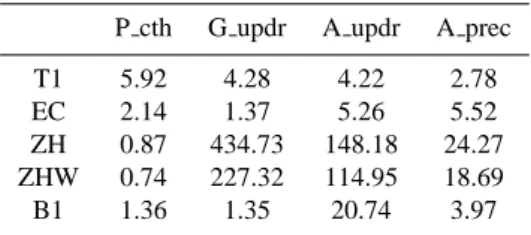
Table 1. Scaling factors for the combination of lightning and
con-vection parameterisations.
P cth G updr A updr A prec T1 5.92 4.28 4.22 2.78 EC 2.14 1.37 5.26 5.52 ZH 0.87 434.73 148.18 24.27 ZHW 0.74 227.32 114.95 18.69 B1 1.36 1.35 20.74 3.97
et al., 2003) satellite instruments3. In this study the grid-ded products of the time series for the year 1999 (LIS-TOTD LRTS V2.2) are applied as well as annual and daily climatologies (LISTOTD HRADC V2.2 at high (0.5◦) and LISTOTD LRADC V2.2 at low (2.5◦) resolution).
Additionally, satellite data from the Tropical Rainfall Measuring Mission (TRMM) (Kummerow et al., 2000), i.e. the 3A25 and the 3B42 products4, are used for the compari-son of lightning data with observed convective cloud prop-erties (convective precipitation, cloud top height, i.e. the convective storm height). This is suitable since all satellite products are obtained from the same orbital platform. Even though the observations are also associated with uncertain-ties (Christian et al., 1999; Thomas et al., 2000; Christian et al., 2003) resulting from the sampling frequency, group-ing of flashes, a bias of the sensor, etc., in this study these factors are ignored and the measured data is treated as being accurate.
4.1 Annual average lightning distributions
Figure 1 shows the annual average flash density for the year 1999 taken from the long-term time series of ob-served flashes from combined LIS and OTD data, i.e. the LISOTD LRTS V2.2 dataset. The displayed region is re-stricted to 60◦S to 60◦N because of the viewing angle of the satellite. The observed maxima occur over the continents, especially in Central Africa, with secondary maxima over South America and the islands of the maritime continent. Note that the colour scale of Fig. 1 is logarithmic, because of the large contrast in flash densities over the continents and the oceans.
Figure 2 shows the simulated flash densities with the different convection and lightning parameterisations. The colour scale is identical to that of Fig. 1. However, the sim-ulated flash frequency had to be rescaled with the average number of flashes per second over the globe (48.81 flashes/s
3Obtained from the Global Hydrology Resource Centre: http:
//thunder.msfc.nasa.gov/data/.
4Monthly mean gridded data (3A25) and 3 hourly gridded
pre-cipitation (3B42) from the prepre-cipitation radar, a 13.8 GHz radar, one of three rain instruments on board the TRMM satellite, with the pos-sibility to retrieve three-dimensional precipitation characteristics.
for the year 1999, regridded on the model coordinates, from 60◦S to 60◦N). The scaling factors for the different model setups are listed in Table 1.
This scaling, in addition to the resolution dependent rescaling mentioned above in the formulation of the lightning parameterisation, is needed for comparison and forces the re-sults into the observed range. These scaling factors differ by almost three orders of magnitude, showing the large varia-tion of the input data from the different convecvaria-tion schemes for each of the lightning parameterisations.
Using the P cth parameterisation based on the convective cloud top height (Eq. (1), first column of Fig. 2) all simula-tions show the strong contrast between ocean and land. How-ever, the oceanic flash densities are systematically too low by approximately a factor of 1.5 to 10, independent of the choice of the convection scheme5. This originates from the weaker exponential dependency of the cloud top height and the cal-culated flash frequency (compare Eq. 1). Consequently, the continental flash densities are overestimated. The maximum values occur mainly over South America, whereas the high flash densities over Africa are captured only with the ZH, the ZHW and the B1 simulation (lower three panels of the first column). The other simulations show lower average cloud top heights over Central Africa mainly caused by a lower number of convective lightning events in that region. Except for the EC simulation the simulated lightning activity over the maritime continent is substantially overestimated. Since the cloud top height does not differ significantly between land and sea grid cells in that region, this is a result of the different treatment in the P cth convection parameterisation. Over the tropical oceans the ZH and ZHW simulation are characterised by substantially higher cloud top heights com-pared to the other simulations. From the parameterised flash frequencies this is not obvious, since the oceanic flash fre-quency shows a lower dependence with the vertical extension of the cloud, as mentioned above. The annual average cloud top height (mean over convective and non-convective cases) is lowest in T1, slightly higher in EC and B1 and highest in ZH and ZHW. This results partly from deeper convection (as analysed in Tost, 2006), but also in the frequency of lightning producing convective events: in the ZH and ZHW simulation in the tropics the convection scheme triggers lightning activ-ity in 60% to 100% of the time due to the high convective cloud tops. This is caused by the too frequent activation of the adjustment scheme of Hack (1994) of the ZH convec-tion parameterisaconvec-tion (compare Tost et al., 2006). This value is much lower for the other three model configurations (T1, EC, and B1). In the midlatitudes of the northern hemisphere the simulated flash density in all simulations is lower than observed, most pronounced in the southern part of the USA,
5The average values of the ratio ff
sim/ffobsover the ocean for
T1 are ≈0.54, for EC ≈0.46, for ZH and ZHW ≈0.79, and for B1≈0.37, but local differences can be substantially larger.
Fig. 2. Simulated annual average flash densities from 60◦S to 60◦N in flashes/(km2day). The rows represent the different convection schemes (T1, EC, ZH, ZHW, B1 from top to bottom), whereas the columns depict the different lightning parameterisations (P cth, G updr, A updr, A prec from left to right).
caused by too low lightning activity during the boreal winter months.
The updraft based lightning parameterisation of Grewe et al. (2001) (Eq. (2), second column of Fig. 2) overestimates the lightning activity over the oceans compared to the ob-servations. The too high flash frequencies result from the similar strength of the convective mass fluxes over ocean and land and not – as required by the basic assumptions of the lightning scheme – from less intense convective activity over the ocean. This is a general weakness of convective bulk mass flux schemes (it appears in all five simulations) that only compute mean updraft mass fluxes for the whole grid cell. These schemes consequently cannot differentiate be-tween strong convection over a small (subgrid-scale) area and weak convection over a large (subgrid-scale) area. To
overcome this weakness of the convection schemes in the lighting parameterisation different parameters should be cho-sen for land or ocean grid boxes. However, using the un-modified scheme of Grewe et al. (2001) without differentia-tion between ocean and land the overestimadifferentia-tion must be at-tributed to the convection parameterisations. In combination with the T1 and EC convection schemes the simulated flash density generally represents the observed patterns except for the overestimation over the tropical oceans. Furthermore, the African maximum is underestimated. The T1/G updr com-bination (second panel in the first row) yields only slightly lower values in the southern USA than observed, whereas in Siberia the occurrence of flashes is significantly under-estimated. The simulations with the ZH and ZHW convec-tion schemes are characterised by significant lightning in the
midlatitude storm tracks, with an almost negligible land-sea contrast, and stronger differences over land and sea in the tropics and subtropics. The first aspect is likely caused by the activation of the Hack (1994) convective adjustment that is part of the ZH and ZHW convection scheme, leading to more convective activity and less large-scale clouds. The second aspect is caused by the less frequent triggering of the deep convection part (Zhang and McFarlane, 1995) over the oceans. In some regions, especially over mountain slopes (Himalaya, Andes) very high flash densities are calculated. The latter effect results mainly from the convection scheme which computes high convective mass fluxes in these loca-tions (orographically forced convection). The combination of the B1 convection with the G updr lightning results in very spotty flash occurrences, which do not reproduce the observed flash distribution well. This is caused by rare, un-realistically strong convective updraft events, produced by the Bechtold et al. (2001) convection scheme. Consequently, due to the strong exponential dependency of the lightning frequency on the vertical velocity, this yields overestimated flash densities. Applying the same mass fluxes with the A updr scheme (using the updraft strength at 0.44 σ , i.e. approx. 500 hPa) these spikes do not occur (compare third panel of the last row). This indicates that the intense flash frequencies are likely caused by the occurrence of unrealisti-cally strong shallow convection that affects the mean vertical velocity (according to Eq. 2c) within the clouds. The overall flash frequency with this lightning parameterisation is lower than with the P cth approach in combination with all con-vection schemes (highest values still with ZH and ZHW over the continents), but the differences in the number of lightning events between the simulations are smaller.
Using the polynomial function of updraft for the flash fre-quency (A updr, Eq. 3), the lightning over the ocean is even more strongly overestimated as with G updr, and the con-tinental maxima are substantially underestimated when it is applied in combination with the T1 and EC convection (up-per two panels of the third row of Fig. 2). Furthermore, the extratropical continental lightning density is too low. In com-bination with the ZH and ZHW convection a similar distribu-tion as with the G updr occurs with the maxima at the same locations, however, not capturing the observed ones, espe-cially over the continents. This cannot be attributed to shal-low convection, but rather to the total number of convective events which produce lightning. Moreover, the updrafts in the middle and upper troposphere are substantially weaker compared to the other convection schemes, which leads to the high rescaling factors for these combinations (Table 1). Yet they are more widely distributed over large regions. As mentioned above, the strong activity in the storm tracks re-sults from the setup of the convection parameterisation, i.e. the too frequent activation of the Hack (1994) convective ad-justment instead of the deep convection of Zhang and Mc-Farlane (1995). This results in the overestimation of the convection activity (compare Tost et al., 2006). In contrast,
the combination with the B1 convection results in a much smoother lightning distribution. The absolute maximum in Central Africa is shifted too far northward, and the flash den-sity is overestimated over the tropical oceans, while localised events such as with G updr do not occur if the mass flux at about 500 hPa is used to determine the number of flashes. The resulting flash densities of the A updr lightning param-eterisation show some similarities with respect to the global annual average distribution with the T1, EC and B1 convec-tion. Consequently the typical features, i.e. the overestima-tion over the ocean and underestimaoverestima-tion of the continental maxima are likely to be attributed to the lightning scheme.
The precipitation based approach of Allen and Pickering (2002) (A prec, Eq. 4) combined with the T1 convection (up-per panel in the last row) does not reproduce the observed land-sea contrasts similarly to the T1/A updr setup. The maximum in Central Africa is underestimated as well as the flash densities in Europe, North America and Siberia. On the other hand, the values in the ITCZ over all oceans, the warm pool region and the SPCZ are overestimated by a factor of 5 to 10 resulting from an overestimated convective precipi-tation yield (Tost et al., 2006). In combination with the EC convection scheme the oceanic flash density is overestimated compared to the observations, but less significantly than with the T1/A prec approach. The lower oceanic lightning activ-ity results from the lower total amount of convective pre-cipitation produced in this regions than with T1 (compare Tost et al., 2006). In South America slightly higher values than observed are simulated, and the maximum over Central Africa is poorly reproduced. Similarly to T1, the occurrence of lightning in the continental midlatitudes of the Northern hemisphere is underestimated, since the contribution of con-vective precipitation during frontal passages is too low, i.e. the midlatitude precipitation associated with frontal nimbo-stratus is not mainly produced by the convection but by the large-scale condensation scheme in these two model configu-rations. The ZH and ZHW convection schemes, which yield a strong difference between precipitation over land and sea (Tost et al., 2006), capture the distribution slightly better, but strongly overestimate the flash frequency over the tropical continents (especially ZH). On the other hand, in the midlat-itudes continental lightning is underestimated, although the differences to the observations are lower than with the other convection schemes. However, since the precipitation dis-tribution of neither ZH and ZHW does correspond well to the observations (Tost et al., 2006), a better agreement with the observed flash densities is likely the result of compensat-ing “misconceptions” in both lightncompensat-ing and convection pa-rameterisations. The combination of B1 and A prec results in a more realistic distribution of the annual average flash density. Even though the maximum over Central Africa is underestimated, and the values over the tropical oceans are overestimated, the general patterns are captured quite well (comparable to the T1/G updr combination) without any ex-treme values over specific locations. This is a direct result
Fig. 3. Taylor diagram for the various combinations of
convec-tion and lightning schemes compared with LIS/OTD data, showing the spatial standard deviation of the calculated flash densities nor-malised with the standard deviation of the observations σ⋆(on the radial axis), the spatial correlation R (the angle) and the correspond-ing RMSE (distance from the point marked with the open box with correlation of one and normalised standard deviation of one). The different convection schemes are depicted by the colours, and the lightning parameterisations by the symbols.
of the relatively good agreement between the simulated and observed precipitation patterns.
A statistical comparison of the observed and simulated annual average flash densities is shown in the Taylor dia-gram in Fig. 3 (Taylor, 2001). In combination with the P cth scheme the overall performance of all convection schemes is very similar (all “X”s are closely together, the green and the red ones overlay). This indicates a very robust behaviour of this approach: even though the cloud top height differs and depends on the scheme, the average distribution agrees well in all simulations. The correlation (R≈0.75 to 0.8) is highest for these combinations, but the spatial variation is slightly overestimated (σ⋆≈1.2 to 1.4 with σ⋆=σsim/σobs).
The rescaling factors of Table 1 therefore result mainly from the different frequencies of lightning producing convective events, which is much higher in case of the ZH and ZHW convection schemes. The T1/G updr combination achieves a similar spatial correlation, and the lower σ⋆ indicates an even better performance in this simulation setup. However, this approach is not working well with the other convection parameterisations since it is highly dependent on the vertical updraft velocity and easily deteriorated by less realistic con-vective dynamics. While R is much lower for EC/G updr, σ⋆
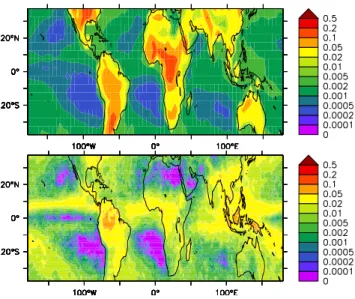
Fig. 4. Parameterised annual average flash density (in flashes/(km2
day)) calculated from TRMM monthly mean cloud top height data for the year 1999, applying the P cth scheme (upper panel) and cal-culated from TRMM 3 hourly precipitation data using the A prec parameterisation (lower panel). The lightning activity has been rescaled to the observations (see text).
is close to one, whereas the symbols for ZH, ZHW and B1 are out of scale (σ⋆>2). The polynomial function of light-ning and mass fluxes at about 500 hPa is slightly more robust, but shows a large scatter in combination with the convection parameterisations. None works as well as the P cth approach with respect to both spatial correlation and variation. The precipitation based approach underestimates the spatial vari-ation for T1, EC, and B1, but overestimates it for ZH and ZHW. This results from the disagreement of the precipitation distributions with the observations of the latter two schemes (Tost et al., 2006). Especially the combination B1/A prec works almost as well as T1/G updr in capturing the observed flash density distribution.
4.2 Applicability of lightning parameterisations
To check the applicability of the lightning parameterisations monthly mean values for the convective storm height6 be-tween 40◦N and 40◦S are used with the P cth scheme as depicted in the upper panel of Fig. 4.
Using the cloud top based parameterisation with the ob-served cloud top heights (5 and 0.5 degree resolution) and applying a similar rescaling (for the high resolution data fig-ure not shown) the maximum in Central Africa is well re-produced with respect to shape, position and strength for the low resolution data (for the high resolution data, the maxi-mum is located too far northward), whereas in the northern
6Data from the TRMM 3A25 data set, derived from the
part of South America lower values than observed are calcu-lated. Additionally, the highest flash occurrences over South America are shifted southward and to the Andes. In North America the highest flash density is not calculated only in the Southeast, but also more to the West. In Indonesia, flash rates similar to the observed are calculated from the observed cloud top height. The flash densities over the ocean are much smaller than over the continents, in agreement with the ob-served land-sea contrast. Even though high cloud top heights in the Himalaya region are observed from TRMM, the re-sulting flash densities are relatively low due to the high sur-face elevation which leads to a smaller vertical extension of the cloud (maximum vertical extension of the cloud = cloud top height – surface elevation height). The land-sea contrast and the main features of the spatial distribution can be repro-duced with these calculations. However, the correlation of the observed flash densities with the calculated flash densi-ties from the observed cloud top heights are similar to those of the model results, with R=0.74 for the low resolution and R=0.69 for the high resolution TRMM convective cloud top height data. Since the correlation of the calculated flashes from the simulated and observed cloud top heights are simi-lar, this seems to be the maximum accuracy achievable with this parameterisation.
A similar comparison of offline calculated flash frequen-cies with the A prec parameterisation is not possible from the 3A25 data since the scheme is designed for strong individ-ual precipitation events with a threshold value of more than 7 mm/day, which is hardly reached in the monthly averaged TRMM data. Therefore, the 3 hourly precipitation data of the 3B42 TRMM dataset for the year 1999 are applied. From this data set no distinction between stratiform and convec-tive precipitation is available. However, since the parameter-isation requires strong precipitation, all rainfall events with values higher than the threshold are selected for the analy-sis. The resulting annual average flash densities are shown in the lower panel of Fig. 4. It is obvious that the strong land-sea contrast is not represented with this data compara-ble to the results of the model simulations already analysed in the right column of Fig. 2. In general, the continental light-ning activity is underestimated, whereas the oceanic contri-bution is overestimated compared to the observations. The distribution is comparable to those using the T1, EC, and B1 convection schemes, all producing precipitation distributions which agree relatively well with the observations (Tost et al., 2006). However, the following aspects must be considered when interpreting the results of the flash distribution based on observed precipitation:
– The parameterisation yields only the cloud-to-ground
flash frequency whereas the LIS/OTD observations comprise both types of lightning events. For the lower panel of Fig. 4 a globally and temporally constant fac-tor of 0.15 for the ratio between CG to IC flashes has been applied. This is the average value derived from the
model results and determines the re-scaling factor with-out changing the distribution patterns. Although this is a substantial simplification, a spatial and temporal vary-ing ratio cannot be calculated from the observations, preventing the parameterisation from a direct evaluation versus CG flashes.
– The subdivision of precipitation into stratiform and
con-vective rain in the model configurations is quite differ-ent from that derived from the monthly mean TRMM data (Tost et al., 2006). Furthermore, not all precipi-tation must be related to lightning activity. However, a global reduction of the total precipitation by a strati-form fraction would not change the results, and a local distinction within the 3 hourly intervals is not available.
– The time resolution of the satellite is different from that
of the model data, since a global coverage cannot be achieved at every 3 h.
The correlation of the derived flash densities from the pre-cipitation approach with the observed ones is R=0.60, also comparable to the values obtained with the model.
4.3 Annual cycle of lightning
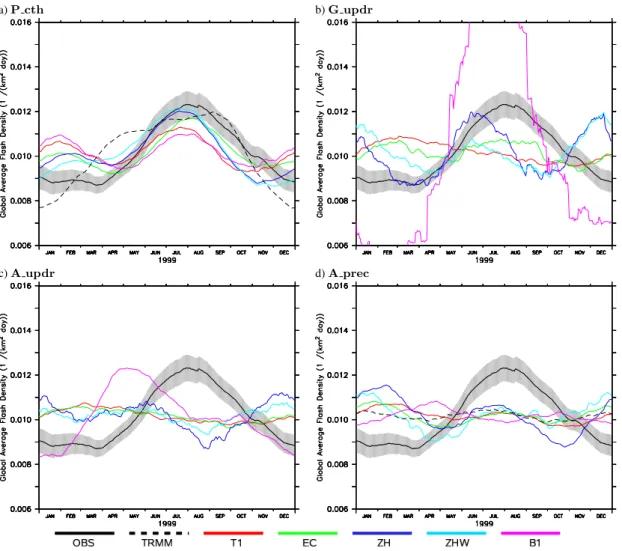
Figure 5 depicts the annual cycle of the spatially averaged (from 60◦S to 60◦N) flash densities in the different simula-tions. Since the observations are provided as a 110-day run-ning mean, the model output is smoothed in the same way, suppressing the strong day-to-day variations.
As expected from Fig. 3 using the P cth lightning param-eterisation yields a similar annual cycle for all simulations (upper left panel). The black line, depicting the observed annual cycle and the grey shaded area (showing the one σ spatial variation), show a strong maximum in boreal sum-mer. This is also captured by the simulations, but the model calculates the highest flash densities about 20 days earlier than observed, independent of the choice of the convection scheme. Furthermore, lower values than observed are simu-lated (especially with T1 and B1, and to a lesser extent with EC). During the boreal winter, in which the lowest lightning occurrence is observed, all simulations substantially overes-timate the global average flash frequency by approximately 30%. The overestimation at the beginning of the year occurs mainly in the tropics (10◦S to 10◦N), since the observations show a substantially smaller maximum during the first cross-ing of the equator by the ITCZ in boreal sprcross-ing compared to the second maximum in autumn, whereas in the simulations both crossing events result in similar lightning activity. This results from an overestimation of the lightning activity in the tropical South America with all convection schemes during boreal winter. The lightning activity during summer is cap-tured in better agreement with the observations in each hemi-sphere (10◦to 30◦). However, if the observed TRMM cloud top height is used with the P cth flash parameterisation, the
a)P cth b)G updr
c)A updr d)A prec
Fig. 5. Average (60◦S to 60◦N, for the TRMM data only 40◦S to 40◦N) time series of the flash density for the year 1999. The four panels show the different lightning schemes. The black line depicts the observations and the grey shaded area the spatial standard deviation. The coloured lines represent the model simulations with the different convection schemes, and the dashed lines the calculated flash densities determined from the TRMM precipitation radar data with the P cth and the A prec parameterisations as described in the text.
seasonal cycle of the flash densities does not match the ob-served one, since double peaked maxima in May and August are calculated with slightly lower values in July (dashed line in the upper left panel of Fig. 5). Nevertheless, the low ob-served values during boreal winter can be reproduced.
The G updr (upper right panel of Fig. 5) scheme has much greater difficulty to reproduce the observed annual cycle of lightning activity. In combination with T1 the temporal vari-ability of the simulated flash densities has no features in com-mon with the observations. Even though the short term vari-ability (not shown) ranges from 0.008 to 0.012 it does not reproduce the seasonal cycle. As for the P cth scheme, the largest differences between the observed and simulated an-nual cycle occur in the central tropics (10◦S to 10◦N) show-ing relatively poor agreement. The changshow-ing location of the ITCZ with time cannot be detected in the lightning densities calculated with this parameterisation, largely independent of
the convection scheme. This can be explained by the en-hanced lightning activity over the oceans, which contributes substantially to the simulated flash densities, but is not ob-served in such strength. Furthermore, during boreal winter the simulated lightning activity in South America is overes-timated leading to the enhanced flash densities in February and March. T1 and EC show a smaller annual variability compared to ZH, ZHW and B1. ZH and ZHW also have a substantial contribution of mid-latitude convection with pro-nounced lightning activity during winter. B1 is characterised by very large temporal extremes (very high day-to-day varia-tions, substantial underestimation in boreal winter, but over-estimation during boreal summer). In combination with the poor correlation, indicated by the spatial analysis in Fig. 2, this leads to the conclusion that local extrema govern the flash densities in this simulation setup.
a)P cth b)G updr
c)A updr d)A prec
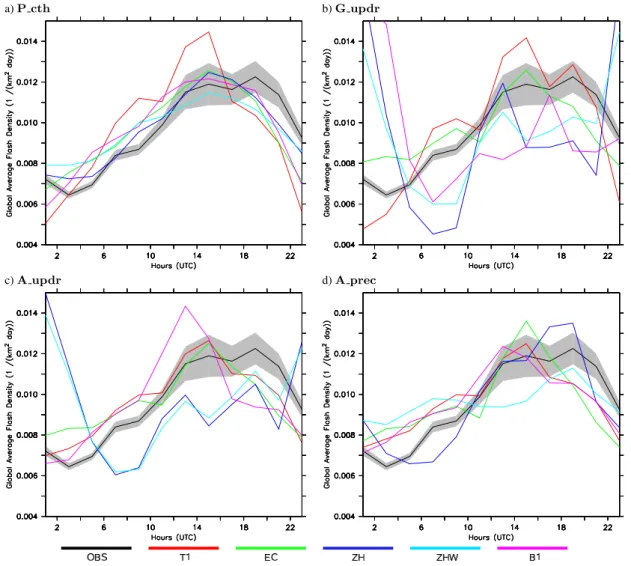
Fig. 6. Global average diurnal time series of the flash density for the year 1999. The four panels show the different lightning schemes. The
black line depicts the observations (multi-year climatology) and the grey shaded area the spatial standard deviation (one σ ). The coloured lines represent the model simulations with the different convection schemes.
Even though the absolute variability is much lower when the A updr scheme is used (lower left panel of Fig. 5), the annual cycle can also not be reproduced with this parame-terisation. T1 and EC show a very similar behaviour, but have hardly any monthly variation. The other three convec-tion parameterisaconvec-tions are characterised by low values dur-ing the maximum of the observations (July, August, Septem-ber) and higher values than observed during the rest of the year. The reason for this is again found in the central trop-ics, where the annual cycle is not captured, or is even inverse compared to the observations. Especially B1 shows a boreal spring maximum originating mainly from oceanic convec-tion and lightning activity. This oceanic lighting producconvec-tion with all convection parameterisations also leads to the en-hanced flash densities during the boreal winter and contra-dicts the observed annual cycle.
A similar conclusion is drawn based on the lower right panel of Fig. 5, again showing large discrepancies compared to the observations for all convection schemes when used with the A prec flash frequency parameterisation. Again, the major differences occur between 10◦S and 10◦N, the re-gion with the strongest precipitation, and therefore (with this scheme) also lightning activity. Comparing the annual cycle of precipitation of TRMM data in this region with the simu-lated flash densities from the A prec parameterisation overall agreement is found, apart from a forward shift of one month in the simulated flashes. However, the derived flash densities from the TRMM data are characterised by a weak seasonal cycle, resulting in overestimated lighting activity during bo-real winter and underestimated during the bobo-real summer.
In conclusion, the lightning schemes which do not use a strict distinction between ocean and land flash parame-terisations (G updr, A updr and also A prec in which the
a)P cth b)G updr
c)A updr d)A prec
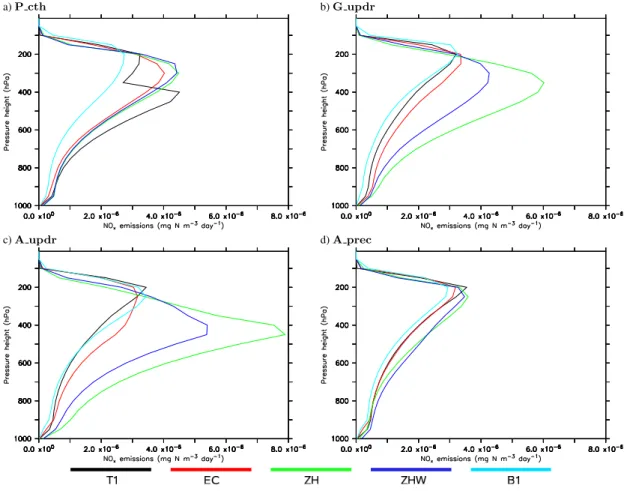
Fig. 7. Vertical profiles of the annual average lightning produced NOx emissions, spatially averaged (meridional and zonal, the latter
restricted to 60◦S–60◦N). As in Fig. 5 the panels display the lightning schemes, and the colours the convection parameterisations.
differences in the parameters are not very large) are hardly able to reproduce the seasonal cycle. The reasons are the overestimated oceanic flash occurrences and the incorrectly captured seasonal displacement of regions with intense con-vection over the oceans.
4.4 Diurnal cycle of lightning
In contrast to reproducing the seasonal cycle the diurnal cy-cle of the flash densities is captured much better by the model simulations, in general for all combinations of con-vection and lightning parameterisations; only ZH and ZHW perform worse in combination with the updraft based light-ning parameterisations. Figure 6 depicts the diurnal cycle in UTC. Note that for the observations it is not the daily climatology for 1999, but data from several years, i.e. the “LISOTD LRADC V2.2” dataset. The upper left panel, showing the P cth scheme, is able to reproduce the first flash density maximum at 14:00 UTC (related to the African light-ning activity (e.g. Price and Rind, 1994)), but the second maximum which relates to the American early afternoon is generally underestimated. Since the South American flash density is simulated well or even overestimated, this must
be related to the underestimation of North American light-ning activity. Due to an overestimation of the maximum and the rescaling of the global flash density to the observations, the model mainly underestimates the lightning activity dur-ing the rest of the day, especially around midnight. Most of the schemes compute the diurnal cycle almost within one σ (spatial variation) of the observations, in agreement with the results of Nickolaenko et al. (2006).
The updraft based approach (G updr) reproduces the ob-servations well in combination with the T1 convection, es-pecially the double peaked maxima in the afternoon and evening. With the EC convection the diurnal cycle is less pronounced. ZH, ZHW and especially B1, all shown to have problems in our analyses above, also fail with respect to the diurnal cycle, showing maximum values during the night, i.e. highest lightning activity in the western part of South Amer-ica (late afternoon in the Andes region, compare Fig. 2).
Using the A updr scheme, the agreement of the T1 and EC simulation with the observations is comparable to the P cth approach. Again, the North American lightning activity (evening hours in UTC) is underestimated. ZH and ZHW show a similar behaviour as with the G updr
parameterisation with highest values around midnight, but with two smaller maxima corresponding to the African and American lightning activity. B1 captures the diurnal cycle comparable to T1, with an overestimation of the first maxi-mum and a phase shift of one hour forward, while the second maximum is not simulated.
The precipitation based flash parameterisation reproduces the major features, but also fails with respect to the second evening maximum. Only with ZHW the amplitude of the diurnal cycle is underestimated. In general, the diurnal cy-cle represents to some degree also the spatial patterns, since the more intense continental convection usually occurs in the early afternoon. Therefore the diurnal lightning cycle is char-acterised by a local afternoon maximum.
4.5 NOxemission profiles
The most important impact of lightning parameterisations in atmospheric chemistry models is on the vertical profiles of the NOx emissions. From the calculated flash
frequen-cies using assumptions of total NOx emitted per flash, the
partitioning of all flashes into CG and IC flashes and the production efficiency of both types (see above in Sect. 2) the total amount of lightning produced NOx can be
calcu-lated. Using the C-shape profile according to Pickering et al. (1998) a vertical distribution of the emitted NOx is
deter-mined. Even though the rescaling of the total flash fre-quency to the LIS/OTD observed frefre-quency is applied, the total amount of emitted NOxcan differ substantially because
of different freezing levels in the convective clouds. This re-sults in different partitioning factors for CG and IC flashes. Since both types are characterised by a different NOx
pro-duction efficiency, different total emissions which are placed between cloud bottom and cloud top level in the C-shape pro-file (with respect to mixing ratios) (Pickering et al., 1998) are calculated.
Figure 7 depicts average NOx emission profiles. The
colours denote the convection schemes and the panels the various lightning and subsequent emission parameterisa-tions. The upper left panel (P cth) exhibits a similar shape for EC, ZH and ZHW after applying the flash frequency rescaling. The double peaked shape of T1 originates from the differentiation by the convection scheme between deep and midlevel convection (i.e. penetrative convection trig-gered above the boundary layer). Due to the formulation of the Tiedtke scheme, the second type is artificially restricted to a cloud top of 400 hPa, but it globally occurs more often than deep convection. Since the vertical extension of these clouds also extends more than 3 km they are also considered for possible lightning production and cause the lower peak. Even though the EC convection is also based on the original Tiedtke scheme and distinguishes the same types of convec-tion, the midlevel convection cloud top is not restricted and consequently the second peak is not present. The Bechtold scheme is characterised by the emission maximum at slightly
higher altitude (originating from higher cloud top levels), but of smaller magnitude. The latter effect results from the dif-ferent freezing altitude and consequently the partitioning into cloud-to-ground and intra-cloud flashes.
The application of the G updr parameterisation leads to a similar shape of the emission profiles for T1, EC, and B1. ZHW and even more ZH show the maximum at lower alti-tude. The altitude of the maximum emission differs by about 150 hPa. Additionally, the overall amounts of emitted NOx
differ substantially (factor of 2), even though the total num-ber of flashes are rescaled to the observations. Addition-ally, the emissions in the mid-troposphere are substantially enhanced with ZH and ZHW.
A similar result is obtained when using A updr with the different convection schemes: T1, EC, and B1 are similar in emission strength and the altitude of the maximum emis-sion level, whereas for ZH and ZHW the maximum is lo-cated substantially lower, while the total amount of emitted NOxis much larger. As with G updr the emissions are much
stronger between 400 and 700 hPa using ZH or ZHW. The precipitation based lightning scheme (A prec, lower right panel of Fig. 7), shows approximately the same maxi-mum emission altitude for all convection parameterisations. The total amount of emitted NOxvaries by 20%, being
high-est for T1 and ZH, and lowhigh-est for B1, while the overall shape of the emission profiles is similar.
In summary, using the different combinations of schemes results in very different distributions of NOxfrom lightning,
even in the averaged profiles. In combination with the large temporal and spatial differences in the flash densities it is ob-vious that the effective emissions of NOxproduced by
light-ning shows a wide range. The most realistic emission pro-files cannot be determined from this study, but the evaluation of the impacts of these emissions on atmospheric chemistry is beyond the scope of this work and will be analysed sepa-rately.
4.6 Dependencies on the model resolution and setup Most of the lightning parameterisations take the dependence on the horizontal resolution into account, mainly by a rescal-ing factor (determined from the ratio of the model grid size to a reference area) that is multiplied with the flash rate. How-ever, for some model configurations this is not sufficient. In-stead, a new set of parameters is required to give a better representation of the different convective conditions caused by the change in resolution. A sensitivity simulation using the T1 convection scheme, but a lower vertical resolution (19 levels, but the midpoint of the uppermost layer also at 10 hPa) results in strong differences in combination with the G updr scheme, due to differences in the convective updraft mass fluxes. For instance, the spatial distribution is captured sim-ilarly, the required rescaling factor is lower and the seasonal cycle of the lightning activity is represented much better in this model configuration compared to the 31 layer version
discussed above. The results are comparable to those ob-tained with the P cth scheme. This leads to the conclusion that the vertical resolution is quite relevant for the parame-terised convective dynamics. Consequently the parameters of the lightning scheme must be adjusted with respect to the vertical resolution of the model.
Even though the application of the nudging technique in the simulation setup has the advantage of reproducing the large-scale circulation close to reality (and therefore enables direct comparison with observations), it also has some draw-backs: The simulated meteorology is continuously perturbed by the nudging tendency. In combinations with some vection schemes this causes a lower frequency of deep con-vective activity, since the boundary layer stability directly or indirectly determines the triggering of the convection algo-rithm. The nudging causes slightly enhanced atmospheric stability throughout the troposphere, since for the nudged temperature profiles, convection and boundary layer param-eterisations have been applied within the data assimilating model (ECMWF forecast model). Consequently, a simula-tion without nudging shows substantially stronger average updraft mass fluxes in the middle and upper troposphere (Tost, 2006).
4.7 Potential weaknesses of the convection schemes The analysis of the simulated lightning data in combination with the observations also indicates some weaknesses in the convection schemes:
– The convective cloud top heights differ substantially, as
can be seen from the range of the rescaling factors for the P cth lightning parameterisation and also from the direct comparison of the cloud top heights. Further-more, observed and simulated cloud top heights show significant differences, comparable to the study of Kurz and Grewe (2002).
This becomes most pronounced in South America, where in contrast to the observations, the convection reaches deeper with most convection parameterisations than in Central Africa. The agreement of simulated and observed cloud top heights from TRMM is better with T1, EC and B1 (overestimated over the tropical oceans), whereas ZH and ZHW show substantially higher cloud tops over both the continents and the oceans.
– The convection schemes of ZH and ZHW simulate a
too high frequency of convective lightning events if the P cth lightning scheme is used.
– The restriction of midlevel convection below 400 hPa in
the T1 convection parameterisation appears to be artifi-cial. The explicit distinction between deep convection originating close to the surface and penetrative convec-tion starting at higher altitude is rather arbitrary, and only applied in the T1 scheme. The EC scheme, also be-ing developed from the original Tiedtke (1989) scheme,
but treating midlevel convection similar to deep convec-tion, does not contain such a clear distinction.
– Even though the convective mass fluxes agree relatively
well with respect to the zonal averages (Tost, 2006), the updraft strength of individual convective events can be too strong and/or too localised (especially with B1). On the other hand, the average vertical velocities in ZH and ZHW appear to be much lower (very high rescal-ing factors are required in the updraft based lightnrescal-ing schemes), and the convective mass fluxes in the middle and upper troposphere are lower compared to the other schemes. However, this is partly caused by the applied nudging technique as explained above.
– Oceanic convection is almost as intense as continental
convection with respect to the updraft strength (contra-dicting the assumption of the updraft based lightning parameterisation), since the parameterisations provide only grid box mean updraft mass fluxes. The convec-tive precipitation over the tropical oceans is too high (see Tost et al., 2006), leading to an overestimation of the flash frequencies from the A prec parameterisation over the ocean.
– Even though the influence of subgrid-scale convection
on the humidity and moist static energy is captured ac-curately by the parameterisations independent of the model resolution, the convective dynamics can be sub-stantially influenced by the selected model resolution (both horizontal and vertical), affecting both lightning schemes and convective tracer transport.
5 Conclusions
Using parameterised model results (convection) as input data for another parameterisation (lightning) leads to large uncer-tainties in the prediction of flashes and additionally param-eterised lightning NOxemissions. For all combinations of
lightning and convection schemes a scaling factor (in addi-tion to the a priori performed resoluaddi-tion dependent rescaling) must be applied to reproduce the observed global flash fre-quency, and these factors can differ by orders of magnitude. With none of the combinations is it possible to accurately re-produce the observed lightning distributions, although some combinations produce more realistic results than others.
The P cth approach offers robustness with respect to both spatial and temporal variations of the convective events, but cloud top height is only indirectly (less physically) linked with cloud electrification via the vertical extension of the clouds which is affected by the strength of the updraft. The updraft approaches must be used with caution, especially the G updr scheme, since the exponential formulation tends to create unrealistically high values for strong updrafts. How-ever, in combination with T1 this approach is among the best
in reproducing the observed lightning densities. This results mainly from the development of the G updr scheme in com-bination with this specific convection scheme in a previous model version (ECHAM4, Grewe et al. (2001); Kurz and Grewe (2002)). The precipitation approach has shown to perform reasonably well for the long-term average, if the ob-served precipitation distribution is reproduced (e.g. by B1), whereas the temporal variability is poorly captured.
We conclude that the rescaling to the globally observed flash frequency is not sufficient, and additional tuning of the parameters is required. This procedure, however, is be-yond the scope of this study. A re-determination of the co-efficients is also desirable for the two approaches by Allen and Pickering (2002), but this is also not straight-forward, since either global information about the CG fraction of the lightning events (which cannot be easily determined from LIS/OTD data), or a completely new set of parameters for the total flash frequency for each model configuration are re-quired. The resulting parameters would have comparable un-certainties (=variations) as the existing parameterisation ap-proaches. Furthermore, it appears that except for the P cth approach the lightning parameterisations are hardly robust against changes in the convective dynamics. The drawback is the requirement of a continously re-tuning of the parame-ters. Under the perturbed conditions of future scenarios such a re-tuning is almost impossible.
The seasonal cycle is difficult to reproduce with all com-binations, indicating general problems with the model con-figurations, resolutions or the parameterisation concepts.
Even if the lightning events agree with the observations, the resulting NOxemissions deviate due to the different
con-vective cloud properties (freezing level, distinction between cloud-to-ground and intra-cloud flashes, etc.). From the re-sults it is not possible to decide which emission profiles are most realistic, since direct emissions are not observed. Only the combination of lightning emissions with a chemistry model can be evaluated e.g. using aircraft observations in the anvil regions of convective clouds. This will be the focus of an upcoming study. The large variability associated with the tested combinations points to many unresolved problems in simulating lightning and lightning produced NOxemissions
in atmospheric general circulation models.
For future model simulations some approaches, e.g. the high correlation between precipitation ice and flash frequen-cies (Petersen et al., 2005) are promising, though they require improvements of both, the convection parameterisations with respect to ice microphysics and the development of a scheme that makes use of this relationship.
Appendix A Abbreviations
σ 1) standard deviation
2) ratio of pressure to surface pressure (p/ps) σsim standard deviation of the simulation results
σobs standard deviation of the observations
σ⋆ σsim/σobs
R correlation
RMSE root mean square error CG flashes cloud-to-ground flashes IC flashes inter- and intra-cloud flashes GCM General Circulation Model
AC-GCM Atmospheric Chemistry General Circulation Model ECMWF European Centre for Medium Range Weather Forecast E5/M1 ECHAM5/MESSy1
MATCH Model of Atmospheric Transport and Chemistry LNOX NOxemissions from lightning (submodel)
TRMM Tropical Rainfall Measuring Mission ITCZ Inner Tropical Convergence Zone SPCZ Southern Pacific Convergence Zone LIS Lightning Imaging Sensor OTD Optical Transient Detector LISOTD
LRTS V2.2
Low resolution time series dataset of combined flash rates from LIS and OTD
LISOTD LRADC V2.2
Low resolution annual diurnal climatology dataset of combined flash rates from LIS and OTD
T1 Tiedtke-Nordeng convection scheme EC convection scheme from ECMWF
ZH convection scheme of Zhang-McFarlane-Hack ZHW convection scheme of Zhang-McFarlane-Hack with
addi-tional evaporation following Wilcox B1 convection scheme of Bechtold
P cth lightning parameterisation based on cloud top height (Price and Rind)
G updr lightning parameterisation based on vertical velocity (Grewe)
A updr lightning parameterisation based on vertical velocity (Allen and Pickering)
A prec lightning parameterisation based on convective surface precipitation (Allen and Pickering)
Acknowledgements. We thank H. Christian and co-workers,
providing the detailed lightning satellite observation data. We are grateful to the TRMM satellite team for providing the datasets. We thank V. Grewe and C. Kurz for helpful comments to this manuscript and contributions to the LNOX submodel development, and all the other MESSy developers for their support. Additionally, we thank the three referees for the helpful comments. Furthermore, we wish to acknowledge the use of the Ferret program for analysis and graphics in this paper. Ferret is a product of NOAA’s Pacific Marine Environmental Laboratory. (Information is available at http://ferret.pmel.noaa.gov/Ferret/). This study is part of the ENIGMA project; we thank the Max-Planck Society for support. Edited by: M. Dameris
References
Allen, D. J. and Pickering, K. E.: Evaluation of lightning flash rate parameterizations for use in a global chemical transport model, J. Geophys. Res., 107, 4711, doi:10.1029/2002JD002066, 2002. Barthe, C., Molini´e, G., and Pinty, J.-P.: Description and first results of an explicit electrical scheme in a 3D cloud resolving model, Atmos. Res., 76, 95–113, 2005.
Bechtold, P., Bazile, E., Guichard, F., Mascart, P., and Richard, E.: A mass-flux convection scheme for regional and global models, Q. J. Roy. Meteor. Soc., 127, 869–886, 2001.
Bechtold, P., Chaboureau, J.-P., Beljaars, A., Betts, A. K., K¨ohler, M., Miller, M., and Redelsperger, J.-L.: The simulation of the diurnal cycle of convective precipitation over land in a global model, Q. J. Roy. Meteor. Soc., 130, 3119–3137, 2004. Christian, H. J., Blakeslee, R. J., Goodman, S. J., Mach, D. A.,
Stewart, M. F., Buechler, D. E., Koshak, W. J., Hall, J. M., Boek, W. L., Driscoll, K. T., and Boccippio, D. J.: The Lightning Imag-ing Sensor, in: ProceedImag-ings of the 11th International Conference on Atmospheric Electricity, Guntersville, Alabama, 7–11 June , 746–749, 1999.
Christian, H. J., Blakeslee, R. J., Boccippio, D. J., Boeck, W. L., Buechler, D. E., Driscoll, K. T., Goodman, S. J., Hall, J. M., Koshak, W. J., Mach, D. M., and Stewart, M. F.: Global fre-quency and distribution of lightning as observed from space by the Optical Transient Detector, J. Geophys. Res., 108, 4005, doi: 10.1029/2002JD002347, 2003.
Grewe, V., Brunner, D., Dameris, M., Grenfell, J. L., Hein, R., Shin-dell, D., and Staehelin, J.: Origin and variability of upper tro-pospheric nitrogen oxides and ozone at northern mid-latitudes, Atmos. Environ., 35, 3421–3433, 2001.
Hack, J. J.: Parameterization of moist convection in the National Center for Atmospheric Research community climate model (CCM2), J. Geophys. Res., 99, 5551–5568, 1994.
Jacobson, M. Z.: Atmopsheric Pollution, Cambridge University Press, 2002.
Jeuken, A. B. M., Siegmund, P. C., Heijboer, L. C., Feichter, J., and Bengtsson, L.: On the potential of assimilating meteorolog-ical analyses in a global climate model for the purpose of model validation, J. Geophys. Res., 101, 16 939–16 950, 1996. J¨ockel, P., Sander, R., Kerkweg, A., Tost, H., and Lelieveld, J.:
Technical Note: The Modular Earth Submodel System (MESSy) – a new approach towards Earth System Modeling, Atmos. Chem. Phys., 5, 433–444, 2005,
http://www.atmos-chem-phys.net/5/433/2005/.
J¨ockel, P., Tost, H., Pozzer, A., Br¨uhl, C., Buchholz, J., Ganzeveld, L., Hoor, P., Kerkweg, A., Lawrence, M. G., Sander, R., Steil, B., Stiller, G., Tanarhte, M., Taraborrelli, D., van Aardenne, J., and Lelieveld, J.: The atmospheric chemistry general circulation model ECHAM5/MESSy1: consistent simulation of ozone from the surface to the mesosphere, Atmos. Chem. Phys., 6, 5067– 5104, 2006,
http://www.atmos-chem-phys.net/6/5067/2006/.
Kummerow, C., Simpson, J., Thiele, O., Barnes, W., Chang, A. T. C., Stocker, E., Adler, R. F., Hou, A., Kakar, R., Wentz, F., Ashcroft, P., Kozu, T., Hong, Y., Okamoto, K., Iguchi, T., Kuroiwa, H., Im, E., Haddad, Z., Huffman, G., Ferrier, B., Ol-son, W. S., Zipser, E., Smith, E. A., Wilheit, T. T., North, G., Krishnamurti, T., and Nakamura, K.: The Status of the Tropical Rainfall Measuring Mission (TRMM) after two years in orbit, J.
Appl. Meteorol., 39, 1965–1982, 2000.
Kurz, C. and Grewe, V.: Lightning and thunderstorms, Part I: Ob-servational data and model results, Met. Zeitschr., 11, 379–393, doi:10.1127/0941-2498/2002/0011-0379, 2002.
Labrador, L. J., v. Kuhlmann, R., and Lawrence, M. G.: The effects of lightning-produced NOxand its vertical distribution on
atmo-spheric chemistry: sensitivity simulations with MATCH-MPIC, Atmos. Chem. Phys., 5, 1815–1834, 2005,
http://www.atmos-chem-phys.net/5/1815/2005/.
Lawrence, M. G., Crutzen, P. J., Rasch, P. J., Eaton, B. E., and Mahowald, N. M.: A model for studies of tropospheric chem-istry: Description, global distributions and evaluation, J. Geo-phys. Res., 104, 26 245–26 277, 1999.
Nickolaenko, A. P., Hayakawa, M., and Sekiguchi, M.: Variations in global thunderstorm activity inferred from the OTD records, Geophys. Res. Lett., 33, L06823, doi:10.1029/2005GL024884, 2006.
Nordeng, T. E.: Extended versions of the convective parametriza-tion scheme at ECMWF and their impact on the mean and transient activity of the model in the tropics, Tech. Rep. 206, ECWMF, 1994.
Petersen, W. A. and Rutledge, S. A.: On the relationship between cloud-to-ground lightning and convective rainfall, J. Geophys. Res., 103, 14 025–14 040, 1998.
Petersen, W. A., Christian, H. J., and Rutledge, S. A.: TRMM ob-servations of the global relationship between ice water content and lightning, Geophys. Res. Lett., 32, L14819, doi:10.1029/ 2005GL023236, 2005.
Pickering, K. E., Wang, Y., Tao, W.-K., Price, C., and M¨uller, J.-F.: Vertical distribution of lightning NOx for use in regional
and chemical transport models, J. Geophys. Res., 103, 31 203– 31 216, 1998.
Price, C. and Rind, D.: A simple Lightning Parametrization for Cal-culating Global Lightning Distributions, J. Geophys. Res., 97, 9919–9933, 1992.
Price, C. and Rind, D.: What determines the Cloud-to-Ground Lightning fraction in Thunderstorms, Geophys. Res. Lett., 20, 463–466, 1993.
Price, C. and Rind, D.: Modeling Global Lightning Distributions in a General Circulation Model, Mon. Weather Rev., 122, 1930– 1939, 1994.
Price, C., Penner, J., and Prather, M.: NOxfrom lightning, 1. Global
distribution based on lightning physics, J. Geophys. Res., 102, 5929–5941, 1997a.
Price, C., Penner, J., and Prather, M.: NOxfrom lightning, 2.
Con-straints from the global atmospheric electric circuit, J. Geophys. Res., 102, 5943–5951, 1997b.
Rasch, P. J., Mahowald, N. M., and Eaton, B. E.: Representations of transport, convection and the hydrologic cycle in chemical trans-port models: Implications for the modeling of short-lived and soluble species, J. Geophys. Res., 102, 28 127–28 138, 1997. Roeckner, E., B¨auml, G., Bonaventura, L., Brokopf, R., Esch,
M., Giorgetta, M., Hagemann, S., Kirchner, I., Kornblue, L., Manzini, E., Rhodin, A., Schleese, U., Schulzweida, U., and Tompkins, A.: The atmospheric general circulation model ECHAM5: Part 1, Tech. Rep. 349, Max-Planck-Institut f¨ur Me-teorologie, 2003.
Roeckner, E., Brokopf, R., Esch, M., Giorgetta, M., Hagemann, S., Kornblue, L., Manzini, E., Schleese, U., and Schulzweida, U.:
The atmospheric general circulation model ECHAM5: Part 2, Tech. Rep. 354, Max-Planck-Institut f¨ur Meteorologie, 2004. Roeckner, E., Brokopf, R., Esch, M., Giogetta, M., Hagemann, S.,
Kornblueh, L., Manzini, E., Schleese, U., and Schulzweida, U.: Sensitivity of simulated climate to horizontal and vertical reso-lution in the ECHAM5 atmosphere model, J. Climate, 19, 3771– 3791, 2006.
Schumann, U. and Huntrieser, H.: The global lightning-induced ni-trogen oxides source, Atmos. Chem. Phys., 7, 3823–3907, 2007, http://www.atmos-chem-phys.net/7/3823/2007/.
Taylor, K. E.: Summarizing multiple aspects of model preformance in a single diagram, J. Geophys. Res., 106, 7183–7192, 2001. Thomas, R. J., Krehbiel, P. R., Rison, W., Hamlin, T.,
Boccip-pio, D. J., Goodman, S. J., and Christian, H. J.: Comparison of ground-based 3-dimensional lightning mapping observations with satellite-based LIS observations in Oklahoma, Geophys. Res. Lett., 27, 1703–1706, 2000.
Tiedtke, M.: A Comprehensive Mass Flux Scheme for Cumulus Parametrization in Large-Scale Models, Mon. Weather Rev., 117, 1779–1800, 1989.
Tost, H.: Global Modelling of Cloud, Convection and Precip-itation Influences on Trace Gases and Aerosols, Ph.D. the-sis, Rheinische Friedrich-Wilhelms-Universit¨at Bonn, Germany, available at: http://hss.ulb.uni-bonn.de/diss online/math nat fak/ 2006/tost holger, 2006.
Tost, H., J¨ockel, P., and Lelieveld, J.: Influence of different convec-tion parameterisaconvec-tions in a GCM, Atmos. Chem. Phys., 6, 5475– 5493, 2006,
http://www.atmos-chem-phys.net/6/5475/2006/.
van Aalst, M. K., van den Broek, M. M. P., Bregman, A., Br¨uhl, C., Steil, B., Toon, G. C., Garcelon, S., Hansford, G. M., Jones, R. L., Gardiner, T. D., Roelofs, G.-J., Lelieveld, J., and Crutzen, P.: Trace gas transport in the 1999/2000 Arctic winter: com-parison of nudged GCM runs with observations, Atmos. Chem. Phys., 4, 81–93, 2004,
http://www.atmos-chem-phys.net/4/81/2004/.
Wilcox, E. M.: Spatial and Temporal Scales of Precipitation Tropi-cal Cloud Systems in Satellite Imagery and the NCAR CCM3, J. Climate, 16, 3545–3559, 2003.
Zhang, G. J. and McFarlane, N. A.: Sensitivity of Climate Simulations to the Parameterization of Cumulus Convection in the Canadian Climate Centre General Circulation Model, Atmosphere-Ocean, 33, 407–446, 1995.