Publisher’s version / Version de l'éditeur:
Advanced Engineering Materials, 10, 9, pp. 889-894, 2008
READ THESE TERMS AND CONDITIONS CAREFULLY BEFORE USING THIS WEBSITE. https://nrc-publications.canada.ca/eng/copyright
Vous avez des questions? Nous pouvons vous aider. Pour communiquer directement avec un auteur, consultez la
première page de la revue dans laquelle son article a été publié afin de trouver ses coordonnées. Si vous n’arrivez pas à les repérer, communiquez avec nous à PublicationsArchive-ArchivesPublications@nrc-cnrc.gc.ca.
Questions? Contact the NRC Publications Archive team at
PublicationsArchive-ArchivesPublications@nrc-cnrc.gc.ca. If you wish to email the authors directly, please see the first page of the publication for their contact information.
NRC Publications Archive
Archives des publications du CNRC
This publication could be one of several versions: author’s original, accepted manuscript or the publisher’s version. / La version de cette publication peut être l’une des suivantes : la version prépublication de l’auteur, la version acceptée du manuscrit ou la version de l’éditeur.
For the publisher’s version, please access the DOI link below./ Pour consulter la version de l’éditeur, utilisez le lien DOI ci-dessous.
https://doi.org/10.1002/adem.200800142
Access and use of this website and the material on it are subject to the Terms and Conditions set forth at
Experimental Demonstration of Entrance/Exit Effects on the
Permeability Measurements of Porous Materials
Baril, Éric; Mostafid, Ali; Lefebvre, Louis-Philippe; Medraj, Mamoun
https://publications-cnrc.canada.ca/fra/droits
L’accès à ce site Web et l’utilisation de son contenu sont assujettis aux conditions présentées dans le site LISEZ CES CONDITIONS ATTENTIVEMENT AVANT D’UTILISER CE SITE WEB.
NRC Publications Record / Notice d'Archives des publications de CNRC:
https://nrc-publications.canada.ca/eng/view/object/?id=9491a3c0-12aa-4802-a849-9b478297dbc2
https://publications-cnrc.canada.ca/fra/voir/objet/?id=9491a3c0-12aa-4802-a849-9b478297dbc2
Experimental Demonstration of Entrance/Exit Effects on the
Permeability Measurements of Porous Materials**
By
Eric Baril,* Ali Mostafid, Louis-Philippe Lefebvre and Mamoun Medraj
Open cell metallic foams have a combination of attractive properties such as permeability, thermal and electrical con-ductivities, thermal and environmental stability, high stiff-ness and low specific weight. Resistance to fluid flow is an important parameter to optimize in many applications such as filters and heat exchangers. For that reason, understanding the pressure drop behavior through metallic foam is impor-tant when designing flow through systems.
Darcy was one of the first to describe fluid flow through porous mediums. He described the pressure drop observed when water was flowing through sand beds and established the permeability principles that are still in use today. Consid-ering the volumetric flow rate, Q, and the average fluid veloc-ity V=Q/A, where A is the porous medium cross-section sur-face area, Darcy presented his experimental results in terms of the pressure difference across the porous medium, Dp, as a function of fluid velocity. He found that the normalized pres-sure drop was inversely proportional to a constant depending on the material’s structure. He called this coefficient k the hydraulic conductivity and related it to the medium height, t, the pressure-drop, Dp and the averaged fluid velocity as: Dp
t
1
kV 1
Darcy did not make any reference to the fluid viscosity since his experiments were only done with water at room temperature. Hazen later observed the effect of fluid viscosity by changing the temperature of the fluid flowing through a
filter.[1]The fluid viscosity appeared in the modified Hazen-Darcy equation as:
Dp t
l
KV 2
The hydraulic conductivity k of Equation 1 was substi-tuted by K/l in Equation 2, where K is called the specific per-meability, a hydraulic parameter independent of the fluid properties, and l is the fluid dynamic viscosity. Equation 2 states that the pressure drop per unit length of porous medi-um is proportional to the product of velocity and the dynamic viscosity of the fluid.[2]
Hazen-Darcy equation is only applicable when the velocity of the fluid is sufficiently small so that that the Reynolds number of the flow is around unity or smaller.[3]Davis and Olague have shown from their analysis of the experimental datasets published by Darcy that for velocities higher than 4 × 10⁻³m/s, the normalized pressure drop vs fluid velocity is better represented by quadratic model than by a linear one.[4]As the velocity increases, the influences of inertia and turbulence become more significant and the results diverge from the linear Darcy model. This departure eventually causes the pressure-drop across a porous medium to be gov-erned by inertial effects, which depends on the fluid density q and quadratic velocity V2. The physical phenomenon respon-sible for the quadratic term in Equation 3 is assumed to be the force imposed to the fluid by solid surface obstructing the fluid flow path. According to Newton, this resistivity is pro-portional to the fluid density and the average fluid velocity square.[5]The addition of this contribution gives the Hazen-Dupuit-Darcy equation: Dp t l KV CrV 2 3
where C is a inertial coefficient related to the geometry of the porous media and q is the fluid density.
The common assumption for permeability measurement is that the macroscopic flow is steady and fully-developed.[6] Kaviany and Naakteboren et al. stated that the entrance length, over which the flow becomes steady is more or less equivalent to the diameter of one pore.[7,8]Naakteboren et al. investigated analytically and numerically the fluid flow through perforations (perforated plate and a straight channel) and showed that in some cases, entrance/exit pressure-drop
TIONS
–
[*] Dr. E. Baril, L.-P. Lefebvre
National Research Council Canada/ Industrial Materials Institute
75 de Mortagne, Boucherville, Québec, J4B 6Y4, Canada E-mail: eric.baril@cnrc-nrc.gc.ca
Prof. M. Medraj, A. Mostafid Concordia University
Department of Mechanical Engineering 1455 De Maisonneuve Blvd. W., Montreal Quebec, H3G 1M8, Canada.
[**] The authors would like to acknowledge RECEMAT
character-media with length greater than one hundred times the pore size, the bulk pressure drop is likely to dominate. Their claims were not, however, verified experimentally.
Recently, Medraj et al. observed that the mathematical addition of the measured pressure drop of two metallic foam disks gives a higher pressure drop than the measured pres-sure drop of the stack of these two disks.[9]They related that difference to the pressure drop due to the change in momen-tum when air impacted the surface of the metallic foam. This pressure drop is counted twice when pressure drop is added mathematically while only once when measured on the stack of two foams. Hwang et al. compared the normalized pres-sure drop in 60 mm and 90 mm thick porous media with fluid velocities ranging between 0.70–2.88 m/s and average pore diameters between 1.84–2.03 mm.[10] They observed a
5.6 % difference in the pressure drop between the two speci-mens. They stated that the entrance/exit effects were respon-sible for the observed difference. These limited experimental evidences of the entrance/exit effects on the pressure drop measurement of porous media did not show the range of thickness and pore sizes where the entrance/exit effect was significant.
The objective of this study was to determine the validity of the Hazen-Dupuit-Darcy equation for a large set of specimen thicknesses and a wide range of velocities. The entrance/exit effects were more specifically studied.
Experimental Set-up and Procedure Specimens
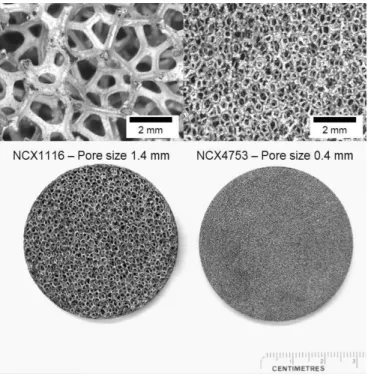
Nickel-chromium open cell foams from RECEMAT Inter-national were used in the experiments. Table 1 and Figure 1 present the characteristics and structure of the foams used in this study. Specimen thicknesses ranging between 2 to 20 mm were used to produce stacks from 2 mm to 63 mm using 47 mm diameter discs cut by wire EDM.
Experimental Set-up
The experiments were conducted using the set-up de-scribed in Figure 2. The instrument was designed to measure the flow of compressed air and pressure drop across the
spec-imens. Air was allowed to fill the pressure vessel at a pres-sure of about 1.25 × 10⁵Pa. The pressure was controlled manually using a pressure control-valve. An air filter was used in line prior to the pressure vessel to absorb impurities and foreign particles. Air was then allowed to pass through the settling chamber by means of a 50.8 mm steel pipe before entering a 25.4 mm steel pipe up to the specimens. The set-tling chamber was used to avoid turbulences in the gas flow. The length of the pipe was selected in order to completely de-velop the air flow and obtain steady state conditions before entering the specimens.
Metallic foam specimens were securely stacked using a middle flange and held in place by means of two standard flanges (25.4 × 108.0 mm). Different middle flanges thick-nesses (13 and 25 mm) and spacers (3, 8, 10 and 21 mm) were used to enable testing specimens with thicknesses ranging from 2 to 63 mm.
The pressure was measured using an OMEGA pressure transducer with a pressure range of 0–1.7237 × 10⁵Pa and Baril et al./Experimental Demonstration of Entrance/Exit Effects on the Permeability Measurements
COMMUNICA
TIONS
890 http://www.aem-journal.com © 2008 WILEY-VCH Verlag GmbH & Co. KGaA, Weinheim ADVANCED ENGINEERING MATERIALS 2008,10, No. 9
Table 1. Foams characteristics.
Grade Pore Size (mm) Average Porosity (%) Nominal Thickness (mm) 1.6 2 3 4 5 7 10 13 20 NC 4753 0.4 0.87 NC 2733 0.6 0.89 NCX 1723 0.9 0.88 NCX 1116 1.4 0.89
± 0.1 % full scale accuracy. A pressure tap was drilled into the pipe, 80 mm from the specimens. A one way valve was used to prevent air leakage. The downstream pressure was mea-sured as atmospheric. Flow velocity was meamea-sured using an OMEGA velocity meter that was calibrated and correctly positioned in the pipe using a flow meter. The calibrated velocity range is 0-20 m/s with a ± 1 % full scale accuracy. To minimize the experimental errors, 100 data points were col-lected every 2 sec. and average was used to plot the graphs.
The repeatability of the measurements was evaluated and the relative standard deviations (RSD) were 1.89 % and 1.74 % for K and C values (Eq. 3) when repeating the measurements on the same sample and 7.5 % and 26 % for both K and C when performing the experiment on 3 replicas.[11]These val-ues are smaller than those estimated in theoretical uncer-tainty analyses where uncertainties range between 3.1–13.9 % and 7.9–15.2 % for K and C respectively.[12]
Results and Discussion
The pressure drop of a stack of two discs was compared with the mathematical addition of the individual pressure drop curves, as experimented by Medraj et al..[9] Figure 3
shows that the mathematical addition is larger than the pres-sure drop meapres-sured on the stack of the two discs. This obser-vation is related to the mathematical addition of the entrance and exit contributions for both individual discs that is not experimentally measured on the stack, where only one set of entrance/exit effects is present. This is identical to the results observed by Medraj et al. on nickel foams with a significantly different foam structures. This observation is an indication of the contribution of entrance/exit effects on the pressure drop measurements.
In order to verify the effect of stacking the foams on the pressure drop, the pressure drop through a 10 mm sample was compared to that measured on a stack of two 5 mm discs of the same material. Figure 4 shows small differences ob-served at high velocity that may come from the misalignment of the structure of the foams. However, this effect is within the incertitude limit and negligible for the materials and condi-tions used in this study. This indicates that foam stacks can be used to reproduce the pressure drop in thicker foams. Figure 4 also shows the effect of a gap between two 5 mm thick foam disks. The presence of a gap generates an additional pressure drop. This must have resulted from the contribution of the additional foam surface in the flow path and, therefore, the addition of entrance/exit effects on the total pressure drop.
The total pressure drop was measured for stacks of metal-lic foams having various thicknesses. Unit pressure drop curves were obtained by dividing the total pressure drop by the total specimen thickness. Equation 3 was used for curve fitting. Figure 5 shows that as expected, the pressure drop in-creases when the thickness inin-creases. However, contrary to classical model predictions, this increase is not linear with the sample thickness. Indeed, Figure 6 shows that the unit pres-sure drop curves (i.e. normalized by the specimen thickness) for specimens with different thicknesses do not all fall on a single curve. Therefore, for each thickness, different K and C could be obtained using the Hazen-Dupuit-Darcy model. This is, indeed, contrary to what is expected from the model. In fact, based on this model, the permeability coefficients should be independent of the specimen geometry and thickness. Fig-ure 6 shows that the unit pressFig-ure drop curves get closer to each other when the thickness of the foam increases. For ex-ample, the normalized pressure drop measured on the 4 mm specimen (NCX1723) is 5 times larger than that measured on the 60 mm specimen. The difference in pressure drop is reduced to 26.5 % when 35 and 60 mm thick foams are compared (NCX1723). These differences are much larger than those reported by Hwang et al. with 60 mm and 90 mm thick foams (i.e. 5.6 %).[10] This may be explained by the larger media thicknesses and different materials used in their study.
COMMUNICA
TIONS
Fig. 2. Experimental set-up.
Fig. 3. Individual, experimental and mathematical additions of pressure drop curves for different NC2733 specimens (d=0.6 mm).
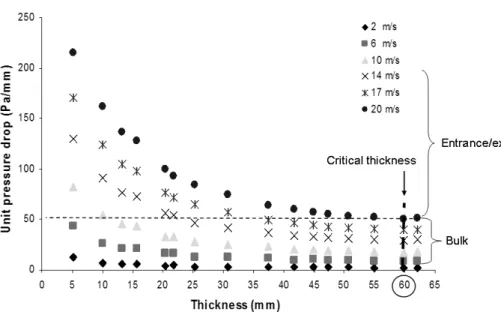
As shown in Figure 7 and 8, the unit pressure drop decreases when the thickness increases and this reduction becomes very small when the thick-ness gets larger. From these Figures, the critical thicknesses to get a constant unit pressure drop are 32 and 60 mm for the NCX2333 and NCX1116 foams respectively. These values are much larger than the pore size of the foams. This contradicts the finding of Kaviany that states that the entrance length is smaller than the size of one pore.[7]In the present study, at low velocities (2 m/s), the critical thickness is somewhere between 5 and 10 mm which is much larger than the pore size.
This behavior suggests that there is a parameter in the expression of the pressure drop that is impor-tant when the specimen thickness is small and be-comes negligible when the thicknesses are large. This parameter could be assimilated to entrance/ exit effects that are affected by variations of local permeability and flow regime. These effects depend on the pore size as shown in Figure 9 and should also be affected by the permeability of the material. When pressure drop is normalized by the thickness of the foam, the entrance/exit effects contribution becomes insignificant at high thicknesses. For pores sizes between 0.4 and 0.9 mm, the bulk pressure drop is dominant when the media thickness is larg-er than 50 times the pores size. For the 1.4 mm pore size, the critical thickness is reduced to 43 times the pore size. In this later case, the critical thickness is very close to the maximum thickness tested in this study (60 mm) and, therefore, the real critical thick-ness was probably not reached with the available specimens.
The contribution of the entrance/exit effects is also illustrated in Figures 10 to 12 by comparing the effect of the entrance surface on stacks produced with foams of different pore size (0.6 and 0.9 mm). The overlap of the curves at low velocity indicates that classical models are applicable at low fluid velocities where the entrance effect seems insignifi-cant. However, at higher velocity (i.e. > 6 m/s), the pressure drop is higher when the gas enters the 0.6 mm pore size foam than when it enters the 0.9 mm pore size foam (Fig. 10). It should be noted that the 0.9 mm pore size foam thickness (33 mm) is smaller than the estimated critical thickness needed to minimized the contribution of the entrance/exit effects (55 mm, as seen in Fig. 9) and the difference observed between the two configurations would be larger if the facing 0.9 mm foam was thicker. This difference will also be more or less important depending on the differences of permeability of the material tested.
Baril et al./Experimental Demonstration of Entrance/Exit Effects on the Permeability Measurements
COMMUNICA
TIONS
892 http://www.aem-journal.com © 2008 WILEY-VCH Verlag GmbH & Co. KGaA, Weinheim ADVANCED ENGINEERING MATERIALS 2008,10, No. 9
Fig. 4. Total pressure drop for single 10 mm disc, stack of two 5 mm discs with a without a 8 mm air gap. Material: NCX1723 (Pore size: d=0.9 mm).
Fig. 5. Total pressure drop for NCX1723 foams of different thicknesses.
Figure 12 shows that the pore size of the exit side does not have a significant effect on the total pressure drop of the 57 mm stack. Indeed, the curves generated with the 0.9 mm pore size foam on the entrance side are all grouped regardless
the conditions used in this study, the entrance effect seems more important than the exit effect. It should be noted that this is in contradiction with the calculations from Lu et al.[11]
Conclusions
The validity of the Hazen-Dupuit-Darcy equation was evaluated with metallic foams of various thicknesses and having different pore sizes. Con-trary to the prediction, the results showed that the pressure drop is not a linear function of the material thick-ness. The differences of normalized pressure for the specimens of differ-ent thickness can be explained by en-trance/exit effects. For thin speci-mens, the entrance/exit contribution can be important and significantly larger than the contribution of the pressure drop in the porous material. When the thickness of the foams is large, the relative contribution of this entrance/exit becomes smaller. The critical thickness where this contribu-tion becomes insignificant is directly related to the foam pore size and should be affected by the permeabil-ity.
Experiments showed that the en-trance/exit of the foam or the transi-tion from materials of different permeability can be a significant con-tributor to the pressure drop. This means that the total pressure drop normalized by the materials thickness as a function of fluid velocity can not be described with classical models when the porous materials thickness is smaller than a critical thickness (i.e. 50 times the pores size in the present study). In this situa-tion, the entrance/exit contribution becomes significant. For the conditions used in the present study, the contribution mainly came from the entrance and the exit effect seemed in-significant.
The entrance/exit effects must be taken into consideration during the measurement of the permeability to make sure that the permeability is thickness independent and this char-acteristic is only affected by the structure of the foam. This should be particularly important when the permeability through thin specimens is measured, where the entrance/exit contribution may predominate.
Other tests should be done to better understand the mech-anisms responsible for the effects observed in this study. Testing materials with different permeability and with fluid
COMMUNICA
TIONS
Fig. 7. Unit pressure drop vs. thickness at different velocities, NC2733, d=0.6 mm.
Fig. 8. Unit pressure drop vs. thickness at different velocities for NCX1116 foams (d=1.4 mm).
Fig. 9. Critical thickness as a function of the pore size (Arrow indicates the deviation of the 1.4 mm pore size foam).
confirm the nature of these effects which will help modeling them.
Received: April 30, 2008 Final version: July 28, 2008 Published online: August 27, 2008
–
[1] A. Hazen, Twenty-fourth Annu. Report, Massachusetts State Board of Health, 1893.
[2] J. L. Lage, in Transport Phenomena in Porous Media, Per-gamon, Oxford 1998, pp. 1–30.
[3] D. Nield, A. Bejan, Convection in Porous Media. Springer, New York 1999.
[4] P. A. Davis, N. E. Olague, Adv. Water Res. 1992, 15, 175. [5] F. Cajori, in Revised translation of “I. Newton,
Philoso-phiae Naturalis Principia Mathematica by A. Motte”,
Uni-versity of California Press, Berkeley 1946.
[6] N. Dukhan, K.-C. Chen, Experimental Thermal and Fluid
Sci. 2007, 32, 624.
[7] M. Kaviany, in Principles of Heat Trans. in Porous Media,
third ed., Springer, New York 1995.
[8] C. Naakteboren, P. S. Krueger, J. L. Lage, Int. Conf. on
Porous Media and Appl. Évora, Portugal 2004.
[9] M. Medraj, E. Baril, V. Loya, L.-P. Lefebvre, J. Mater. Sci.
2007, 42, 4372.
[10] J. J. Hwang, G. J. Hwang, R. H. Yeh, C. H. Chao, J. Heat
Trans. 2002, 124, 20.
[11] T. J. Lu, L. Valdevit, A. G. Evans, Prog. Mater. Sci. 2005,
50, 789.
[12] B. V. Antohe, J. L. Lage, D. C. Price, R. M. Weber,
J. Fluids Eng. 1997, 2, 405.
Baril et al./Experimental Demonstration of Entrance/Exit Effects on the Permeability Measurements
COMMUNICA
TIONS
894 http://www.aem-journal.com © 2008 WILEY-VCH Verlag GmbH & Co. KGaA, Weinheim ADVANCED ENGINEERING MATERIALS 2008,10, No. 9
Fig. 10: Effect of the pore size of the facing surface (FS) on the pressure drop in a stack of two foams of different grades (0.6 and 0.9 mm pore size). The thickness of each foam is 33 mm.
Fig. 11. Composite foam arrangements for the test results of Figure 12 where (a) and (b) are different thicknesses of 0.9 mm Pore Size (PS) foam (white arrow indicates flow direction).
Fig. 12. Composite sample test results, 57 mm with d=0.9 mm and 5 mm with d=0.6 mm (The number in parenthesis states the foam thickness with d=0.6 mm, and the other number(s) states the foam thickness(es) with d=0.9 mm at the side(s)).