HAL Id: hal-03167743
https://hal.archives-ouvertes.fr/hal-03167743
Submitted on 12 Mar 2021HAL is a multi-disciplinary open access archive for the deposit and dissemination of sci-entific research documents, whether they are pub-lished or not. The documents may come from teaching and research institutions in France or abroad, or from public or private research centers.
L’archive ouverte pluridisciplinaire HAL, est destinée au dépôt et à la diffusion de documents scientifiques de niveau recherche, publiés ou non, émanant des établissements d’enseignement et de recherche français ou étrangers, des laboratoires publics ou privés.
Crystal and molecular structure of V-amylose
complexed with ibuprofen
Cong Anh Khanh Le, Yu Ogawa, Frédéric Dubreuil, Florent Grimaud, Karim
Mazeau, Gregory Ziegler, Shivalika Tanwar, Yoshiharu Nishiyama, Gabrielle
Potocki-Veronese, Luc Choisnard, et al.
To cite this version:
Cong Anh Khanh Le, Yu Ogawa, Frédéric Dubreuil, Florent Grimaud, Karim Mazeau, et al.. Crystal and molecular structure of V-amylose complexed with ibuprofen. Carbohydrate Polymers, Elsevier, 2021, 261, �10.1016/j.carbpol.2021.117885�. �hal-03167743�
Crystal and molecular structure of V-amylose complexed
with ibuprofen
Cong Anh Khanh Lea, Yu Ogawaa, Frédéric Dubreuila,†, Florent Grimaudb, Karim Mazeaua,
Gregory R. Zieglerc, Shivalika Tanwara, Yoshiharu Nishiyamaa, Gabrielle Potocki-Veroneseb,
Luc Choisnardd, Denis Wouessidjewed, Jean-Luc Putauxa,*
a Univ. Grenoble Alpes, CNRS, CERMAV, F-38000 Grenoble, France b TBI, Université de Toulouse, CNRS, INRAE, INSAT, F-31400 Toulouse, France c Department of Food Science, Penn State University, University Park, PA 16802, USA
d Univ. Grenoble Alpes, CNRS, DPM, F-38000 Grenoble, France
* corresponding author: jean-luc.putaux@cermav.cnrs.fr
† present address:
Ecole Centrale de Lyon, CNRS, LTDS, F-69134 Ecully, France
Published in: Carbohydrate Polymers 261 (2021), 117885
Abstract
Rectangular V-amylose single crystals were prepared by adding racemic ibuprofen to hot dilute aqueous solutions of native and enzymatically-synthesized amylose. The lamellar thickness increased with increasing degree of polymerization of amylose and reached a plateau at about 7 nm, consistent with a chain-folding mechanism. The CP/MAS NMR spectrum as well as base-plane electron and powder X-ray diffraction patterns recorded from hydrated specimens were similar to those of V-amylose complexed with propan-2-ol. Amylose was crystallized in an orthorhombic unit cell with parameters a = 2.824 ± 0.001 nm, b = 2.966 ± 0.001 nm, and
c = 0.800 ± 0.001 nm. A molecular model was proposed based on structural analogies with the
Vpropan-2-ol complex and on assumptions on the stoichiometry of ibuprofen. The unit cell would
contain four antiparallel 7-fold amylose single helices with ibuprofen molecules distributed inside and between the helices.
1. Introduction
Amylose is a mostly linear homopolymer of α(1,4)-D-glucose that is extracted from native starch granules (Buléon, Veronese, & Putaux, 2007). Amylose-like linear polymers can also be synthesized in vitro by amylose synthases such as amylosucrase (Potocki de Montalk et al., 2000) or starch phosphorylase (Ohdan, Fujii, Yanase, Takaha, & Kuriki, 2006). Amylose can be crystallized from solution by cooling or addition of a large variety of organic complexing agents (Putseys, Lamberts, & Delcour, 2010; Tomasik & Schilling, 1998). Depending on the molecular weight and concentration of amylose, nature and concentration of the complexing agent, and crystallization temperature, so-called "V-amylose" crystallosolvates with different morphologies and allomorphic structure are formed. In these crystals, the complexing molecules can be entrapped between amylose helices and/or inside their hydrophobic central cavity (Tan & Kong, 2020). This property can find applications, for instance, in the food industry (flavor encapsulation, texturing, etc.) or in pharmacology (vectorization, controlled release) (Carbinatto, Ribeiro, Colnago, Evangelista, & Cury, 2013; Conde-Petit, Escher, & Nuessli, 2006; Kumar & Loos, 2019; Lay Ma, Floros, & Ziegler, 2011).
β-cyclodextrins (β–CDs, cyclic oligo-amylose made of 7 α(1,4)-D-glucosyl units) have often been used to form inclusion compounds with various drugs in order to increase their solubility in water (Eddine, Fatiha, Amal, Leila, & Rachid, 2015). In particular, complexes of β-CDs with ibuprofen (IBU), a widely used non-steroidal anti-inflammatory, analgesic and antipyretic agent, have been studied (Mura et al., 1998; Salústio et al., 2012) and several methods to efficiently mix both constituents have been explored (Khan, Wazir, & Zhu, 2001; Pereva, Sarafska, Bogdanova, & Spassov, 2016). It was shown that IBU molecules enter the hydrophobic cavity of the β–CDs, replacing the initial water molecules (Pereva et al., 2016).
In line with the similitude with the hydrophobic inner cavity of cyclodextrins, the potential of the helical cavity of amylose to encapsulate poorly water-soluble bioactive molecules has also been considered (Cai, Yang, Zhang, & Wu, 2010; Feng et al., 2015; Janaswamy, 2004). In particular, recent articles have reported on the preparation of inclusion compounds with IBU by acidification of an alkaline amylose solution (Yang et al., 2013; Zhang et al., 2016) or by
in situ enzymatic polymerization (Yang et al., 2013). These studies agreed on the good in vitro stability of the complexes in a simulated gastric fluid and the gradual but sustained release of IBU by enzymatic degradation of the amylose matrix in a simulated intestinal medium (Yang et al., 2013; Zhang et al., 2016). Other studies have considered the entrapment of IBU in various types of starch matrices (Marinopolou, Papastergiadis, & Raphaelides, 2019; Mohammadi &
Moghaddas, 2020). However, while in some of these works, the X-ray diffraction profiles indicated the formation of a V-type semicrystalline complex, the crystallinity of the samples was very low. The substrates were mixtures of crystalline and amorphous regions in various amounts and it was not possible to estimate which fraction of the prepared substrates actually participated to the release experiments. The determination of a reliable molecular model supported by structural data collected from highly crystalline samples is mandatory in order to shed some light on the interaction of the guest molecules with the host amylose helices.
In this study, we have prepared model single crystals of VIBU complexes from dilute solutions
of native amylose and fractions of a shorter amylose-like polymer enzymatically synthesized
in vitro. The influence of parameters such as chain length, temperature, or amylose and ligand
concentration was investigated. The morphology, structure and thermal properties of the lamellar single crystals have been characterized by complementary imaging, diffraction, spectroscopy and calorimetry techniques, and the data have been used to propose a plausible molecular model of the VIBU crystalline complex.
2. Experimental section
2.1. Materials
Native potato amylose was purchased from Sigma-Aldrich and purified as previously described (Le, Choisnard, Wouessidjewe, & Putaux, 2018). Its weight-average degree of polymerization (𝐷𝑃$$$$$) was 2514 (Le, Choisnard, Wouessidjewe, & Putaux, 2021), so this # fraction will be referred to as DP2500 in the following. Using the method summarized in the Supplementary Data section, a linear amylose-like polymer was enzymatically synthesized
in vitro from sucrose by the amylosucrase from Neisseria polysaccharea, and subsequently
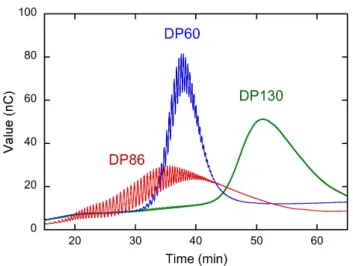
fractionated (Potocki-Veronese et al., 2005). We have selected fractions with 𝐷𝑃$$$$$ 60 and 130 # (referred to as DP60 and DP130) (Table 1 and Supplementary Data Fig. S1). Amylose fractions with 𝐷𝑃$$$$$ 28, 192 and 601 (referred to as DP30, DP200 and DP600, respectively) synthesized #
in vitro by a glycoside-phosphorylase were purchased from Shoko Co. Ltd (Japan). The
characteristics of all fractions are summarized in Table 1. Propan-2-ol and racemic ibuprofen ((RS)–2–(4–(2–methyl–propyl)phenyl) propanoic acid) were purchased from Sigma-Aldrich (Supplementary Data Scheme S1).
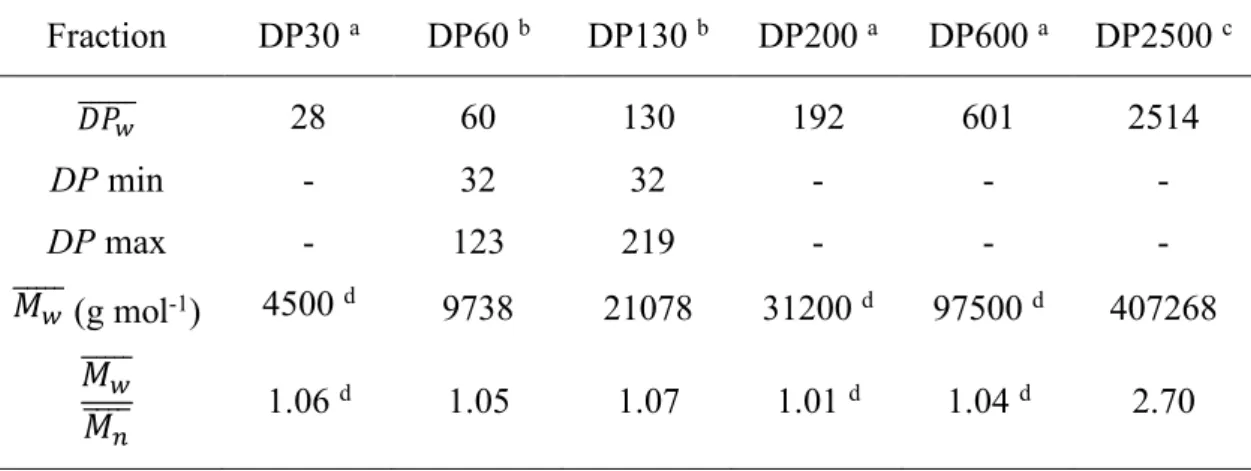
Table 1. Molecular characteristics of the amylose fractions used in this study. 𝐷𝑃$$$$$ is the #
weight-average degree of polymerization. 𝑀$$$$$ and 𝑀# $$$$ are the weight- and number-average & molecular weights, respectively.
Fraction DP30 a DP60 b DP130 b DP200 a DP600 a DP2500 c 𝐷𝑃# $$$$$$ 28 60 130 192 601 2514 DP min - 32 32 - - - DP max - 123 219 - - - 𝑀# $$$$$ (g mol-1) 4500 d 9738 21078 31200 d 97500 d 407268 𝑀# $$$$$ 𝑀& $$$$ 1.06 d 1.05 1.07 1.01 d 1.04 d 2.70
a synthesized in vitro by a glucoside-phosphorylase (Ohdan et al., 2006)
b synthesized in vitro by the amylosucrase from Neisseria polysaccharea (Potocki-Veronese et al., 2005) c native potato amylose characterized as described in Le et al. (2021)
d values provided by the manufacturer
2.2. Preparation of crystalline complexes and densimetry
Dilute aqueous amylose solutions (0.1 wt%) were prepared by dispersing 10 mg amylose in 10 mL ultrapure water. These suspensions were bubbled with nitrogen for 20 min, autoclaved for 30 min at 160 °C, cooled down to 90 °C and poured into glass tubes containing 0.04 wt% IBU preheated at 90 °C, above its melting temperature (Tm = 76 °C). The tubes were incubated
at a fixed temperature (50, 60 or 75 °C). After one week, the tubes were cooled down to room temperature (20 °C). The solid residues were recovered by slow centrifugation (500 rpm, 22 g) and washed three times with water saturated with IBU in order to preserve the crystal stability. In most cases, recrystallization steps were carried out to obtain larger and more individual single crystals. After the first crystallization, the reaction tubes were incubated at 90 °C for 1 h to partially dissolve the solid fraction, and the recrystallization was carried out for 2–3 days at the temperature used for the first crystallization. This treatment was repeated three times, then the tubes were allowed to cool down. Crystalline complexes were prepared with propan-2-ol for comparison. A DP2500 amylose solution (0.1 wt%) was mixed at 75 °C with 35 vol% preheated propan-2-ol and the solution was kept at 75 °C for one day. The resulting crystals were washed in a 65:35 (vol:vol) water:propan-2-ol mixture (Buléon, Delage, Brisson, & Chanzy, 1990).
Fragments of a film of VIBU crystals desorbed in a chamber maintaining a 95% relative
humidity (r.h.) were floated in 1,2-dichloroethane (d = 1250 g L-1) to which
1,1,2-trichloro-1,2,2-trifluoroethane (d = 1560 g L-1) was slowly added. When the fragments remained in
equilibrium in the mixture, the density was calculated as equal to that of the liquid which was measured using a pycnometer.
2.3. X-ray diffraction (XRD)
The crystallized fractions were centrifuged for 10 min at 12000 g. The wet pellets were deposited onto a 7-µm nylon bolting cloth (SaatiTech) and desorbed at 95% r.h. Strips of hydrated mats were introduced into glass capillaries (1.0 or 1.5 mm outer diameter) that were flame-sealed and fixed on collimators (0.25 or 0.50 mm in diameter). The capillaries were X-rayed in a Warhus vacuum camera using a Philips PW3830 generator operating at 30 kV and 20 mA (Ni-filtered CuKα radiation, λ = 0.1542 nm). Two-dimensional diffraction patterns were recorded on Fujifilm imaging plates, read with a Fujifilm BAS 1800-II bioimaging analyzer. Diffraction profiles were calculated by radially averaging the ring patterns. The sample-to-film distance was calibrated using a calcite standard. The unit cell parameters were calculated with the
CelRef module of the LMGP package (Laugier & Bochu, 2004).
2.4. Optical microscopy
Drops of crystal suspensions were deposited on glass slides and covered with glass slips. The specimens were observed in differential interference contrast mode with a Zeiss Axiophot II microscope equipped with polarized light. Images were recorded with an Olympus SC50 camera.
2.5. Transmission electron microscopy (TEM) and electron diffraction (ED)
Drops of dilute crystal suspensions were deposited on glow-discharged carbon-coated grids and allowed to dry. The specimens were observed under low dose illumination with a Thermo Scientific Philips CM200 Cryo microscope operating at 200 kV. For electron diffraction, the TEM grids were mounted on a Gatan 626 holder and fast-frozen into liquid nitrogen just after air drying of the excess liquid. Once in the microscope, the holder was cooled down with liquid nitrogen and the specimen observed at -177 °C. Images and ED patterns were recorded with a TVIPS TemCam F216 camera. ED patterns were recorded from selected areas of about 1 µm2
and calibrated with a gold-coated carbon film. The intensity of the diffraction spots was measured using the procedure described by Nishiyama et al. (Nishiyama et al., 2010). In view of the symmetry of the patterns, the intensities of hk0, -hk0, h-k0 and -h-k0 reflections were averaged.
2.6. Atomic force microscopy (AFM)
Droplets of dilute crystal suspensions were deposited on pieces of Si wafers and allowed to dry. AFM measurements were carried out with a Molecular Imaging Pico Plus microscope equipped with silicon probes having a nominal spring constant of 37 N m-1 and tip radius of
6 nm (ACT probes from AppNano). The data were recorded in tapping mode in air and analyzed using Gwyddion (Nečas & Klapetek, 2012). As detailed in Supplementary Data, topographic variations were determined after baseline correction by analyzing the height distribution over different regions of interest (ROIs) in several images (Fig. S2). For a good statistical distribution, a minimum of 20 ROIs were analyzed for each sample. The surface average roughness was calculated over 150 ´ 150 nm2 regions (512 ´ 512 pixels) of single crystals as:
𝑅( = *,+∑ (𝑍,+ 0− 𝑍̅)4 Eq. 1
where 𝑍̅ is the average height determined over the ROI.
2.7. Attenuated total reflectance Fourier-transform infrared spectroscopy (FTIR)
FTIR spectra of hydrated complexes (equilibrated at 95% r.h.) were recorded with a Perkin-Elmer Spectrum 2 FT-IR spectrophotometer in attenuated total reflection (ATR) mode. Measurements were done in the 4000–400 cm-1 range with a resolution of 2 cm-1. Eight repeat
scans were averaged for each spectrum.
2.8. Solid-state nuclear magnetic resonance (NMR) spectroscopy
Crystal suspensions were centrifuged. The excess liquid was blotted off and the hydrated pellets were packed into a zirconia rotor. Solid-state 13C NMR analyses were performed with a
Bruker Avance III 400 MHz spectrometer (13C frequency of 100.6 MHz) using magic angle
spinning (MAS) and cross-polarization (CP). The spinning speed was set at 12 kHz, with a sweep width of 29761 Hz and a recycle delay of 2 s. Each spectrum was averaged over about 6000 scans. The 13C chemical shifts were calibrated with respect to that of the glycine carboxyl
group (176.03 ppm). Single-pulse (SP) solid-state NMR experiments were carried out as well using a 13C 90° pulse of 4 µs and a delay time of 64 s.
2.9. Differential scanning calorimetry (DSC)
Samples (ca. 8 mg) mixed with deionized water (40 µL) were accurately weighed using a Mettler-Toledo XP2U ultra-microbalance and hermetically sealed in large-volume stainless
steel DSC pans (Perkin Elmer Pan Kit 0319-1525/1526/1535). Sample pans were scanned against an empty pan as reference in a Discovery differential scanning calorimeter (TA Instruments). The samples were heated from 10 to 150 °C, then cooled down to 5 °C, and immediately reheated to 150 °C, all steps carried out at a rate of 10 °C min-1.
2.10. Molecular modeling and structure refinement
Stereoregular left-handed 7-fold amylose helices with a pitch of 0.80 nm were generated from a α-D-glucosyl residue in the 4C
1 chair shape as described elsewhere (Nishiyama et al.,
2010) and energy-minimized using the Universal Force Field (Rappé, Casewit, Colwell, Goddard, & Skiff, 1992)in the Forcite module of Biovia Materials Studio 5.5and introduced into the unit cell with parameters and space group determined from the ED and XRD data. IBU and water molecules were distributed in the volumes of the unit cell not occupied by amylose chains and the complete system was energy-optimized again. During this step, the atomic coor-dinates of amylose were constrained and only IBU and water molecules were allowed to move.
The structure was then refined against experimental ED intensities using the SHELXL program (Sheldrick, 2015). The atomic scattering factors for electrons were taken from the International Tables for Crystallography (Cowley, Peng, Ren, Dudarev, & Whelan, 2004).
Finally, a two-dimensional base-plane ED pattern was calculated from the refined model by convoluting the calculated intensities with a Gaussian function. The similarity between the experimental and calculated patterns was evaluated using the reliability factor R defined as:
𝑅 = 1 − 6 𝑰89:∙𝑰<=><
‖𝑰89:‖ ‖𝑰<=><‖A
4
Eq. 2
where Iobs and Icalc are the observed and calculated intensities represented as a vector. The
components of vector I = (I1, I2, I3, ..., Ii, ..., In) are the intensities of the n reflections considered
in the calculation (Nishiyama et al., 2010). Since the location of the hydrogen atoms could not be determined from the experimental data, hydrogen bonds (H-bonds) were identified from the O...O distance, with a maximum of 0.35 nm. Similarly, the van der Waals interactions were detected from the distance between carbon atoms, with a maximum of 0.40 nm.
3. Results and discussion
3.1. Crystal morphology and influence of amylose DP
In a preliminary series of experiments, the formation of VIBU complexes was investigated
for 0.1 wt% amylose solutions containing 0.04 wt% IBU as a function of the 𝐷𝑃$$$$$ of amylose # and incubation temperature. The DP30 fraction did not form crystalline complexes whatever
the temperature. This result agreed with previous observations that a minimum chain length of amylose is required for the formation of stable helical complexes. This value was reported to vary between DP 20 and 40 depending on the complexing agent (Gelders, Vanderstukken, Goesaert, & Delcour, 2004; Godet, Bizot, & Buléon, 1995). The longer chains (DP200, DP600 and DP2500) formed complexes at all tested temperatures up to 75 °C, while DP60 and DP130 amylose only formed crystals at 50 and 60 °C.
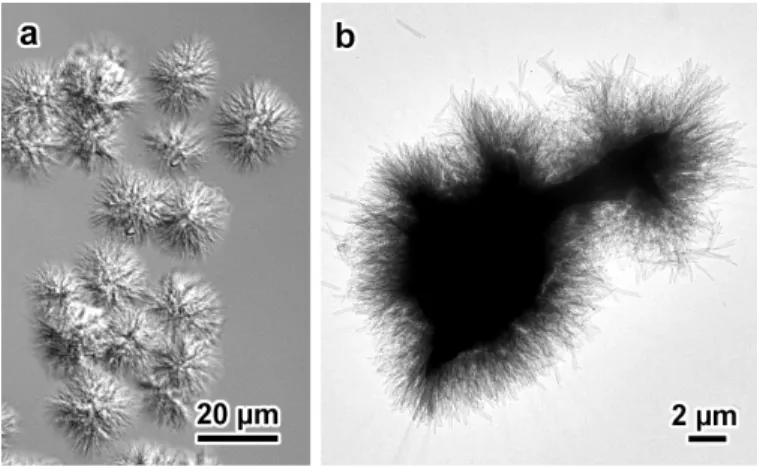
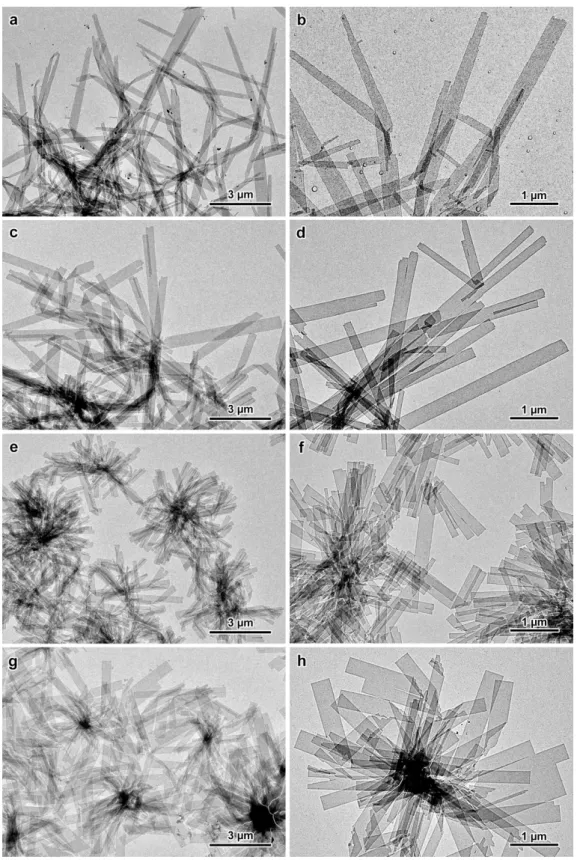
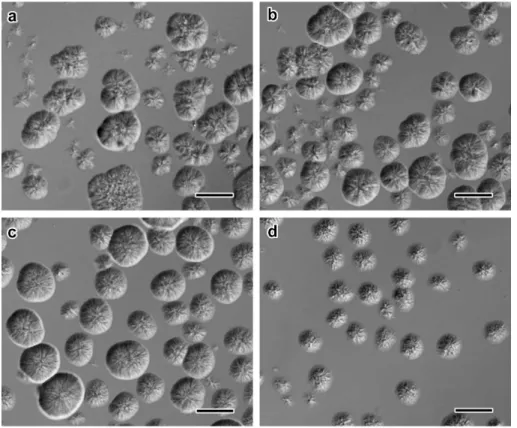
Interference contrast optical micrographs showed that the crystals developed in the form of sea urchin-like spheroidal aggregates of crystals radially growing from a common origin (Figs. 1a and S2). In low-magnification TEM images, slender crystals were seen radiating from thicker electron-opaque regions (Fig. 1b), while flower-like groups of several micrometer-long single lamellae with a more or less well-defined rectangular shape were observed at higher magnification. A higher temperature and shorter amylose chains were preferred to obtain larger and less densely associated single crystals (Fig. S3). However, an additional recrystallization treatment was used to produce more individual single crystals leading to an easier recording of selected area ED patterns. The morphology of the crystals varied with the DP of amylose: the lamellae were longer with the longer amylose chains (Fig. 2a-d) while they were shorter but with a better defined rectangular shape with the shorter chains (Figs. 2e-h and S3).
Figure 1. a) Interference contrast optical micrograph and b) low-magnification TEM image of aggregates of VIBU complexes (DP2500 amylose, CIBU = 0.04 wt%, incubation at 75 °C).
AFM images confirmed the lamellar morphology (Fig. 3a,b) and height distributions were determined over several ROIs (Fig. S4). While the surface roughness was similar for all samples (Rg = 0.7 nm), the lamellar thickness increased with increasing amylose DP (Fig. 3c), reaching
a plateau at 7.0 ± 0.4 nm for DP2500, in agreement with the chain folding mechanism described for flexible synthetic polymers(Hu, 2018) and amylose (Manley, 1964; Yamashita,1965).
3.2. Crystal structure
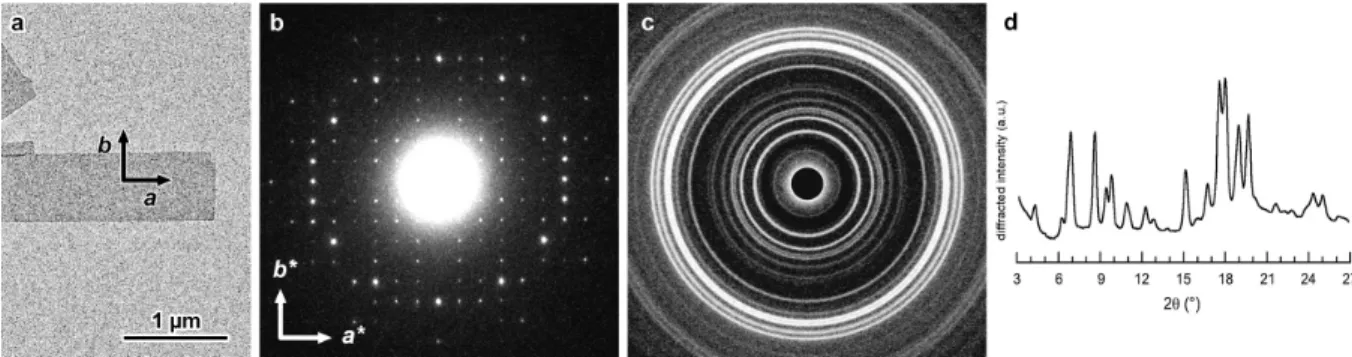
Base-plane ED patterns were recorded at low temperature from individual frozen-hydrated crystals. The typical diagram shown in Fig. 4 contains about 160 diffraction spots, up to a resolution of 0.34 nm, distributed along a rectangular network defined by two orthogonal reciprocal base vectors a* and b* of very close length. After calibration, the unit cell parameters were found to be a = 2.83 ± 0.01 nm and b = 2.96 ± 0.01 nm. Despite some differences in shape and size, the crystals prepared from all amylose fractions yielded similar ED patterns (Fig. S5a,b). The shape of the crystals, ED diagrams and unit cell parameters are very similar to those of Vpropan-2-ol crystals (Fig. S6a-c) (Buléon et al., 1990; Nishiyama et al., 2010;
Yamashita & Hirai, 1966) and consistent with earlier reports on V-amylose crystallized with different ligands such as thymol, carvacrol (Helbert, 1994), geraniol, fenchone, menthone (Nuessli, Putaux, Le Bail, & Buléon, 2003), linalool, terpineol (Putaux, Cardoso, Morin, Hu, & Dupeyre, 2008), or pentadecylphenol (Kumar & Loos, 2019).
In a typical XRD powder pattern (Fig. 4c) and corresponding profile (Fig. 4d) of hydrated VIBU crystals, the strongest peaks are located at diffraction angles 2θ = 6.9, 8.7, 15.2, 17.7, 18.1,
19.1 and 19.8° (Table S1). The XRD profile is nearly identical to that recorded from the Vpropan-2-ol complex (Fig. S6d) with minor variations in relative peak intensity. After calibration
and assuming an orthorhombic structure with P212121 space group, the unit cell parameters
were determined as a = 2.824 ± 0.001 nm, b = 2.966 ± 0.001 nm, and c = 0.800 ± 0.001 nm. No significant difference in terms of crystallinity could be observed between the XRD profiles of complexes prepared with the different amylose fractions (Fig. S5c), in agreement with what was concluded from ED patterns. Moreover, only minor differences in relative intensity of some reflections were observed between the ED patterns (Figs. 4b and S6c) and XRD profiles (Figs. 4d and S6d) recorded from VIBU and Vpropan-2-ol crystals.
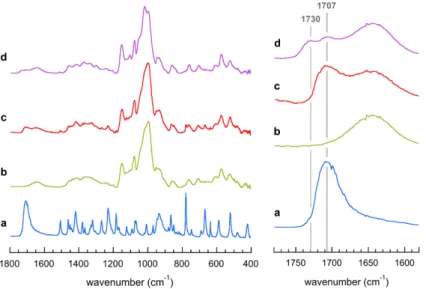
3.3. FTIR spectroscopy
The FTIR spectrum of VIBU crystals prepared from DP2500 amylose is shown in Fig. 5d and
compared to those of pure IBU, pure amylose and a physical mixture of amylose with 10 wt% IBU (Fig. 5a, 5b and 5c, respectively). The carbonyl group (C=O) stretching vibration band of pure IBU observed at 1707 cm-1 is present in the spectra of the physical mixture and VIBU but
a new band appeared at 1730 cm-1 in the spectrum of the complex. By analogy with the results
from several studies of complexes between IBU and β-cyclodextrins, the band at 1707 cm-1
Figure 2. TEM images of lamellar single crystals of V-amylose complexed with racemic IBU: a,b) DP2500 (native amylose); c,d) DP200; e,f) DP130; g,h) DP60. The incubation temperature was 75 °C for DP2500 and DP200, and 60 °C for the other fractions (CIBU = 0.04 wt%). For all
between carbonyl groups, while the band at 1730 cm-1 would be attributed to less structured
H-bonded carbonyls of IBU molecules well-dispersed within the amylose scaffold (Braga, Gonçalves, Herdtweck, & Teixeira-Dias, 2003; Bratu, Hernanz, Gavira, & Bora, 2005; Mura
et al.,1998). The band assigned to aromatic C-C stretching shifted from 1507 cm-1 in pure IBU
or the physical mixture to 1512 cm-1 in the complexes. Several bands attributed to IBU that still
appeared in the physical mixture, disappeared from the VIBU spectrum. This is the case for
absorbances at 669 and 779 cm-1, attributed to the deformation of the out-of-plane aromatic
C-H bonds of the IBU benzene group (Ghorab & Adeyeye, 2001) and bands that correspond to aromatic C–C stretching (1451 cm-1), O–H bending (1418 and 934 cm-1), C–O stretching
(1268–1123 cm-1) and in-plane C–H bending (1091–1007 cm-1) (Coates, 2006).
Figure 3. Typical AFM images of lamellar single crystals of DP200 (a) and DP60 (b) amylose complexed with IBU (CIBU = 0.04 wt%, incubation at 75 °C for DP200 and 60°C for DP60);
c) average lamellar thickness calculated from height profiles over several regions of interest in the images as a function of amylose 𝐷𝑃$$$$$. The error bars correspond to standard deviations. #
Figure 4. a) TEM image of a lamellar single crystal of DP60 amylose complexed with IBU; b) corresponding base-plane ED pattern recorded from a frozen-hydrated crystal; c) XRD powder pattern of hydrated VIBU crystalline complexes (DP2500); d) corresponding XRD profile.
Figure 5. ATR-FTIR absorbance spectra of racemic IBU (a), native amylose (b), physical mixture of amylose and 10 wt% IBU (c) and VIBU crystalline complexes (d). The series on the
right focuses on the 1780–1580 cm-1 region corresponding to the contribution of carbonyl groups.
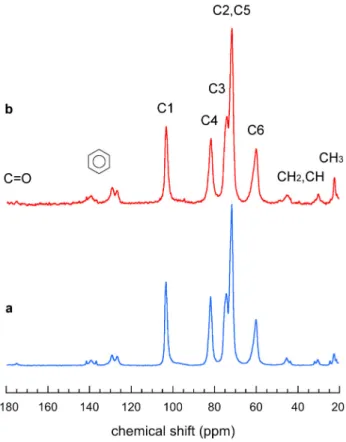
3.4. 13C CP/MAS and SP/MAS NMR spectroscopy
The 13C CP/MAS NMR spectra of hydrated V
IBU and Vpropan-2-ol crystals are shown in
Figs. 6a and S7, respectively. The peaks in the carbohydrate region (55–100 ppm) can be assigned to the carbons of the glucosyl ring and it was suggested that the position of the carbon C1 resonance was a signature of the number of glucosyl units per turn in the amylose helix (Gidley & Bociek, 1988; Le Bail, Rondeau, & Buléon, 2005). This resonance located at 103.3 and 103.4 ppm for Vpropan-2-ol and Vmenthone complexes, respectively (Le Bail et al., 2005), was
proposed to correspond to a packing of 6-fold helices (Biais, Le Bail, Robert, Pontoire, & Buléon, 2006). However, it was later demonstrated that the Vpropan-2-ol complex actually
contained 7-fold helices (Nishiyama et al., 2010). The C1 resonance of our VIBU and Vpropan-2-ol
samples was located at 103.4 and 103.3 ppm, respectively (Figs. 6 and S7), which provides another indication of the occurrence of 7-fold helices in their crystal structure, in agreement with the recent conclusion of Gao et al. (Gao, Zhang, Qiu, Fu, & Huang, 2020) for complexes with menthone and thymol.
The VIBU spectrum broadly resembles that recorded by Zhang et al. in the 40–120 ppm region
(Zhang et al., 2016) although the resolution is higher in our case since our sample was significantly more crystalline. The contributions of guest IBU molecules appear at 20–50 ppm (aliphatic carbons) and 123–143 ppm (aromatic carbons). The peak corresponding to carbonyl groups (C=O), located at 181–183 ppm in the spectrum of pure bulk ibuprofen (Azaïs et al., 2009;
Figure 6. 13C CP/MAS (a) and SP/MAS (b) solid-state NMR spectra of hydrated VIBU
crystalline complexes (DP2500 amylose, CIBU = 0.04 wt%, incubation at 75 °C).
Carignani, Borsacchi, & Geppi, 2011), is absent from the VIBU spectrum, confirming that the
excess IBU was properly rinsed out during sample preparation. Instead, the small peak of carbonyl carbons is shifted upfield (173–177 ppm), which is consistent with what was reported for crystalline complexes of IBU and b–CDs (Braga et al., 2003). The region corresponding to aromatic carbons contains a triplet at 141.6, 139.3 and 136.7 ppm, and a doublet at 129.3 and 126.7 ppm. The C6 resonance that characterizes the orientation distribution of the hydroxymethyl group in amylose is maximum at 60.0 ppm for VIBU (Fig. 6) and 60.1 ppm for Vpropan-2-ol (Fig. S7).
Similar values were reported for complexes with propan-2-ol, menthone and linalool that have a similar crystal structure (Le Bail et al., 2005; Rondeau-Mouro, Le Bail, & Buléon, 2004).
The SP/MAS NMR spectrum of VIBU was recorded to quantify the guest included in the
complex (Fig. 6b). The contribution of IBU is more pronounced than that in the CP/MAS NMR spectrum (Fig. 6a). Such a difference between the CP and SP spectra likely results from a significant mobility of the IBU molecules within the crystal lattice. By deconvoluting the entire C1 resonance between 93 and 110 ppm to separate the contributions from complexed and amorphous amylose (Tan, Flanagan, Halley, Whittaker, & Gidley, 2007), we found that 80 %
of the C1 resonance could be attributed to the complex (Fig. S8).Assuming that all IBUs were included in the V-type crystals, the stoichiometry between IBU and glucosyl residues, calculated as the ratio of the integral area of the C1 contribution of amylose (93-110 ppm) to those from aromatic carbons of IBU (123–143 ppm), was calculated to be about 1:8.4. The ratio was 1:7.6 when the region of aliphatic carbons from IBU (16–50 ppm) was considered instead.
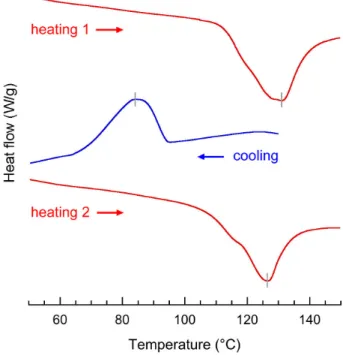
Figure 7. DSC thermograms of VIBU complexes crystallized from a 0.1 wt% DP2500 amylose
solution at 75 °C (CIBU = 0.04 wt%). The specimen was reheated (heating 2) after the first
heating / cooling cycle.
3.5. Thermal properties
DSC thermograms of VIBU complexes crystallized from a 0.1 wt% DP2500 amylose solution
at 75 °C (CIBU = 0.04 wt%) revealed an endotherm with a peak maximum at 130.8 °C with a
transition enthalpy of 24.15 J g-1 (Fig. 7). This transition enthalpy is nearly identical to that
observed for complexes of a–L–lysophosphatidylcholine with potato amylose leached from common maize starch at saturation (Creek, Benesi, Runt, & Ziegler, 2007), suggesting a near maximum complexation with ibuprofen. An exotherm with an onset temperature of 94.2 °C and peak maximum at 83.8 °C was observed on cooling at 10 °C min-1, with a transition enthalpy
of 15.05 J g-1. Reheating revealed an endotherm at 126.1 °C with a transition enthalpy of
19.4 J g-1. The rapid crystallization in the calorimeter on cooling resulted in 80% of the
slightly less stable crystalline form with a lower peak endotherm temperature, as could be expected. A shoulder could be seen on both endotherms at about 115 °C, indicating two different thermal events of varying stability. However, the endotherm observed upon reheating the sample after the rapid recrystallization in the DSC was nearly similar to the one recorded during the first heating of the initial complex that was prepared from a dilute solution and with a much slower crystallization. This suggests that the two populations of VIBU complexes do not
correspond to different crystal types but rather to IBU molecules with differing interactions with amylose, as one might expect from intra- and interhelical guests. By deconvoluting the endotherm on reheating between 80 and 156.5 °C, it was determined that 87 % of the enthalpy could be attributed to the more stable (i.e. higher temperature) complexed amylose helices, presumably those with intrahelical IBU molecules.
3.6. Molecular modeling, structure refinement and interaction analysis
Considering the similarities in morphology, diffraction and spectroscopy features of VIBU
and Vpropan-2-ol crystals and since the position of the C1 peak in the 13C CP/MAS spectrum was
consistent with a 7-fold amylose helix, we used the model proposed by Nishiyama et al. for Vpropan-2-ol complexes as a suitable basis to build a plausible model of VIBU. In this orthorhombic
unit cell, the helix arrangement can be described by two alternating groups of four left-handed single helices, organized into nearly close-packed and tetragonal motifs, respectively (Fig. S9) (Nishiyama et al., 2010). This specific organization of 7-fold helices was recently referred to as V7II, as opposed to V7I that would correspond to a pseudo-hexagonal arrangement of
close-packed helices (Le, Choisnard, Wouessidjewe, & Putaux, 2019). In Vpropan-2-ol, water and
propan-2-ol molecules are located inside the helices and in-between (Fig. S9).
As detailed in the Experimental Section, we have first built a model containing stereoregular left-handed 7-fold amylose helices located at the same positions as those in the Vpropan-2-ol unit
cell (Fig. S10a). This amylose scaffold contains two types of voids which dimensions in cross section are suitable to host guest molecules. One corresponds to the columnar cavity inside the helices and the other to the two interhelical channels, both types of cavities being parallel to the
c-axis of the unit cell. In this preliminary modeling study, we have only considered the case of
(S)-(+)-ibuprofen (S-IBU) as a guest since it is the pharmacologically active form (Scheme S1b). Since one S-IBU molecule is longer than the helical repeat of the amylose helix, a supercell larger than the unit cell along c was built, that contained 3 helical turns, each cavity hosting 2 S-IBU molecules. In each model, consistent with the shape and size of the intra- and
interhelical cavities, the guests were broadly aligned with the helical axis of amylose. Inside all helices, the carboxyl group of S-IBU pointed in the same direction as the reducing end of the amylose chain while, in one interhelix cavity, IBUs were all up and in the other, all down.
The relative amounts of S-IBU and water in the supercell were adjusted from the experimental density of the crystals (1.41 g cm-3 measured by densimetry). Since several
IBU:water ratios satisfied the density value, we chose the following one: 2 S-IBUs were hosted in each helix while 2 S-IBUs were located in each interhelical cavity. The remaining free interhelical space was filled with water molecules. The supercell thus contained a total of 84 glucosyl residues in the amylose helices, 8 intrahelical and 4 interhelical S-IBUs, and 56 interhelical water molecules, corresponding to a calculated density of 1.41 g cm-3 and an overall
stoichiometry of 1 S-IBU for 7 glucosyl units. Although this ratio is a little higher than that determined from the analysis of 13C SP/MAS NMR data, it corresponds to the maximal loading
of the drug in the structure, our goal being to provide a model that can be used later to understand the release profiles of the drug in various media.
The model was first energy-minimized (Fig. S10b) then refined against ED data to a resolution of 0.31 nm, using SHELXL. The final model is shown in Fig. 8 and the corresponding calculated base-plane ED pattern is in very good agreement with the experimental pattern (R = 0.053 calculated with Eq. 2) (Fig. 9). In this structure, the amylose helices have lost their strict stereoregularity as suggested by the dispersion of the torsion angles around the glycosidic linkages and the hydroxymethyl conformation (Table S2), which results from their local conformational adaptation to the presence of the guest (Table S3). S-IBU molecules deviate from their intrinsically most stable forms established by density functional theory (DFT) modeling and their solution conformation studied by NMR (Di Pietro, Celebre, Aroulanda, Merlet, & De Luca, 2017). The conformation of S-IBU can be defined by three torsion angles (Scheme S2). In particular, the T1 and T2 angles describe the orientation of the two substituents with respect to the aromatic ring. In the minima of the internal energy of IBU, the bulky groups carried by the carbons directly linked to the aromatic ring must be distant from the ring, with T1 and T2 close to 120 and 60°, respectively. In our model, they deviate by 30° from their ideal value. Such deviation has also been observed in the crystalline structure of
S-IBU (Freer, Bunyan, Shankland, & Sheen, 1993).
The VS-IBU crystal is strongly stabilized by a large number of intermolecular direct and indirect
H-bonds between amylose helices, the latter being mediated by water molecules (Fig. S11a). In addition, the interaction between amylose chains and S-IBU mainly involves dispersion forces, as suggested by the large number of van der Waals contacts (Fig. S11b).
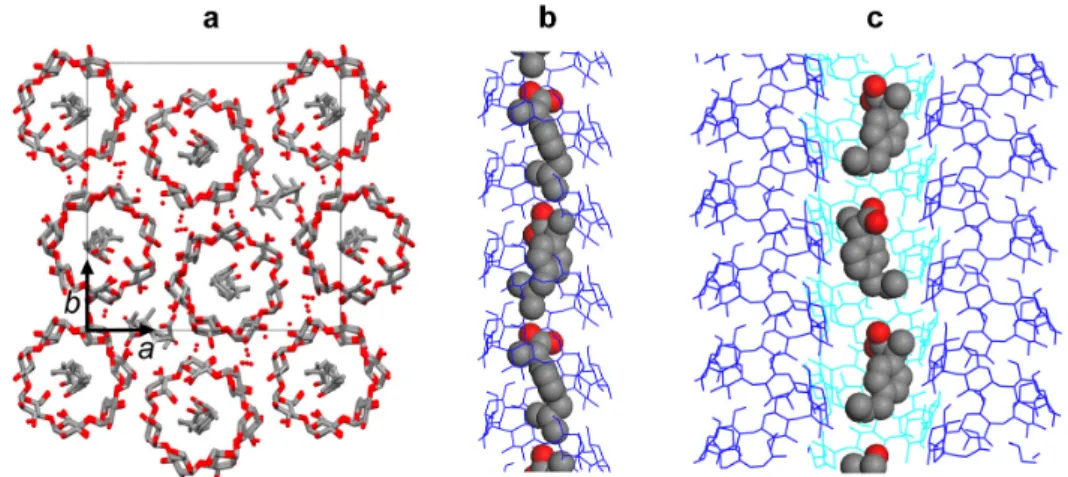
Figure 8. a) Axial view of the tentative molecular model of the VS-IBU complex. The position
of the 7-fold amylose helices in the unit cell corresponds to that determined for the Vpropan-2-ol
complex(Nishyama et al., 2010). S-IBU and water molecules are distributed inside the helices and in-between. The hydrogen atoms have been omitted for clarity. b,c) Longitudinal views of the model highlighting the location and conformation of S-IBU in the intra- and interhelical cavities (b and c, respectively). Amylose helices are drawn as a blue wireframe. The water molecules and hydrogen atoms have been omitted.
Figure 9. Comparison of the experimental base-plane ED pattern recorded at low temperature from one VIBU crystal (exp) with that calculated from the VS-IBU model in Fig. 8 (calc).
4. Conclusion
Highly crystalline lamellar complexes were successfully prepared from dilute amylose solutions incubated in the presence of racemic ibuprofen. The single crystal "quality" was optimized by adjusting the amount of added IBU, the incubation temperature, and by
performing recrystallization steps. The DP of the amylose fraction (native or biosynthesized
in vitro) had an impact on the morphology of the lamellar crystals (size, thickness, aspect ratio)
but no significant effect was noted regarding the crystallinity. The base-plane ED and powder XRD data, used to determine the P212121 space group and unit cell parameters of the
orthorhombic crystal, along with the 13C CP/MAS NMR spectrum consistent with the
occurrence of a 7-fold amylose helix, suggested that the VIBU and Vpropan-2-ol complexes were
isomorphous. Consequently, we proposed a plausible molecular model based on the features of the Vpropan-2-ol complex and that contains four 7-fold antiparallel left-handed single helices per
unit cell. IBU molecules are hosted inside the helical cavity but also in the interhelical space along with a number of water molecules. After refinement of the model against ED data, the calculated base-plane ED pattern showed a very good agreement with the experimental pattern, thus validating the 2D projection of the proposed structure, and particularly the distribution of left-handed 7-fold helices within the unit cell. However, the three-dimensional molecular description should still be considered with caution since i) only S-IBU was tested as a guest, ii) no diffraction data along the c-axis was used in the ED-based SHELXL refinement, iii) the stoichiometry of IBU and water in the complex is not known with precision, and iv) for simplicity, the ratio between the number of IBUs and helical repeats was chosen in order to minimize the size of the tested supercell. Considering the assumptions made to build our preliminary model, a more thorough molecular modeling study will be carried out to account for other possibilities regarding the chirality (S or R enantiomer, or both) and the orientation (up or down, both or random) of the guest, as well as the location and stoichiometry of IBU and water molecules.
So far, the structures of the V-type allomorphs that have been solved from diffraction data were always based on left-handed amylose single helices (Brisson, Chanzy, & Winter, 1990, Nishiyama et al., 2010), which raises the question of a possible chiral selectivity of ligands by the amylose scaffold. Indeed, while the chiral selectivity of S-IBU by β-cyclodextrins was demonstrated (Núñez-Agüero, Escobar-Llanos, Díaz, Jaime, & Garduño-Juárez, 2006) and studied for short amylodextrins (Hong, Soini, Baker, & Novotny, 1998) and maltodextrins (Garnero, Aloisio, & Longhi, 2013), the question is still open for single-helical amylose in the form of crystalline complexes. Finally, the V7II structural model proposed in this work for VIBU
complexes, and in particular, the location of the guest within the amylose scaffold, should serve as a basis to understand the in vitro release properties of ibuprofen in controlled media that mimic the gastro-intestinal environment.
Acknowledgements
We thank LabEx ARCANE and CBH-EUR-GS (grant agreement #ANR-17-EURE-0003) for funding the PhD thesis of C.A.K.L, the Glyco@Alps program (grant agreement #ANR-15-IDEX-02), the NanoBio-ICMG Platform (FR 2607, Grenoble) for granting access to the AFM, NMR and TEM facilities, and Henri Chanzy (CERMAV) for stimulating discussions and critical reading of the manuscript.
References
Azaïs, T, Hartmeyer, G., Quignard, S., Laurent, G., Tourné-Péteilh, C., Devoisselle, J.-M., & Babonneau, F. (2009). Solid-state NMR characterization of drug-model molecules encapsulated in MCM-41 silica. Pure Applied Chemistry, 81, 1345–1355.
Biais, B., Le Bail, P., Robert, P., Pontoire, B., & Buléon, A. (2006). Structural and stoichiometric studies of complexes between aroma compounds and amylose. Polymorphic transitions and quantification in amorphous and crystalline areas.
Carbohydrate Polymers, 66, 306–315.
Braga, S.S., Gonçalves, I.S., Herdtweck, E., & Teixeira-Dias, J.J.C. (2003). Solid state inclusion compound of S-ibuprofen in β-cyclodextrin: structure and characterization.
New Journal of Chemistry, 27, 597–601.
Bratu, I., Hernanz, A., Gavira, J.M., & Bora, G.H. (2005). FT-IR spectroscopy on inclusion complexes of β-cyclodextrin with fentbufen and ibuprofen. Romanian Journal of Physics,
50, 1063–1069.
Brisson, J., Chanzy, H., & Winter, W.T. (1991). The crystal and molecular structure of VH
amylose by electron diffraction analysis, International Journal of Biological
Macromolecules, 13, 31–39.
Buléon, A., Delage, M.-M., Brisson, J. & Chanzy, H. (1990). Single-crystals of V-amylose complexed with isopropanol and acetone. International Journal of Biological
Macromolecules, 12, 25–33.
Buléon, A., Veronese, G., & Putaux, J.-L. (2007). Self-association and crystallization of amylose. Australian Journal of Chemistry, 60, 706–718.
Cai, X., Yang, L., Zhang, L.-M. & Wu, Q. (2010). Evaluation of amylose used as a drug delivery carrier. Carbohydrate Research, 345, 922–928.
Carbinatto, F.M., Ribeiro, T.S., Colnago, L.A., Evangelista, R.C., & Cury, B.S.F. (2016). Preparation and characterization of amylose inclusion complexes for drug delivery applications. Journal of Pharmaceutical Sciences, 105, 231–241.
Carignani, E., Borsacchi, S., & Geppi, M. (2011). Dynamics by solid-state NMR: Detailed study of ibuprofen Na salt and comparison with ibuprofen. Journal of Physical Chemistry
A, 115, 8783–8790.
Coates, J. (2006). Interpretation of infrared spectra, a practical approach. In "Encyclopedia of
Analytical Chemistry", R.A. Meyers ed., John Wiley & Sons.
Conde-Petit, B., Escher, F., & Nuessli, J. (2006). Structural features of starch-flavor
complexation in food model systems. Trends in Food Science and Technology, 17, 227–235. Cowley, J.M., Peng, L.M., Ren, G., Dudarev, S.L., & Whelan, M.J. (2004). Parameterizations
of electron atomic scattering factors. In International Tables for Crystallography. Volume C: Mathematical, Physical and Chemical Tables, Prince E. & Wilson A. J. C. Eds., Kluwer Academic Publishers, p 282.
Creek, J.A., Benesi, A., Runt, J., & Ziegler, G.R. (2007). Potential sources of error in the
calorimetric evaluation of amylose content of starches. Carbohydrate Polymers, 68, 465–471. Di Pietro, M.E., Celebre, G., Aroulanda, C., Merlet, D., & De Luca, G. (2017). Assessing the
stable conformations of ibuprofen in solution by means of Residual Dipolar Couplings.
European Journal of Pharmaceutical Sciences, 106, 113–121.
Eddine, Z.K., Fatiha, M., Amal, Z., Leila, N., & Rachid, M. (2015). Investigation of the inclusion complex of tolfenamic acid with β-cyclodextrin: Geometry and NBO analysis.
Comptes Rendus Chimie, 18, 193–198.
Feng, T., Liu, F., Wang, X., Zhuang, H., Ye, R., Rong, Z., & Liu, Y. (2015). Evaluation of different analysis methods for the encapsulation efficiency of amylose inclusion compound. International Journal of Polymer Science, 2015, 645916.
Freer, A.A., Bunyan, J.M., Shankland, N., & Sheen, D.B. (1993). Structure of (S)-(+)-ibuprofen. Acta Crystallographica C, 49, 1378–1380.
Gao, Q., Zhang, B., Qiu, L., Fu, X. & Huang, Q. (2020). Ordered structure of starch inclusion complex with C10 aroma molecules. Food Hydrocolloids, 108, 105969.
Garnero, C., Aloisio, C., & Longhi, M. (2013). Ibuprofen-maltodextrin interaction: Study of enantiomeric recognition and complex characterization. Pharmacology and Pharmacy, 4, 18–30.
Gelders, G.G., Vanderstukken, T.C., Goesaert, H., & Delcour, J.A. (2004). Amylose–lipid complexation: a new fractionation method. Carbohydrate Polymers, 56, 447–458.
Ghorab, M.K., & Adeyeye, M.C. (2001). Elucidation of solution state complexation in wet-granulated oven-dried ibuprofen and β-cyclodextrin: FT-IR and 1H-NMR studies, Pharmaceutical Development and Technology, 6, 315–324.
Gidley, M.J., & Bociek, S.M. (1988). 13C CP/MAS NMR studies of amylose inclusion
complexes, cyclodextrins, and the amorphous phase of starch granules: Relationships between glycosidic linkage conformation and solid-state 13C chemical shifts. Journal of the American Chemical Society, 110, 3820–3829.
Godet, M.C., Bizot, H., & Buléon, A. (1995). Crystallization of amylose-fatty acid complexes prepared with different amylose chain lengths. Carbohydrate Polymers, 27, 47–52. Helbert, W. (1994). Données sur la structure du grain d'amidon et des produits de
recristallisation de l'amylose, Doctoral degree dissertation, Université Joseph Fourier, Grenoble, France.
Hong, M., Soini, H., Baker, A., & Novotny, M.V. (1998). Complexation between amylodextrin oligomers and selected pharmaceuticals measured through capillary electrophoresis. Analytical Chemistry, 70, 3590–3597.
Hu, W. (2018). The physics of polymer chain-folding. Physics Reports, 747, 1–50. Janaswamy, S. (2014). Encapsulation altered starch digestion: Toward developing
starch-based delivery systems. Carbohydrate Polymers, 101, 600–605.
Khan, G.M., Wazir, F, & Zhu, J. (2001). Ibuprofen β-cyclodextrin inclusion complexes: Evaluation of different complexation methods. Journal of Medical Sciences, 1, 193–199. Kumar, K., & Loos, K. (2019). Deciphering structures of inclusion complexes of amylose
with natural phenolic amphiphiles. ACS Omega, 4, 17807–178013.
Laugier, J., & Bochu, B. (2004). LMGP-Suite: Suite of programs for the interpretation of X-ray experiments. http://www.cristal.org/DU-SDPD/nexus/ccp14/web/tutorial/lmgp/ Lay Ma, U.V., Floros, J.D., & Ziegler, G.R. (2011). Formation of inclusion complexes of starch
with fatty acid esters of bioactive compounds. Carbohydrate Polymers, 83, 1869–1878. Le Bail, P., Rondeau, C., & Buléon, A. (2005). Structural investigation of amylose complexes
with small ligands: helical conformation, crystalline structure and thermostability.
International Journal of Biological Macromolecules, 35, 1–7.
Le, C.A.K., Choisnard, L., Wouessidjewe, D., & Putaux, J.-L. (2018). Polymorphism of crystalline complexes of amylose with fatty acids. International Journal of Biological
Le, C.A.K., Choisnard, L., Wouessidjewe, D., & Putaux, J.-L. (2019). Single crystals of V-amylose complexed with bicyclic organic compounds. Macromolecular Symposia,
386, 190007.
Le, C.A.K., Choisnard, L., Wouessidjewe, D., & Putaux, J.-L. (2021). Polymorphism of V-amylose co-crystallized with aliphatic diols. Polymer, 213, 123302.
Manley, R.St.J. (1964). Chain folding in amylose crystals. Journal of Polymer Science: Part
A, 2, 4503–4515.
Marinopoulou, A., Papastergiadis, E., & Raphaelides, S.N. (2019). Inclusion complexes of non-granular maize starch with fatty acids and ibuprofen. A comparative study of their morphology and structure. Starch/Stärke, 71, 1800100.
Mohammadi, A., & Moghaddas, J. (2020). Mesoporous starch aerogels production as drug delivery matrices: synthesis optimization, ibuprofen loading, and release property.
Turkish Journal of Chemistry, 44, 633–614.
Mura, P., Bettinetti, G.P., Manderioli, A., Faucci, M.T., Bramanti, G., & Sorrenti, M. (1998). Interactions of ketoprofen and ibuprofen with β-cyclodextrins in solution and in the solid state. International Journal of Pharmaceutics, 166, 189–203.
Nečas, D., & Klapetek P. (2012). Gwyddion: an open-source software for SPM data analysis.
Central European Journal of Physics, 10, 181–188.
Nishiyama, Y., Mazeau, K., Morin, M., Cardoso, M.B., Chanzy, H., & Putaux, J.-L. (2010). Molecular and crystal structure of 7-fold V-amylose complexed with 2-propanol.
Macromolecules, 43, 8628–8636.
Nuessli, J., Putaux, J.-L., Le Bail, P., & Buléon, A. (2003). Crystal structure of amylose complexes with small ligands. International Journal of Biological Macromolecules, 33, 227–234. Núñez-Agüero, C.-J., Escobar-Llanos, C.-M., Díaz, D., Jaime, C., & Garduño-Juárez, R.
(2006). Chiral discrimination of ibuprofen isomers in β-cyclodextrin inclusion
complexes: experimental (NMR) and theoretical (MD, MM/GBSA) studies. Tetrahedron
62, 4162–4172.
Ohdan, K., Fujii, K., Yanase, M., Takaha, T., & Kuriki, T. (2006). Enzymatic synthesis of amylose. Biocatalysis and Biotransformation, 24, 77–81.
Pereva, S., Sarafska, T., Bogdanova, S., & Spassov, T. (2016). Efficiency of "cyclodextrin-ibuprofen" inclusion complex formation. Journal of Drug Delivery Science and
Potocki de Montalk, G., Remaud-Siméon, M., Willemot, R.M., Sarçabal, P., Planchot, V., & Monsan, P. (2000). Amylosucrase from Neisseria polysaccharea: novel catalytic
properties. FEBS Letters, 471, 219–223.
Potocki-Veronese, G., Putaux, J.-L., Dupeyre, D., Albenne, C., Remaud-Simeon, M., Monsan, P., & Buléon, A. (2005). Amylose synthesized in vitro by amylosucrase: Morphology, structure, and properties. Biomacromolecules, 6, 1000–1011.
Putaux, J.-L., Cardoso, M.B., Morin, M., Hu, Y., & Dupeyre, D. (2008). Single crystals of V-amylose inclusion complexes. Macromolecular Symposia, 273, 1–8.
Putseys, J.A., Lamberts, L., & Delcour, J.A. (2010). Amylose-inclusion complexes: Formation, identity and physico-chemical properties. Journal of Cereal Science, 51, 238–247. Rappé, A.K., Casewit, C.J., Colwell, K., Goddard, W.A. III, & Skiff, W.M. (1992). UFF, a
full periodic table force field for molecular mechanics and molecular dynamics simulations, Journal of the American Chemical Society, 114, 10024–10035.
Rondeau-Mouro, C., Le Bail, P., & Buléon, A. (2004). Structural investigation of amylose complexes with small ligands: inter- or intra-helical associations? International Journal
of Biological Macromolecules, 34, 251–257.
Salústio, P.J., Feio, G., Figueirinhas, J.L., Cabral-Marques, H.M., Costa, P.C., & Pinto, J.F. (2012). Release profile of ibuprofen in β-cyclodextrin complexes from two different solid dosage forms. Powder Technology, 221, 245–251.
Sheldrick, G.M. (2015). Crystal structure refinement with SHELXL. Acta Crystallographica
C, 71, 3–8.
Tan, I., Flanagan, B.M., Halley, P.J., Whittaker, A.K., & Gidley, M.J. (2007). A method for estimating the nature and relative proportions of amorphous, single, and double-helical components in starch granules by C-13 CP/MAS NMR. Biomacromolecules, 8, 885–891. Tan, L., & Kong, L. (2020). Starch-guest inclusion complexes: Formation, structure, and
enzymatic digestion. Critical Reviews in Food Science and Nutrition, 60, 780–790. Tomasik, P., & Schilling, C.H. (1998). Complexes of starch with organic guests. Advances in
Carbohydrate Chemistry and Biochemistry, 53, 345–426.
Yamashita, Y. (1965). Single crystals of amylose V complexes. Journal of Polymer Science:
Part A, 3, 3251–3260.
Yamashita, Y., & Hirai, N. (1966). Single crystals of amylose V complexes. II. Crystals with 71 helical configuration. Journal of Polymer Science: Part A-2, 4, 161–171.
Yang, L., Zhang, B,. Yi, J., Liang, J., Liu, Y., & Zhang, L.-M. (2013). Preparation, characterization, and properties of amylose-ibuprofen inclusion complexes.
Starch/Stärke, 65, 593–602.
Zhang, L., Cheng, H., Zheng, C., Dong, F., Man, S., Dai, Y., & Yu, P. (2016). Structural and release properties of amylose inclusion complexes with ibuprofen. Journal of Drug
Supplementary Data
Scheme S1. Chemical structure of amylose (a), (S)-(+)-ibuprofen (b) and (R)-(-)-ibuprofen (c), drawn with MarvinSketch (https://chemaxon.com/products/marvin).
Preparation of amylose by in vitro biosynthesis with amylosucrase – Fractionation and chain length determination:
The reaction was performed at 30 °C in a 50 mM Tris-HCl buffer at pH 8.0 containing 0.5 U mL-1 of purified amylosucrase from Neisseria polysaccharea and 100 mM sucrose
(Potocki-Veronese et al., 2005). After 24 h, amylose was precipitated from the reaction medium with 1/4 volume of propan-2-ol at 4 °C for 12 h, and collected by centrifugation (2500 g, 20 min). Part of the total fraction containing chains with a DP ranging from 15 to 220 (𝐷𝑃$$$$$ 86) # was dissolved in DMSO 10 % (w/v) and was further fractionated by means of preparative size-exclusion chromatography (SEC) using a 3L column of Biogel P6DG (Biorad). Sugars were eluted with water at 60 °C using a flow rate of 10 mL min-1. High-performance anion-exchange
chromatography with pulsed amperometric detection (HPAEC-PAD) was used to determine the DP distribution of each fraction after dissolution in 1 N NaOH.
Figure S1. HPAEC-PAD chromatograms of the total fraction of amylose (DP86) synthesized
in vitro by amylosucrase and the fractions (DP60 and DP130) obtained by fractionation of
Figure S2. Influence of the DP of amylose on the morphology of the aggregates formed by crystallization with ibuprofen: a) DP2500 (native amylose); b) DP600; c) DP200; d) DP60 (0.1 wt% amylose, CIBU = 0.04 wt%, incubation at 60 °C). Interference contrast optical
Figure S3. Influence of the DP of amylose and incubation temperature on the morphology of the aggregates of VIBU crystals (0.1 wt% amylose solutions, CIBU = 0.04 wt%, first crystallization).
Determination of the average lamellar thickness and rugosity from AFM images:
First, large (35 ´ 35 µm2) and high-resolution (4096 ´ 4096 pixels) images of the sample
were recorded (Fig. S2a). Smaller regions of interest (4 ´ 4 µm2, 470 ´ 470 pixels, without
large aggregates) were selected from these images for height distribution analysis (Fig. S2b). Special care was taken for background plane fitting of each region. The peaks in the height distributions were fitted with Gaussian functions, allowing to determine the height of the Si support, the individual lamellae, as well as stacks of two or more crystals (Fig. S2c). The height of one lamella was calculated by averaging the height of individual and stacked lamellae after subtraction of the height of the support.
Figure S4. a) Large AFM image of Vibuprofen lamellar crystals from native amylose deposited
on a Si wafer; b) smaller image extracted from the large one (white square) and used to calculate the height distribution; c) corresponding height distribution with peaks corresponding to the Si support as well as individual and stacked lamellae.
Figure S5. a,b) Base-plane ED patterns of VIBU single crystals prepared with DP60 (a) and
DP2500 (b) amylose fractions, recorded at low temperature from frozen-hydrated preparations; c) XRD powder profiles of VIBU crystals prepared with various amylose fractions.
Figure S6. a,b) TEM images of lamellar single crystals prepared by crystallizing native amylose in the presence of propan-2-ol; c) base-plane electron diffraction pattern of one crystal recorded at room temperature; d) powder X-ray diffraction profile of a mat of hydrated Vpropan-2-ol crystals.
Table S1. Observed (obs) and calculated (cal) diffraction angles 2θ in the X-ray powder diffraction pattern recorded on hydrated VIBU complexes, and corresponding Miller indices based
on an orthorhombic unit cell with a = 2.824 ± 0.001 nm, b = 2.966 ± 0.001 nm, and c = 0.800 ± 0.001 nm. h k l 2θ obs (°) 2θ cal (°) 1 1 0 4.325 4.320 2 0 0 6.256 6.259 1 2 0 6.732 6.732 2 1 0 6.934 6.933 2 2 0 8.656 8.646 1 3 0 9.467 9.477 3 1 0 9.856 9.857 2 3 0 10.93 10.923 3 2 0 11.110 11.132 1 4 0 12.336 12.341 2 0 1 12.724 12.724 4 1 0 12.894 12.888 3 4 0 15.208 15.210 5 2 0 16.831 16.795 3 5 0 17.685 17.671 5 3 0 18.080 18.087 6 1 0 19.056 19.090 6 2 0 19.785 19.788 5 5 0 21.731 21.725 3 7 0 23.022 23.017 4 7 0 24.485 24.500 7 4 0 25.131 25.127
Figure S7. 13C CP/MAS NMR spectra of Vpropan-2-ol crystalline complexes (DP2500 amylose).
Figure S8. Deconvolution of carbon C1 peak in the 13C SP/MAS NMR spectrum of V IBU
crystalline complexes (full spectrum in Fig. 6). The main peak (blue line) was fitted with a pseudo-Voigt function (purple line) and the amorphous contribution by two Gaussian functions (green and red lines) (Tan et al., 2007).
Figure S9. Axial view of the molecular model of the Vpropan-2-ol crystal drawn from the data
published by Nishiyama et al. (2010). The hydrogen atoms have been omitted for clarity.
Figure S10. Optimization and refinement steps to produce a tentative molecular model of the VS-IBU complex: a) initial model containing only symmetrical 7-fold amylose helices. The
position of the 7-fold amylose helices corresponds to that determined for the Vpropan-2-ol complex
(Nishiyama et al., 2010); b) relaxation after addition of S-IBU and water molecules located in the amylose helices and in-between. The conformation of the helices was constrained; c) refinement against ED intensities using SHELXL. All molecules were free to relax. The hydrogen atoms in the displayed models have been omitted for clarity.
Figure S11. Axial views of the VS-IBU molecular model showing the hydrogen bonds (pink
dashed lines in a) and van der Waals contacts (blue dashed lines in b). The hydrogen atoms have been omitted for clarity.
Scheme S2. Atom numbering in two contiguous glucosyl residues of the amylose chain. The f and y torsion angles across the glycosidic bond define the relative orientation of the glucosyls. f is defined by the atom sequence O5i–C1i–O1i–C4i+1, and y by C1i–O1i–C4i+1–C5i+1. The
torsion w defines the orientation of the hydroxymethyl pendant group on the pyran rings and is defined by the atom sequence O5i–C5i–C6i–O6i.
Table S2. Torsion angles describing the conformation of the amylose helix in the VS-IBU crystal. # Helical turn # Glucosyl residue f (°) y (°) w (°)
1 1 108.3 -133.8 101.7 1 2 104.7 132.3 -105.1 1 3 88.2 -129.6 -136.2 1 4 101.6 -128.3 -106.6 1 5 90.5 -109.5 -139.3 1 6 114.2 -132.3 -2.0 1 7 94.0 -127.2 57.3 2 1 108.1 -133.9 105.1 2 2 104.6 -132.5 -103.8 2 3 88.4 -129.4 -127.8 2 4 101.6 -128.3 -108.8 2 5 90.4 -109.2 -133.7 2 6 113.7 -132.4 2.7 2 7 93.0 -126.9 86.7 3 1 108.3 -133.9 104.5 3 2 104.4 -132.7 -102.8 3 3 88.5 -129.2 -129.4 3 4 101.6 -128.3 -111.4 3 5 89.9 -109.6 -142.6 3 6 113.6 -132.6 3.1 3 7 94.0 -127.3 86.5
Scheme S3. Carbon atom numbering in S-ibuprofen.
Table S3. Conformation of the S-IBU molecules in the asymmetric unit of the VS-IBU complex
(two intra- and one interhelical guests). The T1, T2 and T3 torsion angles are defined by the C1-C2-C4-C5, C6-C7-C10-C11, and C7-C10-C11-C12 sequences of atoms, respectively.
T1 T2 T3 S-IBU intra 1 146.4 84.8 57.0 S-IBU intra 2 119.5 97.4 165.7 S-IBU inter 130.0 39.9 66.8 S-IBU crystal a 85.4 99.7 171.2 S-IBU DFT b 117.0 69.0 67.0
a conformation of S-IBU in the crystal structure determined by Freer et al. (1993)