Cell Reports, Volume
20
Supplemental Information
Feedback Inhibition of the Rag GTPase
GAP Complex Lst4-Lst7 Safeguards TORC1
from Hyperactivation by Amino Acid Signals
Supplemental Information
Supplemental Figures
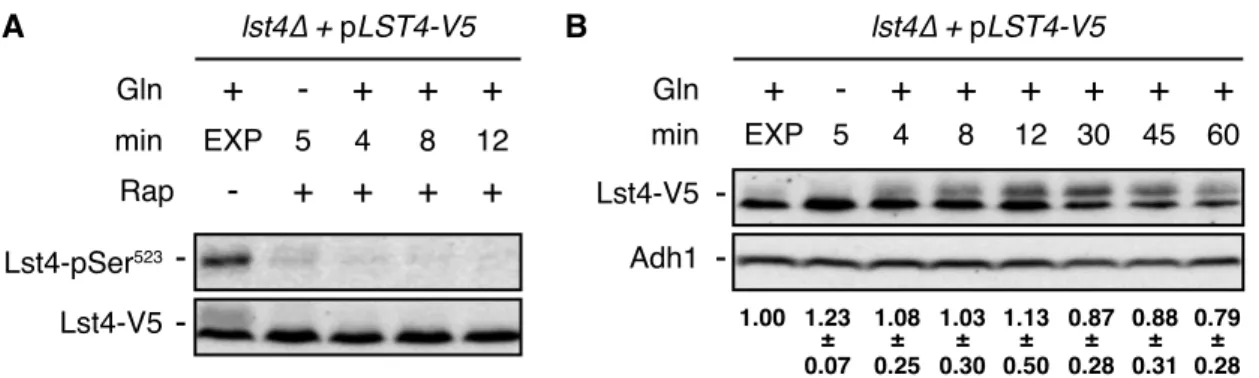
Figure S1. Glutamine Refeeding Fails to Stimulate Lst4-Ser
523Phosphorylation in the Presence of
Rapamycin and Does Not Significantly Alter Lst4 Levels, Related to Fig. 2G
(A) TORC1 inhibition prevents glutamine-stimulated phosphorylation of Ser
523in Lst4. Cells (lst4∆)
expressing plasmid-encoded Lst4-V5 were treated as in Figure 2G, except that rapamycin (200 ng ml
-1) was
added at the beginning of the amino acid starvation and maintained throughout the glutamine restimulation
period.
(B) Amino acid starvation and glutamine refeeding do not significantly affect Lst4-V5 levels. Cells (as in
[A]) were treated as in Figure 2G, including additional sampling time points up to 60 min following
glutamine refeeding. Representative anti-V5 and anti-Adh1 immunoblots are shown together with
respective values of the Lst4-V5 levels that were calculated as the mean ratio of Lst4-V5/Adh1 (n =3; ±
SD) and normalized to the respective ratio in exponentially growing (EXP) cells (set to 1.0).
Figure S2. Phosphorylation of Ser
523in Lst4 Does Not Require Sch9, Related to Fig. 2H
Exponentially growing lst4∆ sch9∆ cells expressing plasmid-encoded Lst4-V5 and Maf1-HA
3were starved
for amino acids and refed with glutamine and analyzed for the phosphorylation levels of Ser
523in Lst4, for
the total levels of Lst4-V5, and, in an additional control, for the extent of hyperphosphorylation of the Sch9
target Maf1-HA
3(as in Figure 2H). As judged from the relative levels of the slowly migrating Lst4-V5
versus the respective faster migrating ones, and in line with the results in Figure 2H, loss of Sch9 appeared
to result in Lst4 hyperphosphorylation in non-starved cells. Notably, while Maf1-HA
3migrated in multiple
phosphorylated isoforms in exponentially growing cells expressing functional Sch9 (Figure 2H), no such
isoforms were detected in the absence of Sch9 (neither in exponentially growing nor in glutamine-refed
sch9∆ cells).
Figure S1
Gln min-
+
sch9∆ + pLST4-V5 + pMAF1-HA3 EXP 5 4 8 12+
+
Lst4-pSer523 -Lst4-V5-+
Figure S2
Maf1-HA3-Gln min
-
+
lst4∆ + pLST4-V5 EXP 5 4 8 12+
+
-Lst4-V5 -Adh1+
+
+
+
30 45 60 1.00 1.23 0.07 ± 1.08 0.25 ± 1.03 0.30 ± 1.13 0.50 ± 0.87 0.28 ± 0.88 0.31 ± 0.79 0.28 ±A
B
Gln min-
+
EXP 5 4 8 12+
+
Lst4-pSer523 -Lst4-V5-+
lst4∆ + pLST4-V5 Rap-
+
+
+
+
Figure S1
Gln min-
+
lst4∆ sch9∆ + pLST4-V5 + pMAF1-HA3 EXP 5 4 8 12+
+
Lst4-pSer523-Lst4-V5
-+
Figure S2
Maf1-HA3-Gln min
-
+
lst4∆ + pLST4-V5 EXP 5 4 8 12+
+
-Lst4-V5 -Adh1+
+
+
+
30 45 60 1.00 1.23 0.07 ± 1.08 0.25 ± 1.03 0.30 ± 1.13 0.50 ± 0.87 0.28 ± 0.88 0.31 ± 0.79 0.28 ±A
B
Gln min-
+
EXP 5 4 8 12+
+
Lst4-pSer523 -Lst4-V5-+
lst4∆ + pLST4-V5 Rap-
+
+
+
+
Supplemental Tables
Table S1. Strains Used in This Study
Strain Genotype Source Figure
KT1961 MATa; his3, leu2, ura3-52, trp1 [1]
KP09 [KT1961] MATa; lst4∆::KanMX [2] 2D; 2F-H; 4A,
C; S1A, B
KP10 [KT1961] MATa; lst7∆::KanMX [2] 1C; 3B
MP372-2D [KT1961] MATa; LST7-GFP::HIS3MX, lst4∆::KanMX [2] 3C MP412-1C [KT1961] MATa; lst4∆::KanMX, lst7∆::KanMX This study 2F
MP4469 [KT1961] MATa; lst4∆::KanMX, URA3::LST4p-LST4-ENVY This study 1B; 2A, E; 3A; 4A-C
MP4509 [KT1961] MATa; lst4∆::KanMX, URA3::LST4p-lst412A-ENVY This study 3A; 4A-C
MP4510 [KT1961] MATa; lst4∆::KanMX, URA3::LST4p-lst45D-ENVY This study 3A; 4A-C MP4569 [KT1961] MATa; URA3::CYC1p-lst4loop-GFP This study 1B; 1D, E
MP4570 [KT1961] MATa; lst4∆::KanMX, URA3::CYC1p-lst4loop-GFP This study 1D
MP4571 [KT1961] MATa; lst7∆::KanMX, URA3::CYC1p-lst4loop-GFP This study 1D MP4572 [KT1961] MATa; lst4∆::KanMX, lst7∆::KanMX, URA3::CYC1p-lst4loop
-GFP This study 1D
MP4573 [KT1961] MATa; gtr1∆::natMX, gtr2∆::natMX, URA3::CYC1p-lst4loop
-GFP This study 1F
MP4638 [KT1961] MATa; lst4∆::KanMX, sch9∆::natMX, pRS414-SCH9T492G ,
pRS416-LST4p-LST4-V5-HIS6
This study 2H MP4680 [KT1961] MATa; lst4∆::KanMX, lst7∆::KanMX,
URA3::LST4p-LST4-ENVY This study 3B
MP4684 [KT1961] MATa; lst4∆::KanMX, lst7∆::KanMX, URA3::LST4p-lst412A
-ENVY This study 3B
MP4688 [KT1961] MATa; lst4∆::KanMX, lst7∆::KanMX, URA3::LST4p-lst45D
-ENVY This study 3B
MP268-2B [KT1961] MATa; gtr1∆::NatMX, gtr2∆::NatMX [2] 3E MP4704 [MP268-2B] MATa; lst4∆::KanMX, URA3::LST4p-LST4-ENVY This study 3E MP4708 [MP268-2B] MATa; lst4∆::KanMX, URA3::LST4p-lst412A-ENVY This study 3E MP4709 [MP268-2B] MATa; lst4∆::KanMX, URA3::LST4p-lst45D-ENVY This study 3E
MP4847 [KT1961] MATa; iml1∆::KanMX, lst4∆::KanMX, URA3::LST4p-LST4-ENVY
This study 4D, E MP4849 [KT1961] MATa; iml1∆::KanMX, lst4∆::KanMX, URA3::LST4p-lst412A
-ENVY
This study 4D, E MP4642 [KT1961] MATa; lst4∆::KanMX, sch9∆::KanMX,
pRS416-LST4p-LST4-V5-HIS6
This study S2 MP4693 [KT1961] MATa; lst4∆::KanMX, lst7∆::KanMX, URA3::LST4p-lst4Dloop
-ENVY
This study 1D MP4697 [KT1961] MATa; URA3::LST4p-lst4Dloop-ENVY This study 1B; 1D, E MP4698 [KT1961] MATa; lst4∆::KanMX, URA3::LST4p-LST4-ENVY This study 4D, E MP4699 [KT1961] MATa; lst4∆::KanMX, URA3::LST4p-lst4 Dloop-ENVY This study 1D MP4700 [KT1961] MATa; lst4∆::KanMX, URA3::LST4p-lst412A-ENVY This study 4D, E
MP4510 [KT1961] MATa; lst4∆::KanMX, URA3::LST4p-lst45D-ENVY This study 4D, E
MP4703 [KT1961] MATa; lst7∆::KanMX, URA3::LST4p- lst4 Dloop-ENVY This study 1D TB50a MATa; trp1 his3 ura3 leu2 rme1 [3]
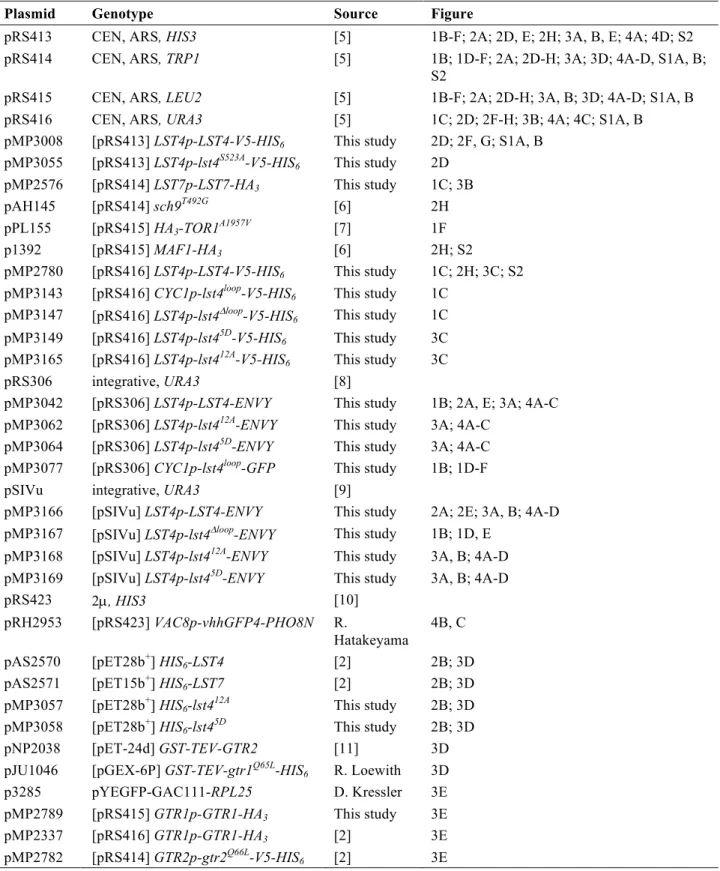
Table S2. Plasmids Used in This Study
Plasmid Genotype Source Figure
pRS413 CEN, ARS, HIS3 [5] 1B-F; 2A; 2D, E; 2H; 3A, B, E; 4A; 4D; S2 pRS414 CEN, ARS, TRP1 [5] 1B; 1D-F; 2A; 2D-H; 3A; 3D; 4A-D, S1A, B;
S2
pRS415 CEN, ARS, LEU2 [5] 1B-F; 2A; 2D-H; 3A, B; 3D; 4A-D; S1A, B pRS416 CEN, ARS, URA3 [5] 1C; 2D; 2F-H; 3B; 4A; 4C; S1A, B
pMP3008 [pRS413] LST4p-LST4-V5-HIS6 This study 2D; 2F, G; S1A, B
pMP3055 [pRS413] LST4p-lst4S523A-V5-HIS
6 This study 2D
pMP2576 [pRS414] LST7p-LST7-HA3 This study 1C; 3B
pAH145 [pRS414] sch9T492G [6] 2H pPL155 [pRS415] HA3-TOR1A1957V [7] 1F
p1392 [pRS415] MAF1-HA3 [6] 2H; S2
pMP2780 [pRS416] LST4p-LST4-V5-HIS6 This study 1C; 2H; 3C; S2
pMP3143 [pRS416] CYC1p-lst4loop-V5-HIS6 This study 1C
pMP3147 [pRS416] LST4p-lst4Dloop-V5-HIS 6 This study 1C pMP3149 [pRS416] LST4p-lst45D-V5-HIS 6 This study 3C pMP3165 [pRS416] LST4p-lst412A-V5-HIS 6 This study 3C pRS306 integrative, URA3 [8]
pMP3042 [pRS306] LST4p-LST4-ENVY This study 1B; 2A, E; 3A; 4A-C pMP3062 [pRS306] LST4p-lst412A-ENVY This study 3A; 4A-C
pMP3064 [pRS306] LST4p-lst45D-ENVY This study 3A; 4A-C
pMP3077 [pRS306] CYC1p-lst4loop-GFP This study 1B; 1D-F pSIVu integrative, URA3 [9]
pMP3166 [pSIVu] LST4p-LST4-ENVY This study 2A; 2E; 3A, B; 4A-D pMP3167 [pSIVu] LST4p-lst4Dloop-ENVY This study 1B; 1D, E
pMP3168 [pSIVu] LST4p-lst412A-ENVY This study 3A, B; 4A-D pMP3169 [pSIVu] LST4p-lst45D-ENVY This study 3A, B; 4A-D
pRS423 2µ, HIS3 [10]
pRH2953 [pRS423] VAC8p-vhhGFP4-PHO8N R.
Hatakeyama
4B, C pAS2570 [pET28b+] HIS
6-LST4 [2] 2B; 3D
pAS2571 [pET15b+] HIS
6-LST7 [2] 2B; 3D
pMP3057 [pET28b+] HIS6-lst412A This study 2B; 3D
pMP3058 [pET28b+] HIS
6-lst45D This study 2B; 3D
pNP2038 [pET-24d] GST-TEV-GTR2 [11] 3D pJU1046 [pGEX-6P] GST-TEV-gtr1Q65L-HIS
6 R. Loewith 3D
p3285 pYEGFP-GAC111-RPL25 D. Kressler 3E pMP2789 [pRS415] GTR1p-GTR1-HA3 This study 3E
pMP2337 [pRS416] GTR1p-GTR1-HA3 [2] 3E
pMP2782 [pRS414] GTR2p-gtr2Q66L-V5-HIS
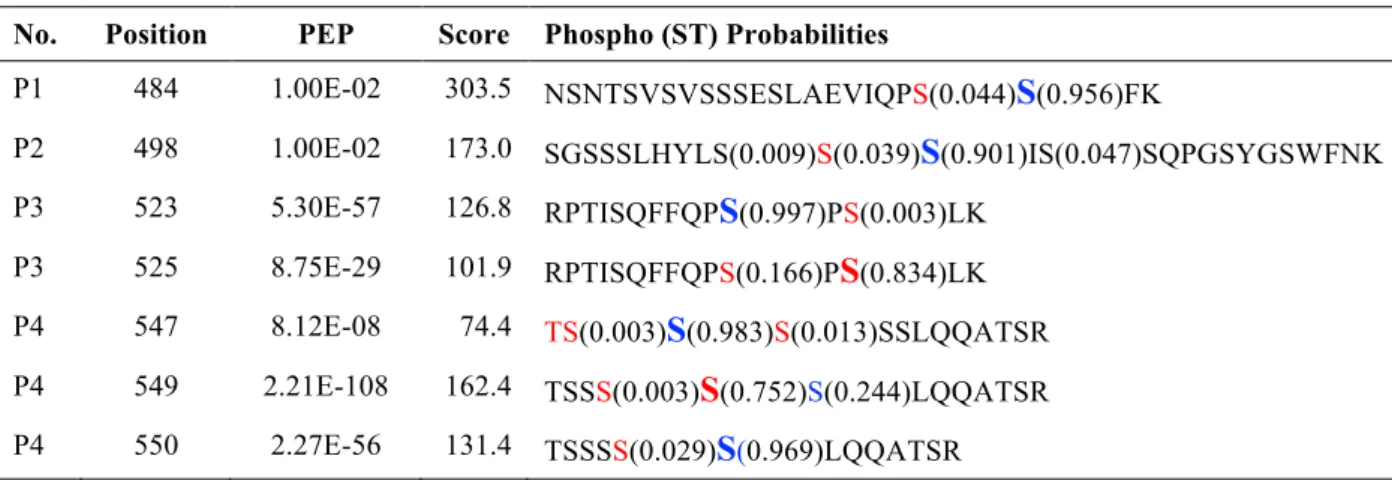
Table S3. TORC1-Controlled Phosphorylation Sites in Lst4
aNo. Position PEP Score Phospho (ST) Probabilities
P1 484 1.00E-02 303.5 NSNTSVSVSSSESLAEVIQPS(0.044)
S
(0.956)FKP2 498 1.00E-02 173.0 SGSSSLHYLS(0.009)S(0.039)
S
(0.901)IS(0.047)SQPGSYGSWFNK P3 523 5.30E-57 126.8 RPTISQFFQPS
(0.997)PS(0.003)LKP3 525 8.75E-29 101.9 RPTISQFFQPS(0.166)P
S
(0.834)LK P4 547 8.12E-08 74.4 TS(0.003)S
(0.983)S(0.013)SSLQQATSR P4 549 2.21E-108 162.4 TSSS(0.003)S
(0.752)S(0.244)LQQATSR P4 550 2.27E-56 131.4 TSSSS(0.029)S
(0.969)LQQATSRa Peptides are numbered according to Figure 2. The position of the most likely phosphorylated amino acid residue as
identified by MS-analysis is indicated (see also respective phosphosite localization probabilities). Sites marked in red (i.e. probability > 0.001) were exchanged to alanine and sites marked in blue (i.e. probability > 0.9) were exchanged to alanine and/or phospho-mimetic aspartate. In addition, we also included the conserved Thr545, which is adjacent to a serine cluster, in these analyses. PEP: posterior error probability; Score: Andromeda score.