Publisher’s version / Version de l'éditeur:
Vous avez des questions? Nous pouvons vous aider. Pour communiquer directement avec un auteur, consultez la première page de la revue dans laquelle son article a été publié afin de trouver ses coordonnées. Si vous n’arrivez pas à les repérer, communiquez avec nous à [email protected].
Questions? Contact the NRC Publications Archive team at
[email protected]. If you wish to email the authors directly, please see the first page of the publication for their contact information.
https://publications-cnrc.canada.ca/fra/droits
L’accès à ce site Web et l’utilisation de son contenu sont assujettis aux conditions présentées dans le site LISEZ CES CONDITIONS ATTENTIVEMENT AVANT D’UTILISER CE SITE WEB.
3rd International Symposium of Ground Freezing [proceedings of the], pp.
239-245, 1982
READ THESE TERMS AND CONDITIONS CAREFULLY BEFORE USING THIS WEBSITE. https://nrc-publications.canada.ca/eng/copyright
NRC Publications Archive Record / Notice des Archives des publications du CNRC :
https://nrc-publications.canada.ca/eng/view/object/?id=02d445cc-c57f-4b2d-a053-14815ef844fb
https://publications-cnrc.canada.ca/fra/voir/objet/?id=02d445cc-c57f-4b2d-a053-14815ef844fb
NRC Publications Archive
Archives des publications du CNRC
This publication could be one of several versions: author’s original, accepted manuscript or the publisher’s version. / La version de cette publication peut être l’une des suivantes : la version prépublication de l’auteur, la version acceptée du manuscrit ou la version de l’éditeur.
Access and use of this website and the material on it are subject to the Terms and Conditions set forth at
Aspects of ice lens formation
ld
1
National Research
Conseil national
051
'I
*
Council Canada
de recherches Canada
ASPECTS OF ICE LENS FORMATION
by E. Penner
ANALYZED
Reprinted from
3rd. International Symposium on Ground Freezing, June 1982,
U.S. Army Corps of Engineers, CRRE L,
Hanover, New Hampshire
p. 239
-
245
DBR Paper No. 1051
Division of Building Research
-- RESUME 11 e s t p o s s i b l e d e l o c a l i s e r u n e l e n t i l l e d e g l a c e e n c r o i s s a n c e d a n s un e c h a n t i l l o n d e sol g e l i f a u l a b o r a t o i r e a u moyen d ' u n e t e c h n i q u e r e c e m m e n t i n v e n t e e u t i l i s a n t l e s r a y o n X. S i e n m6me t e m p s o n m e s u r e l a d i s t r i b u t i o n d e s t e m p e r a t u r e s d a n s l ' C i c h a n t i l l o n , o n p e u t d e t e r m i n e r l a t e m p e r a t u r e d e l a f a c e e n c r o i s s a n c e d e l a l e n t i l l e d e g l a c e . L ' o b j e c t i f d e c e t t e e t u d e e t a i t d e v a l i d e r c e t t e m e t h o d e p o u r un g r a n d nombre d e c o n d i t i o n s e x p e r i m e n t a l e s de s o u l S v e m e n t . On a d o n c d g t e r m i n e l e s t e m p e r a t u r e s d e s l e n t i l l e s d e g l a c e p o u r d i v e r s e s p r e s s i o n s p r o v e n a n t d u sol d e r e c o u v r e m e n t e t p o u r d i v e r s e s t e m p e r a t u r e s f r o i d e s a v o i s i n a n t e s ; e n s u i t e , e n c o r r i g e a n t l a t e m p e r a t u r e d e s l e n t i l l e s d e g l a c e e n f o n c t i o n d e l a p r e s s i o n p r o v e n a n t d u sol d e r e c o u v r e ~ n e n t e t d e l a t e n e u r e n g e l d e l ' e a u d e s p o r e s , l a d i f f e r e n c e p a r r a p p o r t 3 l a t e m p e r a t u r e d e O°C a
e t e
e x p r i m e e e n terme d ' a s p i r a t i o n d ' e a u . L e s g r a d i e n t s d l a s p i r a t i o n d ' e a u d a n s l e sol d e g e l e c o r r e s p o n d a n ta
d i v e r s e s c o n d i t i o n s de g e l o n t e n s u i t eete
r e p r e s e n t s s g r a p h i q u e m e n t e n f o n c t i o n d e l a v i t e s s e d 1 6 c o u l e m e n t d e l ' e a u e t o n a c o n s t a t e q u a il e x i s t a i t u n e p r o p o r t i o n n a l i t e . D e p l u s , l e c o e f f i c i e n t t h e o r i q u e d e p e r m e a b i l i t e c o r r e s p o n d a i t 3 l a v a l e u r 3 l a q u e l l e o n s ' a t t e n d a i t p o u r l ' a r g i l e L e d a q u i a s e r v i a u x e s s a i s . C e s r e s u l t a t s c o n f i r m e n t l a v a l i d i t s d e l a m e t h o d e u t i l i s a n t l e s r a y o n sx
p o u r m e s u r e r l e s g r a d i e n t s t h e r m i q u e s q u i i n d i q u e n t l e c o m p o r t e ~ n e n t t h e r m i q u e d e l a c r o i s s a n c e d e s l e n t i l l e s d e g l a c e . I1111
3
I
1809
I
1111
III~~I$IIII
02
190
11 1111 1111 11
-- - - -ASPECTS OF ICE LENS FORMATION
E. Penner, DBR, National Research Counc
ABSTRACT
It is possible to locate a growing ice lens in a frost heave cell in soil under laboratory conditions by means of a recently devised X-ray technique. If temperature distribution is measured in the sample at the same time, the temperature of the growing face of the ice lens can be determined. The objective of the study was to validate this method under a range of heaving conditions. It was done by determining ice lens temperatures at various overburden pressures and cold side temperatures; then, by adjusting the ice lens temperature for overburden pressure and pore water salt content, the
remaining difference from O°C was
expressed in terms of suction. Suction gradients in unfrozen soil under various freezing conditions were subsequently plotted as a function of rate of moisture flow and a proportionality was shown to exist. In addition the calculated permeability coefficient was the expected value for the material, Leda clay. These results lend credence
to use of the X-ray
-
thermal gradienttechnique for studying thermal behaviour of ice lens growth.
Preliminary results were previously presented by Penner and Goodrich (1980) for an X-ray technique designed to determine the position of a growing ice lens in soil specimens frozen in the laboratory. Tine temperatures 3: ths
face of growing ice lenses were determined by means of simultaneous X-rays and temperature measurements in a sample while the heaving process was in progress. Subsequently, more detailed studies were carried out on one
:il of Canada, Ottawa, Canada KIA OR6
particular soil, Leda clay, using a range of overburden pressures and one-step freezing temperature
experiments that form the basis of this paper. Some of the heaving experiments were continued over longer periods to observe ice lens temperature and heave response to changes in cold-side temperature and overburden pressure; representative results are reported. The main thrust of this paper, however, is to validate the temperatures of ice lens growth measured by the
X-ray
-
thermal gradient technique.This was done by subtracting the freezing point depression attributable to pore water salt content and
overburden pressure from the measured ice lens temperatures, and expressing the remaining quantity in terms of suction. With the external water table held at the level of the unfrozen end
of the soil specimen (suction = 0) and
the estimated suction at the face of the growing ice lens, suction gradients were calculated and plotted against moisture flow rates. The results show
that the permeability coefficient value determined from moisture intake during heaving is the value expected for this clay; and that the suction gradient is proportional to the measured flow rate,
as it should be. The X-ray
-
thermalgradient technique for determining ice lens temperatures therefore appears to be a valid method of studying the thermal behaviour of ice lens growth. Experimental Materials and Technique
The soil was a marine silty clay from the Ottawa area, with clay size
content in the range of 70 to 75% and
the remainder in the silt size range. The soil was remoulded and sufficient
water added to bring it near the liquid limit. The test cell (obtained from Northern Engineering Services (NES) Company Limited, Calgary, Alberta) was filled with the fluid mix and
consolidated. in stages, to 490 kPa. The sample was then allowed to rebound to the test pressure used during freezing. Two cells, one a copy of the NES cell, were used alternately.
A complete description of the cell has
been given by Penner and Ueda (1977).
Table 1 gives the pre-freezing
sample data. It is to be noted that the rebound upon pressure release is small in Leda clay because the clay size fraction is unusually coarse, consisting largely of rock flour and non-swelling clay minerals. Although a range of overburden pressures was used in the studies, the sample density and moisture content were not noticeably changed. It was possible, therefore, to study the freezing behaviour of this soil at various overburden pressures without there being any effect from overburden pressures on the structure of the sample. Freezing Procedure
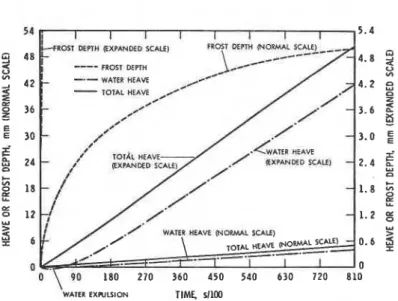
The freezing procedure has become known as the one-step freezing test, dating to early studies by Penner
( 1957). The frost penetration
and the heaving curves are given in Fig. 1.
The cell containing the sample was placed in a constant-temperature
chamber held at approximately 4OC
+
0.05.Waterlines were connected and purged with de-aired water to remove air bubbles. After dimensional and thermal stability had been established,
crystallization was induced (Penner and Goodrich, 1980) and a constant step- freezing temperature imposed on the cold side.
Glass-encased thermistors were located at the interface between the sample wall and the sample, just behind a thin sheet of Teflon. During all freezing runs the temperature of the sample, heave and water intake were measured at suitable intervals.
The sliding friction of the sample in the cell was measured for both cells; the average of several measure- ments was found to be 2 4 kPa. This value also included the friction of the two O-rings, which form a part of the cell design and were in place during friction measurements.
X-ray Technique
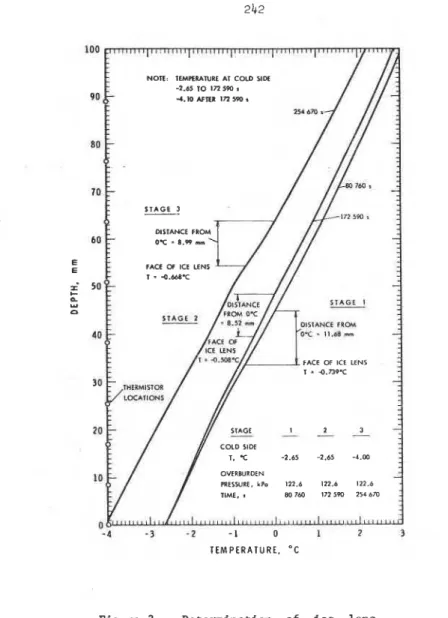
At pre-selected times temperature measurements and X-rays of the sample were taken simultaneously through the cell wall. The X-ray beam was positioned at the elevation of the growing ice lens to avoid parallox errors.
The method of determining ice lens temperatures has been described in detail (Penner and Goodrich, 1980), but for completeness it will be described again in brief. An example of X-ray photographs taken at various stages of Table 1. Pre-freezing Sample Data
Pre-freezing Freezing *Moisture Dry
Sample Cell Consolidation P Pressure Content Density *Saturation
(kPa) (kPa) (X dry wt) (kg/m3) X
*Moisture content and.
X
saturation apply after rebound from consolidation' 0-'\ 90 180 270 360 450 540 630 720 810
WATER E X N L I l O N TIML sfloo
Figure 1. Example of frost penetration, total heave and heave by water intake for the one-step freezing mode with the Leda clay used in this study.
Figure
2.
X-rays taken at successive stages of pressure.No.
1
was taken after 87540 s, overburdenP
= 514.8 H a ,cold-side temperature -3.40°C. Pressure reduced to
72
kPa. No.2
was taken after a further 85560 s.temperature and pressure is shown in
Fig.
2.
As the position of thethermistors may be seen in the X-ray, the temperature gradient can be
ecperirnposed and the temperature of the ice lens determined, as shown in Fig. 3. Results and Discussion
Earlier studies (Penner and Walton, 1979) have shown that for the one-step
heaving test the log of the initial total rate of heave is linearly proportional t o the overburden pressure/cold-side freezing temperature ratio. The present studies verified this.
The results for the particular sample of
Leda clay used are given in Fig.
4.
Therange of pressures is from 123 to 515 kPa and the range.of cold-side
temperatures approximately
-1
to -4'~.-2.65 TO In sw
,
-4.10 *FBI In 54) 1
FACE OF ICE LENS
T
.
4.nv-c -2.65 -2.65 -4.W - PRESSURE. kPo 122.6 122.6 121.6 - 80760 1 7 1 5 ~ 254brn - 4 - 3 - 2 - 1 0 1 2 3 TEMPERATURE. " CFigure 3. Determination of ice lens position from X-rays and thermal gradient.
coefficient of 0.99.
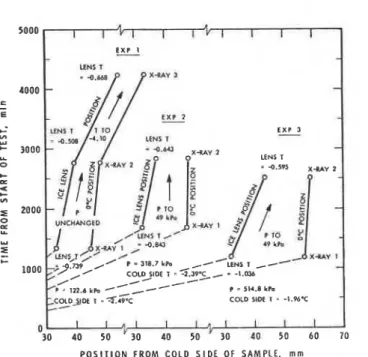
Figure 5 illustrates the position in the sample and the temperature of the ice lens when the overburden pressure is the same but the starting cold-side temperature is different. With a cold- side temperature of -2.4g°C the lens temperature at the time of the first X-ray was -0.73g°C; when the cold-side temperature was colder (-3.75OC), the ice lens temperature was -0.950°C. A second X-ray was taken of each sample at about the same running time after the first X-ray. Again, the lens
temperature was colder when the cold- side temperature was lower. In one of the experiments a third stage was added. Dropping the temperature on the cold side to -4.10°C lowered the ice lens temperature further.
Figure 6 illustrates the tempera- ture and position of the ice lens relative to the OOC isotherm at about the same cold-side temperature but different overburden pressures. The general pattern was that the higher the overburden pressure the lower the lens temperature after about the same time interval from the start of the test, provided the cold-side temperatures were approximately the same. To be noted also is that the lens temperature difference from O°C reduces with time. Thls is illustrated in experiment 1
(Fig. 6) between X-ray 1 and X-ray 2. After X-ray 2 the cold-side temperature was dropped and this, in general, lowered the ice lens temperature. In experiments 2 and 3 the pressure was reduced after X-ray 1, tending to
C a I U T l O N COEFFICIENT ' 0.W
COCD SIDE TEhWERATURES AND
-
OVEMURDEN PRESSURES-
A15 Bid c17 P
-
112.6 hm-2.49 -3.75 -1.04 T = T )14 = I 8 P = 318.7 L;k -3.71 -2.39 -1.12 T = T
*p BI0 CII DI2 P = 5 U . 8 .)k
-1.06 -1.s -1.W -3.13 T = T
1
0 -100 -200 -300 -400 -500 -600
OVERBURDEN PRESSURVFREQING TEMPERATURE (COLD SIDE). kPal°C
Figure 4. Initial total heave rate vs
overburden pressure/cold-side temperature ratio. X-RAY 3 4000 LENS T - -0.668.C
-
3000 2000 2" 4 , e s y : YP
P X-RAY I 1000-
P UMS T = +.WT-
0 10 20 30 40 50 60 70 80 PODEPTH OF ICE LENS AN0 0°C ISOTHERM, mm
Figure 5. Position and temperature of
face of growing ice lens and 0 ° C isothern
vs time at initial overburden pressure of
5000 A I 1 f l I t a v i I T
-
LLHS I X*Y I Y 0 C a X*Y I Y I- '- X 4 A Y I COLD SIDE 1 = -1.96-c '30 :O 110 ' i 0 0 1 1 0 ' 1 O: i 0 i 0 i 0 P O S I T I O N FROM COLD S I D E OF SAMPLE, mrnFigure 6 . P o s i t i o n and temperature of face of growing i c e l e n s and O°C isotherm v s time when i n i t i a l overburden pressures are d i f f e r e n t .
11
10 COLD SIDE TEMPERATURES AND OVERBURDEN PRESSURES P II A ~ ~uldr , c~~~ P = 122.6 km -2.49 -3.75 -1.04 a *13, B141 ' 1 8 ~
-
E -3.71 -2.39 -1.12 OP-
9 7 0 BIo2 Cll, D12, P = 514.8 kPo X W Y -1.06 -1.58 -1.96 -3.13 T = 'C 6 I Y CORRELATION COfFFlClENT = 0.96B
z
4 Y EXPIANATION1 ,
.
SUBSCRIPT I OR 2 INWCATCS IHE NUMBER OFSTAGES I N THE RUN.
..p. AIS,, ONE STAGE I N RUN A15
alq, W O STAGES I N &NI 816
2 WHEN TWO STAGES OCCUR. IHE ONLY
DIFFERENCE IS THAT A SECOND X-RAY WAS TAKEN AT A LATER TIME, WT PRESSURES AND
1 TEMPERATURES WERE THE SAME.
O 0 80 1 6 0 240 320 400 460 5 6 0 640 SUCTION GRADIENT I N UNFROZEN SOIL BELOW ICE LENS, I
Figure 7. Heave by moisture intake v s suction gradient i n unfrozen portion below i c e l e n s .
reduce the distance between the lens and O°C isotherm as well as the temperature depression. Note particularly the large decrease shown by the results of
experiment 3.
Finally, the main thrust of the work was to validate the method of determining ice lens temperatures. This was done by estimating suction from lens temperature after allowing for pore water salt content and overburden pressures. With the suction at the base of the unfrozen soil held at zero and the suction estimated at the ice lens, suction gradients were calculated and plotted against moisture flow during
heaving (Fig. 7). As may be seen, the
flow rate measured during the experiment was linearly proportional to the
calculated suction gradient. In addition, the permeability coefficient calculated
f rom Fig. 7 was 6 x 10⁻¹⁰ m/s, a value
that compares favourably with other permeability measurements of Leda clay of the same grain size and density
(Bozozuk, 1972). This lends credence to
the method used for determining the values for ice lens temperature. Concluding Remarks
The one-step freezing test has shown that calculating ice lens temperatures from the position of the growing ice face, determined from X-rays and thermal gradient, is a valid method of determining ice lens temperature. Trends observed in ice lens temperatures are as might be expected. In general, increasing the overburden pressure lowers the temperature of the lens at the ice front. Lowering the overburden pressure during heaving causes the ice front temperature to increase.
Similarly, decreasing the cold-side temperature increases the rate of freezing and lowers the ice-front temperatures.
Acknowledgements
The author wishes to express his appreciation to D. Eldred who was responsible for computer program changes, writing new programs when necessary, and generally for the experimental phase of the study.
This paper is a contribution from the Division of Building Research, National Research Council of Canada, and is published with the approval of the Director of the Division.
References
Bozozuk, M. 1972. The Gloucester test
fill, Ph.D. Thesis, Purdue University, 184 p.
Penner, E. 1957. Soil moisture
tension and ice segregation, Highway Res. Board, Bulletin 168, p. 50-64.
Penner, E., and T. Ueda 1977. The dependence of frost heaving on
load application
-
preliminaryresults, International Symposium on Frost Action in Soils, University of Lules, Lules, Sweden, Proc., Vol. 1, p. 92-101. Penner E., and T. Walton 1979.
Effects of temperature and pressure on frost heaving, Eng. Geol., Vol. 13, p. 29-39.
Penner, E., and L.E. Goodrich 1980.
Location of segregated ice in frost susceptible soil, Presented at 2nd International Symposium on Ground Freezing, Norwegian
Institute of Technology, Trondheim, Norway.
This publication is being d i s t r i b u t e d by the Division of Building R e s e a r c h of the National R e s e a r c h Council of - Canada. I t should not b e reproduced in whole o r :n p a r t without p e r m i s s i o n of the original publisher. The Di- vision would b e glad t o b e of a s s i s t a n c e in obtaining s u c h p e r m i s s i o n .
Publications of the Division m a y be obtained by m a i l - ing the a p p r o p r i a t e r e m i t t a n c e ( a Bank, E x p r e s s , o r P o s t Office Money O r d e r , o r a cheque, m a d e payable t o the R e c e i v e r G e n e r a l of Canada, c r e d i t NRC) t o the National R e s e a r c h Council of Canada, Ottawa. K1A OR6. Stamps a r e not acceptable.
A l i s t of a l l publications of the Division i s available and m a y be obtained f r o m the Publications Section. Division of Building R e s e a r c h , National R e s e a r c h Council of Canada. Ottawa. KIAOR6.