Regular Article
LYMPHOID NEOPLASIACD49d promotes disease progression in chronic
lymphocytic leukemia: new insights from CD49d
bimodal expression
Erika Tissino,1,* Federico Pozzo,1,* Dania Benedetti,1,* Chiara Caldana,1Tamara Bittolo,1Francesca Maria Rossi,1Riccardo Bomben,1
Paola Nanni,1Hillarj Chivil `o,1Ilaria Cattarossi,1Eva Zaina,1Kevin Norris,2Jerry Polesel,3Massimo Gentile,4Giovanni Tripepi,5Riccardo Moia,6
Enrico Santinelli,7Idanna Innocenti,8Jacopo Olivieri,9Giovanni D’Arena,10Luca Laurenti,8Francesco Zaja,11Gabriele Pozzato,11
Annalisa Chiarenza,12Francesco Di Raimondo,12Davide Rossi,13,14Chris Pepper,15Tanja Nicole Hartmann,16Gianluca Gaidano,6
Giovanni Del Poeta,7Valter Gattei,1,†and Antonella Zucchetto1,†
1Clinical and Experimental Onco-Hematology Unit, Centro di Riferimento Oncologico di Aviano (CRO), Istituto di Ricovero e Cura a Carattere Scientifico (IRCCS),
Aviano, Italy;2Division of Cancer and Genetics, School of Medicine, Cardiff University, Heath Park, Cardiff, United Kingdom;3Unit of Cancer Epidemiology, CRO,
IRCCS, Aviano, Italy;4Hematology Unit, Azienda Ospedaliera (AO) of Cosenza, Cosenza, Italy;5Nephrology Center, National Research Institute of Biomedicine and
Molecular Immunology, Reggio Calabria, Italy;6Division of Hematology, Department of Translational Medicine, Amedeo Avogadro University of Eastern
Piedmont, Novara, Italy;7Division of Hematology, University of Tor Vergata, Rome, Italy;8Dipartimento Scienze Radiologiche Radioterapiche ed Ematologiche,
Fondazione Policlinico Universitario A Gemelli, IRCCS, Rome, Italy;9Clinica Ematologica, Centro Trapianti e Terapie Cellulari“Carlo Melzi” Dipartimento
Interaziendale di Salute Mentale, AO Universitaria S. Maria Misericordia, Udine, Italy;10Onco-Haematology Department, Centro di Riferimento Oncologico della
Basilicata, IRCCS, Rionero in Vulture, Italy;11Department of Internal Medicine and Hematology, Maggiore General Hospital, University of Trieste, Trieste, Italy;
12Division of Hematology, Ferrarotto Hospital, University of Catania, Catania, Italy;13Hematology, Institute of Oncology Research, Bellinzona, Switzerland;
14Oncology Institute of Southern Switzerland, Bellinzona, Switzerland;15Brighton and Sussex Medical School, University of Sussex, Brighton, United Kingdom; and
16Department of Internal Medicine I, Medical Center and Faculty of Medicine, University of Freiburg, Freiburg, Germany
K E Y P O I N T S lCLL with bimodal CD49d expression accounts for∼20% of CLL and displays distinct clinicobiological features.
lThe prognostic impact of CD49d is increased by considering CD49d bimodal expression.
CD49d is a remarkable prognostic biomarker of chronic lymphocytic leukemia (CLL). The cutoff value for the extensively validated 30% of positive CLL cells is able to separate CLL patients into 2 subgroups with different prognoses, but it does not consider the pattern of CD49d expression. In the present study, we analyzed a cohort of 1630 CLL samples and identified the presence of ∼20% of CLL cases (n 5 313) characterized by a bimodal ex-pression of CD49d, that is, concomitant presence of a CD49d1subpopulation and a CD49d2 subpopulation. At variance with the highly stable CD49d expression observed in CLL patients with a homogeneous pattern of CD49d expression, CD49d bimodal CLL showed a higher level of variability in sequential samples, and an increase in the CD49d1 sub-population over time after therapy. The CD49d1subpopulation from CD49d bimodal CLL displayed higher levels of proliferation compared with the CD49d2cells; and was more highly represented in the bone marrow compared with peripheral blood (PB), and in PB CLL subsets expressing the CXCR4dim/CD5brightphenotype, known to be enriched in proliferative cells. From a clinical standpoint, CLL patients with CD49d bimodal expression, regardless of whether the CD49d1subpopulation exceeded the 30% cutoff or not, experienced clinical behavior similar to CD49d1CLL, both in chemoimmunotherapy (n5 1522) and in ibrutinib (n5 158) settings. Altogether, these results suggest that CD49d can drive disease progression in CLL, and that the pattern of CD49d expression should also be considered to improve the prognostic impact of this biomarker in CLL. (Blood. 2020;135(15):1244-1254)
Introduction
CD49d, the rate-limitinga-chain of the CD49d/CD29 integrin
heterodimer very late antigen-4, expressed in;40% of chronic
lymphocytic leukemia (CLL) cases, is a strong independent
pre-dictor of survival and treatment need in CLL.1-6
CD49d/CD29 mediates both cell-cell and cell-matrix interactions in CLL-involved tissues, delivering prosurvival signals and protecting
CLL cells from drug-induced apoptosis.7Moreover, CD49d/CD29
has a key role in driving homing of CLL cells to lymphoid tissues.8,9
This is confirmed by the association between high CD49d
ex-pression and the presence of lymphadenopathy at diagnosis, the development of lymphadenopathy during the course of the dis-ease, and the almost universal CD49d expression in CLL subsets
with prevalent nodal disease.10-12Lymph nodes (LNs) represent the
predominant sites of CLL cell activation and proliferation.13,14
Concordantly, LN-derived CLL cells are characterized by a distinct
gene-expression profile and phenotype, including higher CD49d
expression than in paired peripheral blood (PB) samples.8,15A
higher CD49d expression was also documented in PB CXCR4low/
CD5brightCLL cells, a cell subset representing the proliferative
LN-derived CLL cell fraction.8,16
In CLL, CD49d expression is variable, from completely negative cases to cases uniformly expressing the molecule at very high
levels.17-19The 30% cutoff, which robustly separates CLL patients
into 2 subgroups with different prognoses, has been extensively
validated.1-5However, the simple use of the cutoff does not
provide information on the expression pattern of CD49d. In-deed, we previously observed that CD49d may be expressed in a bimodal pattern in CLL, with the copresence of clearly distinct
negative and positive groups of cells in the same sample.20,21In
this context, CD49d1subpopulations, especially when
repre-sented in,30% of cells, raise the question of whether they may
or may not impact disease progression.
Here, we analyzed CD49d expression in a large cohort of CLL cases with the following aims: (i) to determine the exact frequency of CLL cases with a bimodal pattern of CD49d expression; (ii) to
highlight potential functional differences between the CD49d2
and CD49d1 cells in CLL expressing CD49d with a bimodal
pattern; and (iii) to evaluate the clinical impact of CD49d bimodal expression.
Methods
CLL patients and primary CLL cell characterization
The study, performed under the institutional review board (IRB) approval of the Aviano Centro di Riferimento Oncologico (ap-proval nos. IRB-05-2010 and IRB-05-2015), included 1630 CLL cases diagnosed and treated according to the current Interna-tional Workshop on Chronic Lymphocytic Leukemia (iwCLL)
guidelines,22 from a consecutive series of 2045 multicenter
patients all referred to the Clinical and Experimental Onco-Hematology Unit of the Centro di Riferimento Oncologico in Aviano for immunocytogenetic analyses between 2006 and 2017. For the purposes of clinical analyses, patients were split into 2 cohorts: cohort A (764 patients from a single center) and cohort B (866 patients from 5 different centers), whose clinical and bi-ological features are summarized in supplemental Table 1 (available on the Blood Web site). This study also included 158 CLL patients (47 cases relapsed/refractory [RR] CLL from the co-hort of 1630, and an additional 88 RR and 23 treatment-naive CLL) treated with ibrutinib in the context of a multicenter Italian named patient program; clinical and biological features of this cohort are summarized in supplemental Table 2. Informed consent was
obtained in accordance with the Declaration of Helsinki. Patients’
characterization included IGHV mutational status, cytogenetic abnormalities, TP53 and NOTCH1 mutations, all detected as
previously reported,2,23-27and clinical parameters, such as age, Rai
stage, andb-2-microglobulin (B2M) levels.
Immunophenotypic analyses, cell sorting,
proliferation assay, and telomere-length
measurements
Immunophenotypic analyses and cell sortings were performed on fresh PB, or paired PB and bone marrow (BM) samples at different time points using a FACSCanto I and a FACSAriaIII
(BD Biosciences, La Jolla, CA)flow cytometer/cell sorter upon
in-strument calibration with CS&T beads (BD Biosciences) using the FACSDiva software (BD Biosciences). Detailed guidelines for
the analysis and definition of CD49d bimodal expression28are
re-ported in supplemental Materials and methods.
Proliferation and telomere-length assays were performed using
previously published procedures.29,30Details on these assays,
and on the statistics used for clinical correlations are included in supplemental Materials and methods.
Results
Frequency of CD49d bimodal expression in CLL
CD49d expression was analyzed in PB samples from 1630 CLL cases at diagnosis (supplemental Table 1). According to the 30%
cutoff identified for clinical purposes,1,2904 cases (55.5%) were
CD49d2 and 726 cases (44.5%) were CD49d1. In 313 cases
(19.2%), CD49d had a bimodal expression (bimCD49d), with 2
separate cell populations, 1 completely negative, with a
fluores-cence signal superimposable to that of the negative control, and
the other positive, characterized by afluorescence signal
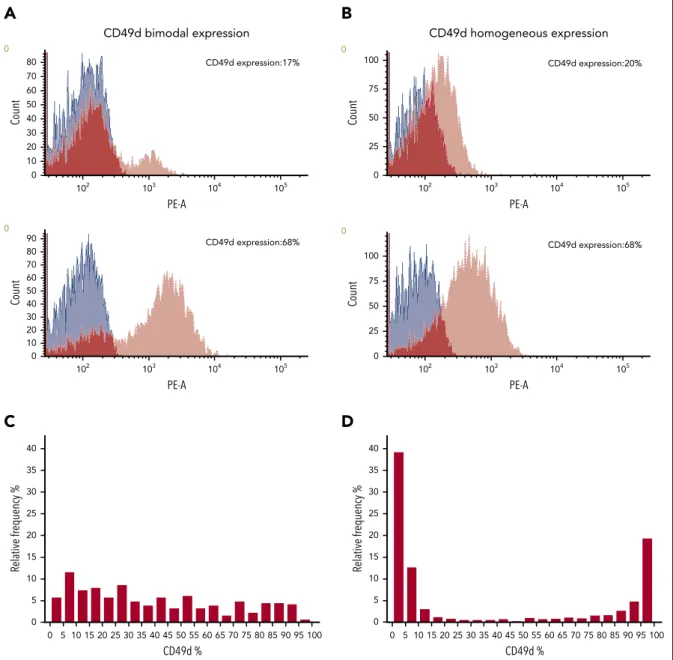
com-pletely above the cutoff (Figure 1A; supplemental Figure 1). CLL cells from the remaining 1317 patients (80.8%) expressed CD49d in a homogeneous pattern (homCD49d) (Figure 1B). In terms of percentage of CD49d-expressing CLL cells, virtually all values (ranging from 1% to 99%) were represented both in the bimCD49d and homCD49d groups. However, although in bimCD49d cases all CD49d expression values were almost equally represented, 90% of CLL with homCD49d expression showed either very low (56% of
cases with expression#20% CD49d) or very high (34% cases with
expression$80% CD49d) expression levels, with as low as 2% of
cases clustered around the 30% cutoff (Figure 1C-D), in keeping
with previous observations.1,2Of note, the vast majority of cases
expressing CD49d around the 30% cutoff (CD49d expression ranging between 20% and 40%) belonged to the bimCD49d group (67 of 94 cases; 71%).
The CD49d
2and CD49d
1cell subpopulations from
bimCD49d CLL derive from the same clone
The IGHV mutational status was assessed by Sanger sequencing in 303 bimCD49d. In 283 of 303 cases (93.4%), a unique IGHV sequence was detected, whereas among the remaining 20 cases
either multiple IGHV sequences were found (n5 14) or no IGHV
sequence could be determined (n5 6). A detailed description of
the IGHV gene usage and status is reported in supplemental Table 3. The IGHV sequence analysis was then repeated by
next-generation sequencing in the sorted CD49d2 and CD49d1
fractions from 31 bimCD49d samples with a variable amount of
CD49d1subpopulation, including 1 biclonal sample presenting
2 different immunoglobulin rearrangements by Sanger
se-quencing. Next-generation sequencing analysis confirmed a
unique IGHV sequence in both CD49d2and CD49d1fractions in
30 cases, and the concomitant presence of 2 sequences in the
biclonal sample, without differences between the CD49d2and
CD49d1fractions (supplemental Table 3).
The proportion of the CD49d
1subpopulation in
bimCD49d CLL tends to increase over time
Sequential samples were available in 94 bimCD49d and in 322 homCD49d patients (median sample interval: 34 months [range, 3-116 months] for bimCD49d and 35 months [range,
6-161 months] for homCD49d). Forty-two patients (44.7%) and 131 patients (40.7%) from the bimCD49d and homCD49d
groups, respectively, had received 1 line of therapy after thefirst
sampling, whereas the remaining patients received no treatment before the 2 samplings.
Compared with homCD49d CLL, where CD49d expression was highly stable over time (supplemental Figure 2A-B), bimCD49d cases were characterized by a higher variability of CD49d
ex-pression between thefirst and the second sample (supplemental
Figure 2C-D). Despite this, the proportion of CD49d1cells,
al-most stable between the first and the second sample in
un-treated bimCD49d cases (Figure 2A), increased after thefirst line
of treatment (P5 .03) (Figure 2B). Moreover, a detailed analysis
of CD49d expression in sequential samples from additional
bimCD49d CLL patients receiving 2 to 4 lines of therapy (n5 13;
median sample intervals5 33 months) highlighted an increasing
proportion of CD49d1cells with a tendency toward plateau as
the number of treatment lines increased (Figure 2C).
The proportion of CD49d
2and CD49d
1cell
subpopulations varies among different
tissue compartments
The proportion of CD49d2 and CD49d1 subpopulations was
analyzed in paired PB and BM samples from 13 bimCD49d
cases. A higher amount of CD49d1cells was observed in BM
compared with PB samples (P5 .0006). Notably, in 3 cases, the
CD49d1subset increased from,30% in the PB to .30% in the
BM (Figure 3A).
We next analyzed the amount of CD49d1cells in the context of
subpopulations with variable reciprocal densities of CXCR4/CD5
C
0 5 10 15 20 25 30 35 40 45 50 55 60 65 70 75 80 85 90 95 100 0 5 10 15 20 25 30 35 40 Re lative fr equency % CD49d %D
0 5 10 15 20 25 30 35 40 45 50 55 60 65 70 75 80 85 90 95 100 0 5 10 15 20 25 30 35 40 Relative fr equency % CD49d % CD49d bimodal expressionA
PE-A Count 102 0 10 20 30 40 50 60 70 80 0 103 104 105 CD49d expression:17% CD49d expression:68% 102 103 PE-A Count 104 105 0 0 10 20 30 40 50 60 70 90 80 CD49d homogeneous expressionB
CD49d expression:20% PE-A Count 0 0 25 50 75 100 102 103 104 105 CD49d expression:68% PE-A Count 0 0 25 50 75 100 102 103 104 105Figure 1. CD49d bimodal and homogeneous expression.(A-B) Histogram plots of CD49d expression (red) in 2 representative CLL cases with CD49d bimodal expression (A) and in 2 representative CLL cases with CD49d homogeneous expression (B). Blue histograms refer to unstained cells. The dark red color corresponds to the overlap of CD49d and unstained histogram plots. (C-D) Relative percentage of frequency of CD49d expression in CLL with CD49d bimodal (C) and CD49d homogeneous (D) expression.
(supplemental Figure 3), representing cell subsets defined as
“recent emigrants from tissue sites” (CXCR4dim/CD5bright) or
“attempting to reenter the tissue sites” (CXCR4bright/CD5dim)16
in 147 bimCD49d CLL. A median of 8% (range, 3% to 35%) and
7% (range, 3% to 14%) of total CLL populations was identified
as CXCR4dim/CD5bright and CXCR4bright/CD5dim, respectively.
Overall, the CXCR4dim/CD5brightfractions were characterized by
significantly higher proportions of CD49d1 cells compared
with their paired CXCR4bright/CD5dim fractions (P , .0001)
(Figure 3B).
CD49d
1cells display a higher propensity to
proliferate than CD49d
2cells
The CXCR4dim/CD5bright cell fraction is known to mark CLL
subsets with increased proliferation compared with CXCR4bright/
CD5dimcells.16Consistently, proliferation experiments using cells
from bimCD49d CLL (n5 10), evidenced a higher proportion of
proliferating cells in the CD49d1compared with the CD49d2
fractions (P5 .004) (supplemental Figure 4A-B), and no
acqui-sition or loss of CD49d expression by the CD49d2and CD49d1
fractions, respectively (supplemental Figure 5).
We next examined the telomere length in paired CD49d2and
CD49d1subpopulations from 15 CLL samples (supplemental
Figure 6). Despite an intraclonal variation in the length of in-dividual telomeres, all subpopulations tested showed overall short telomeres, indicating that they had undergone a large
number of cell divisions,31without substantial differences
be-tween the paired CD49d1and CD49d2cells (mean telomere
length, 3.1 kb and 3.2 kb, respectively). Of note, in 2 cases
(CLL#7 and CLL#8; supplemental Figure 6 arrows) the CD49d1
subpopulations displayed shorter telomeres (.1 kb difference)
A
B
0 20 40 60 80 100 %CD49d p=n.s. untreated1st sample 2nd sample 1st sample
pre-treatment 0 20 40 60 80 100 %CD49d p=0.03 2nd sample after treatment
C
%CD49d pre 1 2 3 4 lines of therapy 0 20 40 60 80 100 p=0.005 p=0.056 p=0.104 p=0.342 2 lines of therapy 3 lines of therapy 4 lines of therapybimCD49d CLL patients treated with: Figure 2. CD49d expression over time.CD49d expression was
evaluated in 2 sequential samples from 94 CLL cases with CD49d bimodal expression either untreated (n5 52; A) or treated once between the samples (n5 42; B). (C) Variation of the amount of CD49d1cells in sequential samples from 13 CD49d bimodal CLL treated with 2 lines of therapy (n5 3; blue symbols), 3 lines of therapy (n5 6; green symbols), or 4 lines of therapy (n 5 4; red symbols). Each symbol corresponds to a different case;P values refer to the paired Wilcoxon test (A-B) and to the Bonferroni-corrected Studentt test (a 5 0.0125).
A
B
p<0.0001 0 20 40 60 80 100 %CD49d CXCR4dim/ CD5bright CXCR4 bright/ CD5dim PB BM p=0.0006 0 20 40 60 80 100 %CD49dFigure 3. Amount of CD49d1cells in different tissue
compartments and in intraclonal populations from bimCD49d CLL.(A) Percentage of CD49d1cells in paired PB and BM samples from 13 CLL cases with CD49d bimodal expression. Each symbol corresponds to a different case. (B) Amount of CD49d1cells in intraclonal subpopulations with variable reciprocal densities of CXCR4/CD5 expression (CXCR4dim/CD5brightand CXCR4bright/CD5dimfractions) from 147 CLL cases with CD49d bimodal expression;P values refer to the paired Wilcoxon test.
compared with the CD49d2 cells, suggesting a greater
pro-liferative history for the CD49d1cell fractions.
Finally, we performed a comprehensive cytogenetic and
mu-tation analysis in the sorted CD49d2and CD49d1cell fractions
from 56 bimCD49d CLL cases characterized by 1 or more
ge-netic abnormalities (75 total tests).4,32In this context, significant
associations between CD49d1cells with trisomy 12 and NOTCH1
mutations, as we previously described,20,21and between CD49d2
cells and 17p deletion, were detected (supplemental Tables 4 and 5).
CLL patients with CD49d bimodal expression have
clinical behavior similar to CD49d
1CLL in the
context of standard chemoimmunotherapy
To study the clinical behavior of bimCD49d CLL in terms of overall survival (OS), CLL cases were split in 2 homogeneous
cohorts (cohort A and cohort B, see “Methods” and
supple-mental Table 1). To exclude a potential bias due to improved survival for patients treated with novel agents including ibrutinib, only patients treated with standard chemoimmunotherapy were
included in these analyses (n5 1522).
Notably, when comparing the clinical outcomes of bimCD49d2
(ie, with a CD49d1component,30% cutoff) and bimCD49d1
(ie, with a CD49d1component$30% cutoff) CLL, no OS
dif-ferences were found in the separate and combined cohorts (supplemental Figure 7A-B; Figure 4A). Moreover, no other cutoff values able to split bimCD49d cases into 2 groups with different OS could be selected by receiver operating charac-teristic curve analyses (supplemental Figure 8A-B). Conversely, the main clinical and biological parameters showed the expected trends of OS in both cohorts (supplemental Figure 9).
Given the superimposable clinical behavior of bimCD49d2and
bimCD49d1 CLL, we merged them in a single group and
compared their OS probabilities with those of homCD49d CLL split according to the 30% cutoff. bimCD49d cases displayed
significantly shorter OS compared with homCD49d2 CLL
(P, .0001 for cohort A, P 5 .0013 for cohort B, and P , .0001 for
the combined cohort), and no difference with homCD49d1CLL in
both the separate and combined cohorts (supplemental Figure 7C-D; Figure 4B).
The same analyses were performed using the treatment-free survival readout. The results obtained, overall similar to those obtained using the OS readout, are summarized in supplemental Figures 10-12.
CD49d bimodal expression has independent
prognostic impact in patients treated with
standard chemoimmunotherapy
To test the independent prognostic impact of bimCD49d
ex-pression, patients were split into 3 groups: homCD49d2,
homCD49d1, and bimCD49d. As summarized in supplemental
Table 6, the frequency of various negative clinical and biological features in bimCD49d CLL was usually intermediate between
that observed in homCD49d2and homCD49d1CLL, with the
exclusion of del17p/TP53 disruption, which showed the lowest frequency in bimCD49d CLL. By univariable analysis, both
homCD49d1and bimCD49d had a significantly increased hazard
of death (hazard ratio [HR]5 3.18 [95% confidence interval (CI),
2.41-4.19] and HR 5 2.37 [95% CI, 1.71-3.3], respectively)
compared with homCD49d2 patients (HR 5 1.0, reference;
Table 1). By Cox analysis for OS, both homCD49d1and bimCD49d
remained independent predictors after adjusting for Rai stage, age, IGHV mutation status, del17p, del11q, TP53 and NOTCH1 mutation status in a model that did not include B2M (Table 1,
model I, n5 1045) or did include B2M (Table 1, model II, n 5 753).
The same was observed in multivariable models considering TP53 disruption instead of del17p and TP53 mutations (supplemental Table 7).
Comparable results were obtained in a Cox analysis for
treatment-free survival. Again, homCD49d1and bimCD49d had
an increased risk of being treated in models that either included
B2M (n5 831) or not included B2M (n 5 1140) (supplemental
Table 8).
Finally, we compared the prognostic power of CD49d consid-ered either as dichotomous according to the canonical 30%
cutoff, or merging homCD49d1plus bimCD49d CLL, both in
univariable analysis and in the context of multivariable analyses that included Rai stage, age, IGHV, and TP53 mutation status
(supplemental Table 9). In both analyses, merging homCD49d1
and bimCD49d CLL outperformed the 30% cutoff (C index5
0.63 [95% CI, 0.59-0.67] vs 0.64 [95% CI, 0.60-0.67]; P, .001)
and improved the prognostic power of the Cox model
(C index 5 0.799 [95% CI, 0.748-0.809] vs 0.803 [95% CI,
0.750-0.814]; P, .001). Of note, bimCD49d cases that would
have been misassigned to a low-risk group accounted for 9% of cases, corresponding to 147 cases in our cohort.
CD49d bimodal expression correlated with shorter
PFS in ibrutinib-treated patients
The impact of CD49d bimodal expression on progression-free survival (PFS) under ibrutinib was evaluated in a cohort of 158 cases treated with ibrutinib in the context of an Italian multicenter named patient program, with a median follow-up of 16 months (supple-mental Table 2). Among 158 patients, 29 were from a previous
study of ours,33with follow-up information here updated. In all
cases, CD49d expression was evaluated before starting ibrutinib. The ibrutinib cohort was characterized by 39 bimCD49d cases (24.7%) and 119 homCD49d cases (75.3%). Also in this context, the CD49d 30% cutoff split homCD49d but not bimCD49d CLL into 2 groups with different prognoses (Figure 4C; supplemental Figure 13A). Moreover, bimCD49d cases displayed shorter
PFS than homCD49d2CLL (P5 .004), and no different PFS when
compared with homCD49d1 CLL (Figure 4C). Consistently,
homCD49d1and bimCD49d CLL combined in a single group
showed reduced PFS compared with homCD49d2CLL (P5 .0052;
supplemental Figure 13B).
The prognostic impact of homCD49d1/ bimCD49d CLL was
then tested in multivariable analyses. homCD49d1/ bimCD49d
CLL retained independent negative prognostic impact together
with TP53 disruption and.1 previous therapies, both in a
mul-tivariable model that considered the whole cohort of
ibrutinib-treated patients (n5 158; Table 2), and in a subgroup of RR CLL
(n5 124; Table 3) in which information on other prognostic
factors34was available (Tables 2 and 3).
We then verified whether the proportion of CD49d1 cells
varied over time during ibrutinib treatment in patients with
bimCD49d expression. Two consecutive samples were available in 8 bimCD49d cases, with a median time between the preibrutinib and postibrutinib sample collection of 28 months (range, 8-50 months).
In all cases, an increased proportion of CD49d1cells emerged
after treatment (P5 .0078; Figure 4D; supplemental Figure 14).
CD49d expression and CLL-IPI risk categories
Wefinally tested whether CD49d expression had an impact on
OS prediction in the context of the risk categories identified by
the International Prognostic Index (CLL-IPI).35Complete data to
score CLL cases according to the CLL-IPI were available in 878
patients from our cohort. The CLL-IPI was able to efficiently
segregate CLL patients in 4 risk categories characterized by
significantly different OS (Figure 5A). In the context of each risk
category, we further split patients into 2 groups according to
CD49d expression, considering homCD49d1 and bimCD49d
CLL as a single group (CD49d1/bimCD49d). CD49d1/bimCD49d
CLL showed reduced OS in all CLL-IPI risk categories with the exception of the very-high-risk group, in which the survival
probability of a very few CD49d2patients (n5 16) was similar to
that of CD49d1/bimCD49d patients (Figure 5B-E).
Discussion
This study was designed to investigate the functional and clinical implications of the bimodal expression of CD49d in CLL. In previous studies, we indicated the presence of CLL characterized
by bimodal CD49d expression,20,21but the frequency and the
clinical impact of CD49d bimodal expression has never been addressed. Here, using a large cohort of patients, we showed
that the frequency of CD49d bimodal cases accounted for;20%
of total cases. The CD49d2and CD49d1subpopulations from
the large majority of these bimodal cases shared the same IGHV rearrangement, confirming a common clonal origin.
CD49d in CLL is expressed at either very low or very high levels in most cases, with few cases displaying expression levels around
the 30% cutoff.1,2 This characteristic, associated with a low
probability of misclassifying patients, is further emphasized by the results from the present study. Indeed, after sorting out CLL cases with CD49d bimodal expression, the frequency of CLL cases with 20% to 40% CD49d expression in the homCD49d group turned out to be even lower (from 6% to 2%, ie, 27 of 1630 cases).
A
Over all survival (pr obability) Time (months) p=0.26 bimCD49d– (n=137) bimCD49d+ (n=155) 0 20 40 60 80 100 0 50 100 150 200 250 300C
homCD49d– (n=48) homCD49d+ (n=71) bimCD49d (n=39) p=0.0015 vs vs p=0.21 vs p=0.0220 Pr ogr es sion-fr ee survival (pr obability) 0 20 40 60 80 100 0 10 20 30 40 50 Time (months)B
homCD49d– (n=715) homCD49d+ (n=515) bimCD49d (n=292) p0.0001 vs vs p=0.11 0 20 40 60 80 100 0 50 100 150 200 250 300 350 Over all survival (pr obability) Time (months)D
%CD49d p=0.0078 pre-ibrutinib sample post-ibrutinib sample 0 20 40 60 80 100Figure 4. Clinical impact of CD49d bimodal expression in the context of chemoimmunotherapy and ibrutinib treatment.(A) OS Kaplan-Meier curves of all bimCD49d CLL cases split in bimCD49d2(blue curves) and bimCD49d1(red curves) groups according to the 30% cutoff. (B) OS Kaplan-Meier curves of CLL cases with bimodal CD49d expression (bimCD49d, purple curves), homogeneous-negative (homCD49d2, blue curves), and homogeneous-positive (homCD49d1, red curves) CD49d expression. (C) PFS Kaplan-Meier curves of ibrutinib-treated CLL cases with bimodal CD49d expression (bimCD49d, purple curve), negative (neg; blue curve), and positive (pos; red curve) homogeneous CD49d expression (homCD49d). (D) CD49d expression in 2 sequential samples from 8 CLL cases with CD49d bimodal expression treated with ibrutinib between samplings;P values refer to the log-rank test (A-C) and to the paired Wilcoxon test (D).
The temporal stability, another important feature of CD49d
expression,1,2,36has been here confirmed, particularly in the
context of CLL completely lacking CD49d, in line with the
methylation-dependent regulation of CD49d expression.21On
the other hand, a fine-tune regulation of CD49d expression,
observed in CLL cases with moderate to high CD49d expres-sion, has been already reported in previous studies showing
that microenvironmental stimuli are able to increase CD49d
expression.20,37Because ourflow cytometry analyses, based
on the acquisition of at least 10 000 CLL events, could reach the 1% sensitivity, we cannot exclude the presence of lower
percentages of CD49d1cells in CLL grouped as homCD49d2.
However, in none of these cases with sequential samples
available did a measurable CD49d1 clone emerge. At
vari-ance with what was reported in homCD49d CLL cases,
bimCD49d cases showed an overall increase of the CD49d1
subpopulation after treatment, with a tendency toward a plateau subsequent to multiple lines of therapy. This
ob-servation may be explained by the selection of CD49d1CLL
cells that find protection from therapy and/or gain
pro-liferative advantage in the context of microenvironmental
niches.38Consistently, the CD49d1subpopulation of bimodal
cases was increased in the BM, which is a privileged site of
relapse in CLL,39,40compared with PB. Even though we did not
have the chance to analyze paired LN-derived samples from CD49d bimodal cases, the analysis of CD49d expression in
the context of the proliferative fraction CXCR4low/CD5bright,
which was indicated as the group of cells recently egressed
from lymphoid tissues,16highlighted a higher proportion of
CD49d1 cells compared with their paired fractions.
Consis-tently, bimCD49d cases presented with LN involvement at
diagnosis more frequently compared with homCD49d2CLL,
but less frequently than CD49d1 CLL, in which baseline
lymphadenopathy accounted for;62% of cases, in line with
previously reported data.10 In this context, it remains to be
determined whether bimCD49d CLL may be more prone than
homCD49d2 CLL to develop lymphadenopathy during the
course of the disease.10
Table 1. Cox regression analysis of OS
Factor
Univariable analysis
Multivariable analysis:
model I (n5 1045) Multivariable analysis:model II (n5 753) Cases HR 95% CI P HR 95% CI P HR 95% CI P
homCD49d1* 1522 3.18 2.41-4.19 ,.0001 2.13 1.52-2.99 ,.0001 2.65 1.76-3.98 ,.0001
bimCD49d† 1522 2.37 1.71-3.30 ,.0001 2.12 1.44-3.12 .0001 2.70 1.74-4.17 ,.0001
Age. 65 y 1522 3.16 2.46-4.06 ,.0001 4.05 2.96-5.54 ,.0001 3.72 2.55-5.44 ,.0001
Rai stage II-IV 1515 2.68 2.10-3.43 ,.0001 1.82 1.32-2.44 .0001 n.i. n.i. n.i.
UM IGHV 1385 3.88 3.02-5.00 ,.0001 2.41 1.79-3.24 ,.0001 2.78 1.99-3.91 ,.0001
del17p 1407 4.81 3.29-7.03 ,.0001 n.i. n.i. n.i. 2.21 1.44-3.38 .0003
del11q 1407 2.56 177-3.69 ,.0001 n.i. n.i. n.i. n.i. n.i. n.i.
tri12 1407 1.82 1.29-2.56 .0006 2.32 1.64-3.29 ,.0001 0.65 0.43-0.98 .0423
TP53 mutated 1253 3.04 2.23-4.16 ,.0001 2.41 1.79-3.24 ,.0001 n.i. n.i. n.i.
NOTCH1 mutated 1444 2.02 1.54-2.65 ,.0001 n.i. n.i. n.i. n.i. n.i. n.i.
b2M . ULN 1017 4.12 3.01-5.63 ,.0001 — — — 1.73 1.18-2.52 .0048
All factors used in univariable analyses were entered in the multivariable analysis.
—, variable not included in the model; b2M, b-2 microglobulin; CI, confidence interval; del, deletion; HR, hazard ratio; n.i., not included in the model after stepwise selection; tri, trisomy; ULN, upper limit of normal; UM, unmutated.
*homCD49d1refers to CLL cases with$30% homogeneous expression of CD49d.
†bimCD49d refers to CLL cases with bimodal expression of CD49d.
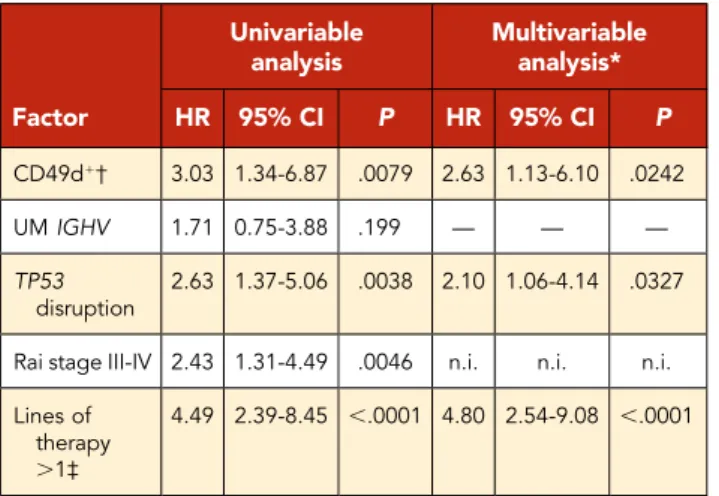
Table 2. Cox regression analysis for PFS in ibrutinib-treated CLL cohort (whole cohort, n5 158)
Factor Univariable analysis Multivariable analysis* HR 95% CI P HR 95% CI P CD49d1† 3.03 1.34-6.87 .0079 2.63 1.13-6.10 .0242 UM IGHV 1.71 0.75-3.88 .199 — — — TP53 disruption 2.63 1.37-5.06 .0038 2.10 1.06-4.14 .0327
Rai stage III-IV 2.43 1.31-4.49 .0046 n.i. n.i. n.i. Lines of
therapy .1‡
4.49 2.39-8.45 ,.0001 4.80 2.54-9.08 ,.0001
*All factors with a significant P value in univariable analyses were entered in the multivariable analysis.
†CD49d1cases were obtained by combining cases with$30% homogeneous CD49d
expression and cases with CD49d bimodal expression. ‡Comparison between 0 and 1 vs .1 lines of therapy.
In keeping with the association with a CXCR4low/CD5bright
phenotype,16 CD49d1 subpopulations also showed a higher
proliferation potential than the CD49d2counterpart. The
rea-sons behind this phenomenon cannot be explained by the mere expression of CD49d, but rather can be sought in the
prefer-ential expression by the CD49d1 cells of other costimulatory
molecules. Even though the present study has not addressed this issue, previous reports by our and other groups showed high correlation and close relationship between expression of CD49d
and CD38,19,41-43 a molecule that was reported to label a
sub-set enriched in proliferating cells within CLL clones, and associated with the risk of disease progression even when expressed in a
subfraction of CLL cells.44,45Moreover, here we corroborated our
previousfindings of a significant association between CD49d1cells
with trisomy 12 and NOTCH1 mutations,26,27pointing to a possible
role of NOTCH1 mutations in driving cell survival and proliferation
in CD49d1cells through NF-kB pathway activation.20,37
Despite the higher proliferative capacity of the CD49d1
sub-populations observed in vitro, CD49d2and CD49d1cells did not
show different replicative histories in the majority of the in-vestigated cases, pointing to a balanced proliferation rate
in vivo. However, different telomerase activity between CD49d2
and CD49d1 cells can be hypothesized,46 and that different
telomere shortening may occur in follow-up samples cannot be
ruled out, as it was reported in CLL cases with clonal evolution.47
In light of all previous considerations, it was not completely un-expected that bimCD49d CLL patients, even in the presence of a
small CD49d1subpopulation, followed a clinical outcome similar
to that of homCD49d1patients in CLL cases treated with
con-ventional chemoimmunotherapy. Of note, both homCD49d1
and bimCD49d expression retained independent prognostic impact in multivariate models, which included the main clinical
and biological prognosticators.22Consistently, the combination
of homCD49d1with bimCD49d CLL in 1 single group outperformed
the 30% cutoff as OS predictor both in univariable and multi-variable analyses.
The negative prognostic impact of CD49d in the ibrutinib set-ting was previously reported by us in CLL patients from 2
in-dependent ibrutinib-treated cohorts.33In the present study, we
could confirm CD49d expression as a negative prognostic marker in patients treated with ibrutinib, and showed that both
homCD49d1CLL, and bimCD49d CLL experienced significantly
shorter PFS than CD49d2CLL. Moreover, the homCD49d1and
bimCD49d categories turned out both independent prognosti-cators in the context of multivariable models that included the main clinical and biological covariates with a clinical impact in the
ibrutinib setting.34Further validation studies with longer follow-up
and larger cohorts of patients are needed to definitely validate
CD49d as OS predictor in the context of target therapies. Our previous study showed that, after 1 year of ibrutinib
treat-ment, the LN mass reduction was lower in CD49d1compared with
CD49d2 CLL.33 Consistently, the increasing proportion of the
CD49d1subpopulation observed here in 8 CLL cases with CD49d
bimodal expression after ibrutinib treatment strongly supports the hypothesis of a higher resistance to treatment of CD49d-expressing cells. In light of these data, it would be interesting
to evaluate whether higher percentages of the CD49d1
sub-population could be found in tissue compartments other than PB. Overall, our data point to a potential relevant role of CD49d to clinical practice, also in light of its ability to separate patients with different OS probability in the context of the CLL-IPI risk
categories.35In this regard, further validation studies are needed
to test whether including CD49d expression, either homogeneous or bimodal, in a comprehensive prognostic risk score may help to better stratify patients treated with chemoimmunotherapy or targeted therapy.
In summary, in the present study, we have reported for thefirst
time the presence of CD49d bimodal expression in;20% of CLL
cases. The CD49d1cells from bimodal CD49d CLL displayed
higher levels of proliferation compared with the CD49d2cells,
and were more highly represented in the BM compared with PB, and in CLL subsets enriched in proliferative cells. The higher
proliferative capacity of CD49d1cells was in keeping with the
tendency of the CD49d1subpopulation to increase over time
especially after therapy. In this regard, it is tempting to speculate
that the CD49d1subpopulation, even if it represents a minority
of the tumor, may support the progression of the entire clone. Indeed, from a clinical point of view, the presence of small cell
CD49d1 populations was consistently associated with bad
prognosis, suggesting that bimCD49d and homCD49d1CLL be
Table 3. Cox regression analysis for PFS in ibrutinib-treated CLL (R/R cohort, n5 124) Factor Univariable analysis Multivariable analysis* HR 95% CI P HR 95% CI P CD49d1† 3.42 1.39-8.43 .0075 3.41 1.32-8.79 .0112 UM IGHV 1.94 0.67-5.58 .2191 — — — TP53 disruption 4.01 1.82-8.82 .0006 3.06 1.34-6.97 .0079 Hemoglobin, g/L ,110 for women 3.73 1.79-7.78 .0004 — — — ,120 for men Rai stage III-IV 2.87 1.40-5.91 .0041 — — — b2M $5 mg/L 1.09 0.44-2.68 .8513 — — — LDH. ULN 2.14 1.05-4.40 .0373 — — —
Time from last therapy ,24 mo 1.98 0.90-4.38 .0907 — — — Lines of therapy.1‡ 5.08 2.34-11.03 ,.0001 6.68 2.91-15.35 ,.0001 LDH, lactose dehydrogenase.
*Significant features for multivariate analysis were selected through a Cox LASSO (least absolute shrinkage and selection operator) regression, selecting variables with nonzero coefficient under the best l selected by the model.48
†CD49d1cases were obtained by combining cases with$30% homogeneous CD49d
expression and cases with CD49d bimodal expression. ‡Comparison between 1 and .1 lines of therapy.
merged together to improve the prognostic power of CD49d in the clinical setting.
Acknowledgments
The work was supported by Associazione Italiana Ricerca Cancro (AIRC) Investigator Grant IG-21687, Milan, Italy (V.G.); Progetto Giovani Ricercatori no. GR-2011-02346826, Ministero della Salute, Rome, Italy (A.Z.); Progetto Ricerca Finalizzata PE 2016-02362756, Ministero
della Salute, Rome, Italy (V.G.); Associazione Italiana contro le Leu-cemie, Linfomi e Mielomi (AIL), Venezia Section, Pramaggiore Group, Italy (V.G.); Linfo-check–Bando Ricerca–Contributo (art. 15, comma 2, lett b) LR 17/2014 (V.G.);“531000 Intramural Program,” Centro di Riferimento Oncologico, Aviano, Italy (V.G.); the Forschungskommission Freiburg (T.N.H.); European Research Council (ERC) Consolidator Grant CLLCLONE ID: 772051 (D.R.); grant no. 320030_169670/1 Swiss Na-tional Science Foundation, Berne, Switzerland (D.R.); Fondazione Fidinam, Lugano, Switzerland (D.R.); Nelia & Amadeo Barletta Foun-dation, Lausanne, Switzerland (D.R.); Fond’Action, Lausanne, Switzerland 0 20 40 60 80 100 0 50 100 150 200 250 300 350 p0.0001 Over all survival (pr obability) Time (months) homCD49d– (n=245) homCD49d+ bimCD49d (n=158) Low risk
B
D
0 20 40 60 80 100 0 50 100 150 200 250 300 350 Over all survival (pr obability) Time (months) p=0.012 High risk homCD49d– (n=64) homCD49d+ bimCD49d (n=107)C
0 20 40 60 80 100 0 50 100 150 200 250 300 350 Over all survival (pr obability) Time (months) p=0.035 Intermediate risk homCD49d– (n=101) homCD49d+ bimCD49d (n=137)E
0 20 40 60 80 100 0 50 100 150 200 250 300 350 Over all survival (pr obability) Time (months) p=0.35Very high risk
homCD49d– (n=16) homCD49d+ bimCD49d (n=50)
A
0 20 40 60 80 100 0 50 100 150 200 250 300 350 Over all survival (pr obability) Time (months) CLL-IPI Low risk (n=403) Intermediate risk (n=238) High risk (n=171)Very high risk (n=66) vs vs vs p=0.0002 p=0.0004 p=0.0001
Figure 5. Clinical impact of CD49d expression in the context of CLL-IPI categories.(A) OS Kaplan-Meier curves of CLL cases split in the 4 risk categories of the CLL IPI. (B-E) OS curves of CLL cases with homogeneous-negative CD49d expression (homCD49d2, light curve) and the merging of homogeneous-positive (homCD49d1) and bimodal CD49d (bimCD49d) expression (dark curve) in the context of the low-risk (B), intermediate-risk (C), high-risk (D) and very-high-risk (E) categories of the CLL-IPI.P values refer to the log-rank test.
(D.R.); Translational Research Program, no. 6594-20, The Leukemia & Lymphoma Society, New York (D.R.); AIRC 53 1000 no. 21198, Milan, Italy (G.G.); RF-2011-02349712, Ministero della Salute, Rome, Italy (G.G.); PRIN 2015ZMRFEA_004, MIUR, Rome, Italy (G.G.); and AGING Project–Department of Excellence–DIMET, UPO, Novara, Italy (G.G.).
Authorship
Contribution: A.Z. and V.G. designed the study, coordinated the ex-periments, and wrote the manuscript; E.T., F.P., and D.B performed immunophenotypic analyses, analyzed the data, and contributed to the writing of the manuscript; C.C., T.B., F.M.R., and R.B. performed cell sorting, performed proliferation experiments, and contributed to molecular characterization of the samples; P.N., H.C., I.C., and E.Z. performed immunophenotypic and molecular analyses; K.N. per-formed telomere-length analyses; J.P. and G.T. perper-formed statistical analyses; M.G., R.M., E.S., I.I., J.O., G.D., L.L., F.Z., G.P., A.C., F.D.R., D.R., G.G., and G.D.P. provided well-characterized biological samples and contributed to the revision of the manuscript; and C.P. and T.N.H. contributed to scientific discussion, data interpretation, and the re-vision of the manuscript.
Conflict-of-interest disclosure: D.R. received research funding from AbbVie, Janssen, and Cellestia and honoraria from AbbVie, AstraZeneca, Gilead, Janssen, Verastem, and Loxo. G.G. has acted as a consultant in advisory boards for Janssen, AbbVie, Sunesys, and AstraZeneca and in speaker’s bureaus for Janssen and AbbVie. The remaining authors de-clare no competingfinancial interests.
ORCID profiles: F.P., 0000-0002-2986-7658; L.L., 0000-0002-8327-1396; C.P., 0003-3603-8839; T.N.H., 0002-0377-7179; A.Z., 0000-0003-3678-5957.
Correspondence: Antonella Zucchetto, Clinical and Experimental Onco-Hematology Unit, Centro di Riferimento Oncologico di Aviano (CRO) IRCCS, Via Franco Gallini 2, 33081 Aviano (PN), Italy; e-mail: zucchetto.soecs@cro.it; or Valter Gattei, Clinical and Experimental Onco-Hematology Unit, Centro di Riferimento Oncologico di Aviano (CRO) IRCCS, Via Franco Gallini 2, 33081 Aviano (PN), Italy; e-mail: vgattei@cro.it.
Footnotes
Submitted 19 September 2019; accepted 22 January 2020; prepublished online on Blood First Edition 31 January 2020. DOI 10.1182/blood. 2019003179.
*E.T., F.P., and D.B. contributed equally asfirst authors. †A.Z. and V.G. contributed equally as senior authors. For original data, please e-mail the corresponding author. The online version of this article contains a data supplement. The publication costs of this article were defrayed in part by page charge payment. Therefore, and solely to indicate this fact, this article is hereby marked“advertisement” in accordance with 18 USC section 1734.
R E F E R E N C E S
1. Bulian P, Shanafelt TD, Fegan C, et al. CD49d
is the strongestflow cytometry-based
pre-dictor of overall survival in chronic lymphocytic leukemia. J Clin Oncol. 2014;32(9):897-904. 2. Gattei V, Bulian P, Del Principe MI, et al.
Relevance of CD49d protein expression as overall survival and progressive disease prognosticator in chronic lymphocytic leuke-mia. Blood. 2008;111(2):865-873.
3. Shanafelt TD, Geyer SM, Bone ND, et al. CD49d expression is an independent pre-dictor of overall survival in patients with chronic lymphocytic leukaemia: a prognostic parameter with therapeutic potential. Br J Haematol. 2008;140(5):537-546.
4. Dal Bo M, Bulian P, Bomben R, et al. CD49d prevails over the novel recurrent mutations as independent prognosticator of overall survival in chronic lymphocytic leukemia. Leukemia. 2016;30(10):2011-2018.
5. Rossi D, Zucchetto A, Rossi FM, et al. CD49d expression is an independent risk factor of progressive disease in early stage chronic lymphocytic leukemia. Haematologica. 2008; 93(10):1575-1579.
6. Hartmann TN, Grabovsky V, Wang W, et al. Circulating B-cell chronic lymphocytic leuke-mia cells display impaired migration to lymph nodes and bone marrow. Cancer Res. 2009; 69(7):3121-3130.
7. Dal Bo M, Tissino E, Benedetti D, et al. Microenvironmental interactions in chronic lymphocytic leukemia: the master role of CD49d. Semin Hematol. 2014;51(3):168-176. 8. Pasikowska M, Walsby E, Apollonio B, et al.
Phenotype and immune function of lymph node and peripheral blood CLL cells are linked to transendothelial migration. Blood. 2016; 128(4):563-573.
9. Till KJ, Lin K, Zuzel M, Cawley JC. The chemokine receptor CCR7 and alpha4 integrin are important for migration of chronic lym-phocytic leukemia cells into lymph nodes. Blood. 2002;99(8):2977-2984.
10. Strati P, Parikh SA, Chaffee KG, et al. CD49d associates with nodal presentation and sub-sequent development of lymphadenopathy in patients with chronic lymphocytic leukaemia. Br J Haematol. 2017;178(1):99-105. 11. Bulian P, Bomben R, Bo MD, et al. Mutational
status of IGHV is the most reliable prognostic marker in trisomy 12 chronic lymphocytic leukemia. Haematologica. 2017;102(11): e443-e446.
12. Liso V, Capalbo S, Lapietra A, Pavone V, Guarini A, Specchia G. Evaluation of trisomy
12 byfluorescence in situ hybridization in
peripheral blood, bone marrow and lymph nodes of patients with B-cell chronic lym-phocytic leukemia. Haematologica. 1999; 84(3):212-217.
13. Chiorazzi N, Ferrarini M. Evolving view of the in-vivo kinetics of chronic lymphocytic leuke-mia B cells. Hematology Am Soc Hematol Educ Program. 2006;2006:273-278, 512. 14. Ponzoni M, Doglioni C, Caligaris-Cappio F.
Chronic lymphocytic leukemia: the pathologist’s
view of lymph node microenvironment. Semin Diagn Pathol. 2011;28(2):161-166.
15. Herishanu Y, P ´erez-Gal ´an P, Liu D, et al. The lymph node microenvironment promotes B-cell receptor signaling, NF-kappaB activa-tion, and tumor proliferation in chronic lym-phocytic leukemia. Blood. 2011;117(2): 563-574.
16. Calissano C, Damle RN, Marsilio S, et al. Intraclonal complexity in chronic lymphocytic leukemia: fractions enriched in recently born/
divided and older/quiescent cells. Mol Med. 2011;17(11-12):1374-1382.
17. Eksio˘glu-Demiralp E, Alpdo ˘gan O, Aktan M,
et al. Variable expression of CD49d antigen in B cell chronic lymphocytic leukemia is related to disease stages. Leukemia. 1996;10(8): 1331-1339.
18. Zucchetto A, Sonego P, Degan M, et al. Signature of B-CLL with different prognosis by Shrunken centroids of surface antigen
ex-pression profiling. J Cell Physiol. 2005;204(1):
113-123.
19. Zucchetto A, Bomben R, Dal Bo M, et al. CD49d in B-cell chronic lymphocytic leuke-mia: correlated expression with CD38 and prognostic relevance. Leukemia. 2006;20(3): 523-525, author reply 528-529.
20. Benedetti D, Tissino E, Pozzo F, et al. NOTCH1 mutations are associated with high CD49d expression in chronic lymphocytic leukemia: link between the NOTCH1 and the
NF-kB pathways. Leukemia. 2018;32(3):
654-662.
21. Zucchetto A, Caldana C, Benedetti D, et al. CD49d is overexpressed by trisomy 12 chronic lymphocytic leukemia cells: evidence for a methylation-dependent regulation mecha-nism. Blood. 2013;122(19):3317-3321. 22. Hallek M, Cheson BD, Catovsky D, et al. iwCLL
guidelines for diagnosis, indications for treatment, response assessment, and sup-portive management of CLL. Blood. 2018; 131(25):2745-2760.
23. Bomben R, Dal Bo M, Capello D, et al. Comprehensive characterization of IGHV3-21-expressing B-cell chronic lymphocytic leuke-mia: an Italian multicenter study. Blood. 2007; 109(7):2989-2998.
24. Bomben R, Dal Bo M, Capello D, et al. Molecular and clinical features of chronic
lymphocytic leukaemia with stereotyped B cell receptors: results from an Italian multicentre study. Br J Haematol. 2009;144(4):492-506. 25. Pozzo F, Bittolo T, Arruga F, et al. NOTCH1
mutations associate with low CD20 level in chronic lymphocytic leukemia: evidence for a NOTCH1 mutation-driven epigenetic dysre-gulation. Leukemia. 2016;30(1):182-189. 26. Pozzo F, Bittolo T, Vendramini E, et al.
NOTCH1-mutated chronic lymphocytic leu-kemia cells are characterized by a MYC-related overexpression of nucleophosmin 1 and ribosome-associated components. Leukemia. 2017;31(11):2407-2415. 27. Rossi D, Khiabanian H, Spina V, et al. Clinical
impact of small TP53 mutated subclones in chronic lymphocytic leukemia. Blood. 2014; 123(14):2139-2147.
28. Erez A, Vogel R, Mugler A, Belmonte A, Altan-Bonnet G. Modeling of cytometry data in logarithmic space: When is a bimodal distri-bution not bimodal? Cytometry A. 2018;93(6): 611-619.
29. Norris K, Hillmen P, Rawstron A, et al. Telomere length predicts for outcome to FCR chemotherapy in CLL. Leukemia. 2019;33(8): 1953-1963.
30. Bomben R, Gobessi S, Dal Bo M, et al. The
miR-17;92 family regulates the response to
Toll-like receptor 9 triggering of CLL cells with unmutated IGHV genes. Leukemia. 2012; 26(7):1584-1593.
31. Damle RN, Batliwalla FM, Ghiotto F, et al. Telomere length and telomerase activity de-lineate distinctive replicative features of the
B-CLL subgroups defined by immunoglobulin
V gene mutations. Blood. 2004;103(2): 375-382.
32. Rossi D, Spina V, Bomben R, et al. Association
between molecular lesions and specific B-cell
receptor subsets in chronic lymphocytic leu-kemia. Blood. 2013;121(24):4902-4905.
33. Tissino E, Benedetti D, Herman SEM, et al. Functional and clinical relevance of VLA-4 (CD49d/CD29) in ibrutinib-treated chronic lymphocytic leukemia. J Exp Med. 2018; 215(2):681-697.
34. Soumerai JD, Ni A, Darif M, et al. Prognostic risk score for patients with relapsed or re-fractory chronic lymphocytic leukaemia treated with targeted therapies or chemo-immunotherapy: a retrospective, pooled co-hort study with external validations. Lancet Haematol. 2019;6(7):e366-e374.
35. International CLL-IPI working group. An in-ternational prognostic index for patients with chronic lymphocytic leukaemia (CLL-IPI): a meta-analysis of individual patient data. Lancet Oncol. 2016;17(6):779-790. 36. Gooden CE, Jones P, Bates R, et al. CD49d
shows superior performance characteristics for flow cytometric prognostic testing in chronic lymphocytic leukemia/small lymphocytic lymphoma. Cytometry B Clin Cytom. 2018; 94(1):129-135.
37. Buggins AG, Pepper C, Patten PE, et al. Interaction with vascular endothelium en-hances survival in primary chronic lymphocytic leukemia cells via NF-kappaB activation and de novo gene transcription. Cancer Res. 2010; 70(19):7523-7533.
38. Burger JA. Nurture versus nature: the micro-environment in chronic lymphocytic leukemia. Hematology Am Soc Hematol Educ Program. 2011;2011:96-103.
39. Thompson PA, Wierda WG. Eliminating min-imal residual disease as a therapeutic end point: working toward cure for patients with CLL. Blood. 2016;127(3):279-286. 40. Brachtl G, Sahakyan K, Denk U, et al.
Differential bone marrow homing capacity of VLA-4 and CD38 high expressing chronic lymphocytic leukemia cells. PLoS One. 2011; 6(8):e23758.
41. Zucchetto A, Benedetti D, Tripodo C, et al. CD38/CD31, the CCL3 and CCL4 chemo-kines, and CD49d/vascular cell adhesion molecule-1 are interchained by sequential events sustaining chronic lymphocytic leuke-mia cell survival. Cancer Res. 2009;69(9): 4001-4009.
42. Zucchetto A, Vaisitti T, Benedetti D, et al. The CD49d/CD29 complex is physically and functionally associated with CD38 in B-cell chronic lymphocytic leukemia cells. Leukemia. 2012;26(6):1301-1312.
43. Brachtl G, Piñ ´on Hofbauer J, Greil R, Hartmann TN. The pathogenic relevance of the prognostic markers CD38 and CD49d in chronic lymphocytic leukemia. Ann Hematol. 2014;93(3):361-374.
44. Damle RN, Temburni S, Calissano C, et al. CD38 expression labels an activated subset within chronic lymphocytic leukemia clones enriched in proliferating B cells. Blood. 2007; 110(9):3352-3359.
45. Ghia P, Guida G, Stella S, et al. The pattern of
CD38 expression defines a distinct subset of
chronic lymphocytic leukemia (CLL) patients at risk of disease progression. Blood. 2003; 101(4):1262-1269.
46. Terrin L, Trentin L, Degan M, et al. Telomerase expression in B-cell chronic lymphocytic leu-kemia predicts survival and delineates sub-groups of patients with the same igVH mutation status and different outcome. Leukemia. 2007;21(5):965-972.
47. Jebaraj BMC, Tausch E, Landau DA, et al. Short telomeres are associated with inferior outcome, genomic complexity, and clonal evolution in chronic lymphocytic leukemia. Leukemia. 2019;33(9):2183-2194. 48. Tibshirani R. The lasso method for variable
selection in the Cox model. Stat Med. 1997; 16(4):385-395.