Publisher’s version / Version de l'éditeur:
Cement and Concrete Composites, 32, 5, pp. 360-368, 2010-05-01
READ THESE TERMS AND CONDITIONS CAREFULLY BEFORE USING THIS WEBSITE.
https://nrc-publications.canada.ca/eng/copyright
Vous avez des questions? Nous pouvons vous aider. Pour communiquer directement avec un auteur, consultez la
première page de la revue dans laquelle son article a été publié afin de trouver ses coordonnées. Si vous n’arrivez pas à les repérer, communiquez avec nous à PublicationsArchive-ArchivesPublications@nrc-cnrc.gc.ca.
Questions? Contact the NRC Publications Archive team at
PublicationsArchive-ArchivesPublications@nrc-cnrc.gc.ca. If you wish to email the authors directly, please see the first page of the publication for their contact information.
NRC Publications Archive
Archives des publications du CNRC
This publication could be one of several versions: author’s original, accepted manuscript or the publisher’s version. / La version de cette publication peut être l’une des suivantes : la version prépublication de l’auteur, la version acceptée du manuscrit ou la version de l’éditeur.
For the publisher’s version, please access the DOI link below./ Pour consulter la version de l’éditeur, utilisez le lien DOI ci-dessous.
https://doi.org/10.1016/j.cemconcomp.2010.02.001
Access and use of this website and the material on it are subject to the Terms and Conditions set forth at
Modeling the kinetics of corrosion in concrete patch repairs and identification of governing parameters
Soleimani, S.; Ghods, P.; Isgor, O. B.; Zhang, J. Y.
https://publications-cnrc.canada.ca/fra/droits
L’accès à ce site Web et l’utilisation de son contenu sont assujettis aux conditions présentées dans le site LISEZ CES CONDITIONS ATTENTIVEMENT AVANT D’UTILISER CE SITE WEB.
NRC Publications Record / Notice d'Archives des publications de CNRC: https://nrc-publications.canada.ca/eng/view/object/?id=f39da580-4209-4516-b9b8-2e6d9bfd2bf3 https://publications-cnrc.canada.ca/fra/voir/objet/?id=f39da580-4209-4516-b9b8-2e6d9bfd2bf3
http://www.nrc-cnrc.gc.ca/irc
M ode ling t he k ine t ic s of c orrosion in c onc re t e pa t c h re pa irs a nd ide nt ific a t ion of gove rning pa ra m e t e rs
N R C C - 5 3 5 7 1
S o l e i m a n i , S . ; G h o d s , P . ; I s g o r , O . B . ; Z h a n g , J . Y . ; L o u n i s , Z .
M a y 2 0 1 0
A version of this document is published in / Une version de ce document se trouve dans: Cement and Concrete Composites, 32, (5), pp. 360-368, May 01, 2010, DOI: 10.1016/j.cemconcomp.2010.02.001
The material in this document is covered by the provisions of the Copyright Act, by Canadian laws, policies, regulations and international agreements. Such provisions serve to identify the information source and, in specific instances, to prohibit reproduction of materials without written permission. For more information visit http://laws.justice.gc.ca/en/showtdm/cs/C-42
Les renseignements dans ce document sont protégés par la Loi sur le droit d'auteur, par les lois, les politiques et les règlements du Canada et des accords internationaux. Ces dispositions permettent d'identifier la source de l'information et, dans certains cas, d'interdire la copie de documents sans permission écrite. Pour obtenir de plus amples renseignements : http://lois.justice.gc.ca/fr/showtdm/cs/C-42
Modeling the Kinetics of Corrosion in Concrete Patch Repairs and
Identification of Governing Parameters
S. Soleimani1, P. Ghods1, O.B. Isgor1,* and J. Zhang2
(1)
Carleton University, Dept. of Civil & Env. Engineering, Ottawa, Ontario, Canada
(2)
National Research Council of Canada, Ottawa, Ontario, Canada
(*)
Corresponding author, burkan_isgor@carleton.ca
Abstract: Patch repair is a commonly used method for rectifying localized corrosion
damage in reinforced concrete members. The ring-anode effect, which is corrosion at the intersection between the substrate and the repaired concrete as a result of the electrochemical imbalance, however, is a commonly observed failure mechanism after patch repairs. In this study, the kinetics of the corrosion in the ring-anode zones of repaired concrete structures is investigated by numerical modeling. All simulations, in agreement with the existing experimental and in situ observations, have demonstrated the formation of a ring-anode zone in the 2-5 cm portion of the substrate from the interface. Furthermore, the anodic current density in the ring-anode zone is found to have a peak near the repaired concrete and asymptotically approaches to the corrosion density observed in the substrate before the patch repair. More importantly, the simulations demonstrate quantitatively how various parameters affect the ring-anode corrosion. It was found that concrete resistivity is the most significant factor that influences the magnitude of macrocell corrosion, followed by the availability of oxygen in the patch. It was observed that the ring-anode effect is a localized problem; hence the size of the patch and the cover thickness are not significant factors affecting the phenomenon. The investigations of the importance of these factors provide useful information for field practice.
Keywords: Reinforcement (D), Corrosion (C), Modeling (E), Electrical properties (C),
Patch Repair (Nominated Keyword)
1. INTRODUCTION
Corrosion of steel in concrete is one of the most costly durability problems that cause the degradation of concrete structures in terms of structural safety, integrity, and serviceability. Patch repair is a commonly used method for rectifying localized damage in reinforced concrete members such as highway bridge decks and columns. The process of patch repair consists of the removal of loose concrete that has cracked, spalled, or delaminated; (often) the application of surface treatment on the steel; and the replacement of the defective concrete with patching materials that normally reestablish the original form of the member. Any repair of corrosion-induced damage must aim at stopping one or more of the following processes that are required for the corrosion process proceed: 1) the anodic process; 2) the cathodic process; and/or 3) the electrolytic conduction process between the anodic and cathodic sites on the steel reinforcement [1]. The main objective of the patch repairs of corrosion-induced damage in concrete structures is, at the very least, to prevent the anodic reaction from recurring in the repaired area.
Many patch repairs, however, have been found to last for only a few months to a year before the appearance of new corrosion damage. Recurring corrosion after patch repair can be initiated in one of the three areas: the substrate (adjacent unrepaired area), patch area, or at the interface between them [2-8]; however, it has often been noted to occur in the substrate very close to the interface or at the interface. This is known as ring-anode 26
effect, and the cause has been attributed to macrocell corrosion formed between the steel in the repaired patch (macrocell cathode) and the steel in the substrate (macrocell anode), as evidenced by experimental demonstrations [2-6]. It is well understood that the driving force for macrocell corrosion is the electrochemical incompatibility between the patch and the substrate [9-13], which can be defined as the imbalance in electrochemical potential between different locations of the reinforcing steel because of their dissimilar environments caused by the patch repair [11]. The dissimilar environments can be due to the differences in both physical properties (e.g., porosity) and chemical compositions. For example, the newly patched area is usually free of chloride ions, while the substrate is not. Consequently, the corrosion potential of the steel in a patch can be much higher than that in a substrate; this electrochemical potential imbalance was shown to be as high as 500 mV [4].
Electrochemical potential imbalance explains the thermodynamics of macrocell corrosion caused by patch repairs. The kinetics of macrocell corrosion ⎯ the corrosion current density and its distribution along the reinforcing bar ⎯ that directly leads to deterioration, however, are not well understood and very limited knowledge exists on the key factors that affect these key characteristics [14]. Understanding the distribution of the corrosion current density along the rebar is critical to predict the location and the severity of the corrosion damage. Experimental approaches are not practical or, in most cases, useful to map the current density distribution along the steel reinforcement because of the black-box nature of reinforced concrete and the geometry discrepancy between the measuring capability of conventionally used electrochemical equipment and localized corrosion.
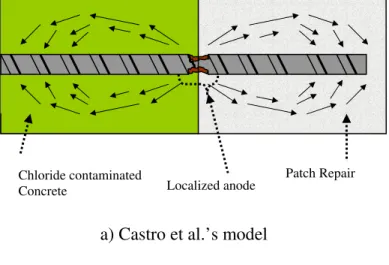
Besides the distribution of the anodic current density, the precise location of the anodic site — whether it is in the substrate or at the interface — is still not clear. There are two contradictory experimental findings. Castro et al. [5] closely monitored the current flow between segmented steel bars to identify the interfacial corrosion and the corrosion in the substrate. They found that the interface was mostly anodic, which was directly controlled by the corrosion activity in the patch (macrocell cathode). The corrosion in the substrate was in turn determined by the corrosion activity at the interface. This is illustrated by the corrosion current distribution in Fig. 1(a), in which the current flow (only the current flow in the concrete is illustrated; the direction of electron flow in the steel would be in the opposite direction) is from the interface to both the patch and the substrate. Their experiments showed that the anodic site extended in both directions (patch and substrate) for 4 cm from the interface. Barkey [15] reported however, that the interface remained passive and suggested that this passive region might extend out of the repaired region into the substrate. An examination of the corrosion products revealed that the inner boundary of the anode in the substrate was 1 cm or 2 cm away from the interface. As demonstrated by his model in Fig. 1(b), the macrocell current bypassed the interface, driving the chlorides out of this region with a possible speed of 2 to 3 mm/month under a macrocell potential of 300 mV. As a result, the interface was protected from corrosion and remained passive.
Further study to clarify the corrosion location, either at the interface or in the substrate, is important to understand the mechanism and to take preventive measures. Castro et al.’s model implied that the interface between the patch and the substrate was the most critical 28
factor for the induced corrosion, and therefore a strong bond should be beneficial. In contrast, Barkey’s model showed the steel at the interface was in a passive state bypassed by the macrocell current. Again, the precise identification of the source of the problem by experimental approaches will be limited by the geometry of experimental set-ups and of the capabilities of the corrosion measurement equipment. Therefore numerical modeling is considered as a suitable and useful tool to study the kinetics of reinforcement corrosion after patch repairs in concrete structures and to specifically address the following questions raised by Zhang and Mailvaganam [14] on the ring-anode effect: 1) is the anodic site after a patch repair at the interface or in the substrate? and 2) what are the anodic corrosion characteristics of the steel after patch repair with regards to its geometry and current density?
2. NUMERICAL APPROACH
2.1. Initial active microcell corrosion in the substrate
After a patch repair, the steel in the substrate often undergoes more active corrosion than in the patch. This is mainly due to the fact that the substrate concrete, either by chloride contamination or carbonation, is usually more corrosive than the newly patched concrete. It is also suggested that the substrate can develop more active microcell corrosion after a patch repair, because the patch repair removes the damaged area, which was an anodic site for the adjacent substrate, and consequently, its cathodic protection on the steel in the substrate is lost [16]. In the current investigation, it is therefore assumed the steel in
substrate undergoes uniform microcell corrosion as an initial condition right after a patch repair, and the investigations will focus on the interactions of the passivated steel in the patch area and the steel in the substrate and their final respective corrosion equilibrium state, especially the corrosion of the steel in the substrate (See Fig. 2).
The initial microcell corrosion current density of the steel in the substrate, icor,mic (A/m2),
as illustrated in Fig. 2(a), can be easily calculated from exchange current density following the polarization and the mix potential theories [17] as follows:
1) Anodes polarize through activation polarization such that
0 a a a a oa Activation i log( ) i φ φ= +β 14243 (1)
whereφa(V) is the anodic corrosion potential, o
a
φ
(V) is the equilibrium potential of the anodic reaction, βa is the anodic Tafel slope (V/dec), and ioa (A/m2) is the exchangecurrent density of the anodic reaction.
2) Cathodes polarize through activation and concentration (due to the limiting effect of oxygen availability around the cathodic sites) polarization such that
0 c 2 303 L c c c oc c L c Activation Concentration i . RT i log( ) log( ) i z F i φ φ= +β + i − 14243 144424443 (2)
whereφc(V) is the cathodic corrosion potential, φ (V) is the equilibrium potential of the oc cathodic reaction, βc is the cathodic Tafel slope (V/dec), ioc (A/m
2
) is the exchange current density of the cathodic reaction, iL (A/m2) is the limiting current density, R
(≈8.314 J/(mole.K)) is the universal gas constant, F (≈96500 C/mole) is the Faraday’s constant, T (oK) is temperature, and zc is number of electrons that are involved in the
cathodic reaction. The limiting current density, iL (A/m2), is a measure of oxygen
availability around the cathodic sites on the steel surface, and in the current study, is defined by Eq. 3 as a function of concrete cover thickness, d (m), oxygen diffusion coefficient, (m2/s), and amount of dissolved oxygen on the surface of concrete,
(mole/m3) [18]: 2 O D COs 2 d COs O2 2 D F z iL = c (3)
3) When the equilibrium is reached, at any point on the steel surface, the rates of anodic and cathodic reactions, ia (A/m2) and ic (A/m2) respectively, will be equal to each other
and to the microcell corrosion current density, icor,mic. Since the distance between the
anodic and cathodic sites on the steel surface are very small, the effect of concrete resistivity (i.e., IR drop) can be ignored [19], and consequently, the potentials of anode and cathode can be considered equal in microcell corrosion. Therefore, using Eqs. 1 and 2, the microcell corrosion current density, icor,mic, on the steel surface in the concrete
before the patch repair can be obtained by numerically solving the following nonlinear equation: , , 0 0 , 2.303 log( c
β cor mic) log(cor mic) log( L ) 0
c a a oc oa c L cor mic i i RT i i i z F i i φ φ β − − + − + = (4)
2.2. Corrosion of steel at the intersection of the substrate and the patch
The process of patch repair consists of 1) the removal of the damaged concrete, 2) the application of surface treatment on the steel, and 3) the replacement of the defective concrete with new concrete that is free from chlorides (see Fig. 2). After the application
of the patch repair, it is assumed that the reinforcing steel in the repaired zone is repassivated, while the steel in the unpatched zone (the substrate or the old concrete) remains active due to the presence of chloride ions, or later becomes active when chloride concentration exceeds the threshold value. Reinforcing steel sections in both zones continue to experience microcell activity, albeit at different rates: the steel sections in the repaired chloride-free zone experience very slow microcell corrosion rates in the vicinity of passive current density of steel in concrete, while the steel sections in the substrate undergoes higher microcell activity in the vicinity of microcell corrosion rates that were experienced before the repair that can be calculated by Eq. 4. In addition, the electrochemical potential imbalance between the steel in the repaired zone and the steel in the substrate results in macrocell activity. Therefore, after the patch repair, the corrosion mechanism of steel reinforcement in concrete changes from uniform microcell corrosion to a combination of microcell and macrocell corrosion, hence the corrosion current density distribution varies along the rebars and deviates from the microcell corrosion rate calculated from Eq. 4 [20], as illustrated in Fig. 2(b).
In the repaired zone, the polarization curve of the anodic microcell reaction no longer follows the activation polarization equation given in Eq. 1 due to the formation of the protective film but confers an s-shape behaviour as shown in Fig. 3 [21]. This polarization behaviour can be estimated through the following modified anodic polarization equation [21]: 0 a ,patch a ,patch a a a ,patch f oa i log( ) i R i φ = +φ β + (5) 32
where φa , patch (V) is the anodic corrosion potential of steel in the repaired region, Rf
(Ω.m2) is the electrical resistance of the protective film, and ia,patch (A/m2) is the anodic
current density of steel in the repaired region. The polarization curve of the cathodic microcell activity in the repaired area still follows the same equation as the cathodic polarization equation (Eq. 2); therefore the following equation can be written:
0 c ,patch 2 303 L c ,patch c c oc c L c ,patch i . RT i log( ) log( ) i z F i i φ =φ +β + − (6)
where φc , patch (V) and ic,patch (A/m2)are the cathodic corrosion potential and the cathodic
microcell corrosion density of steel in the repaired zone, respectively.
On the other hand, in the substrate in which the concrete is still contaminated, the anodic and cathodic polarization reactions follow the same equations that have been introduced earlier (Eqs. 1 and 2, respectively) and can be written respectively as:
0 a ,substrate a ,substrate a a oa i log( ) i φ = +φ β (7) 0 c ,substrate 2 303 L c ,substrate c c oc c L c ,substrate i . RT i log( ) log( ) i z F i i φ = +φ β + − (8)
where φa ,substrate (V) and ia,substrate (A/m2)are the anodic corrosion potential and the anodic
microcell corrosion density of steel in the substrate, respectively; and φc ,substrate (V) and
ic,substrate (A/m2)are the cathodic corrosion potential and the cathodic microcell corrosion
density of steel in the substrate.
If the two-dimensional problem that is illustrated in Fig. 1 is simplified as a hypothetical one-dimensional setup (as in the case of two parallel rebars, separated by concrete, and 33
experiencing macrocell corrosion – similar to the ASTM G109 [23] test setup), the theory behind the macrocell activity in patch repairs can be visualized better. For the simplified one-dimensional macrocell problem, since the corrosion potentials of the two zones (i.e., the repaired zone and the substrate) are not the same (see Fig. 4), macrocell corrosion will proceed such that:
patch substrate IRcon
φ −φ = (9)
where φpatch (V) andφsubstrate (V) are the potentials of the repaired zone and the substrate,
respectively, Rcon (Ω) is the concrete resistance, and I (A) is total macrocell corrosion
current. Due to this macrocell corrosion current, the microcell activities in the repaired zone and substrate are also affected. Macrocell current shifts the anodic current density along the steel in the substrate towards larger values while the cathodic current density of the same segment becomes smaller, as illustrated in Fig. 4(b). However, since the electrical neutrality must be preserved, the difference between anodic and cathodic current densities in both zones (i.e., the substrate and the repaired zone) should be identical [24] such that:
, , , ,
c patch a patch a substrate c substrate
i −i =i −i (10)
2.3. Two-dimensional numerical solution
Although the one-dimensional simplification described by Eq. 9 is useful for theoretically explaining the concept of macrocell corrosion in a patch repair, the actual problem given in Fig. 1 needs to be solved in the two-dimensional domain; therefore a closed-form solution is not possible. In this study, a nonlinear finite element solution technique is used
to solve the governing differential equation for the electrical potential distribution in the domain of analysis, as illustrated in Fig. 5, and to calculate the corrosion current densities on the steel surface. The governing equation for electric potential distribution is given by: 2 1 0 φ ρ∇ = (11)
where φ (V) is the electrical potential and ρ (Ω.m) is the concrete resistivity. Once the
nodal potentials (hence the potential gradients are determined), the current density distribution on the steel surface in both the patch and substrate areas is calculated using Ohm’s law such that
1 patch patch i n φ ρ ∂ = − ∂ (12) and 1 substrate substarte i n φ ρ ∂ = − ∂ (13)
where ρpatch(Ω.m) and ρsubstrate(Ω.m) are the concrete resistivities of the patch and the
substrate area, respectively, and n is the direction normal to the equipotential lines.
At each node of the boundary on the steel surface, two conditions should be satisfied. In the patch zone, the anodic and the cathodic potentials (given by Eqs. 5 and 6 respectively) need to be equal such that
, ,
patch a patch c patch
φ =φ =φ (14)
and the current density, ipatch (A/m2), is equal to the difference of anodic and cathodic
current densities as per
, ,
patch c patch a patch
i =i −i (15)
Solving these two equations simultaneously, φpatch is obtained for each node of the
boundary in the repaired area. These values are used as Dirichlet boundary conditions at each node on the surface of steel in the patch area. In the substrate, the anodic and the cathodic potentials (given by Eqs. 7 and 8 respectively) are also identical such that
, ,
substrate a substrate c substrate
φ =φ =φ (16)
and the current density, isubstrate (A/m2), is calculated as:
, ,
substrate a substrate c substrate
i =i −i (17)
The boundary values at each node on steel in the substrate, φsubstrate, is calculated by
simultaneously solving Eqs. 16 and 17 and is used as Dirichlet boundary condition for steel in the substrate.
During the solution of Eq. 11, the electric neutrality condition, which is defined in Eq. 10, is persistently enforced. Due to the nonlinear nature of the boundary conditions, the solution of Eq. 11 requires a non-linear solution algorithm with an appropriate iteration method. Here, the modified direct iteration method that is based on a relaxation algorithm is implemented to seek convergence. Nevertheless, attaining the convergence by this method can also be difficult at times, especially when the oxygen concentration around the steel in the substrate becomes low, resulting in significant concentration polarization of the cathodic reaction. The details of the nonlinear solution procedure, the finite element algorithm and the numerical difficulties associated with it can be obtained from [25-27]; therefore they will not be provided here.
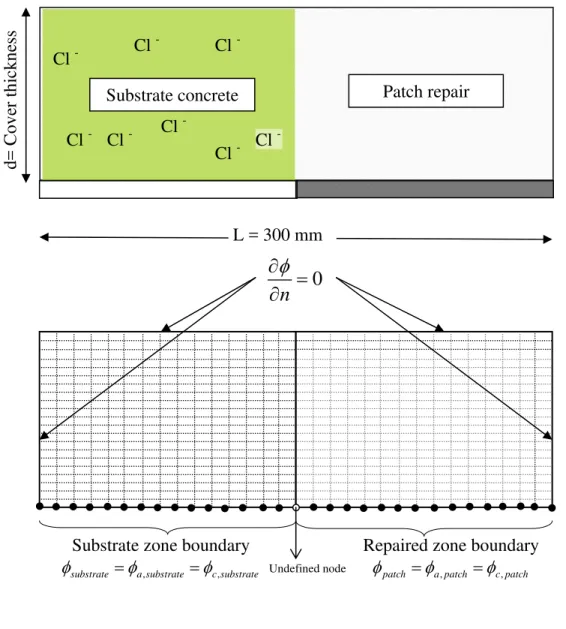
Using the described approach, a numerical investigation was carried out to study the kinetics of reinforcement corrosion after patch repairs and to identify the governing parameters that affect the process. As illustrated in Fig. 5, the analysis is carried out in a domain that is 300 mm long; the cover thickness of concrete was a variable of the investigation. Preliminary simulations have demonstrated that, mostly due to the high resisitivity of concrete, macrocell activity is limited to a narrow area that spans both sides of the boundary between the substrate and the repaired zone; hence 300 mm length of the domain was found to be sufficient to simulate the patch repair problem accurately. The domain is discretized by 5x5 mm square finite elements, again, after a preliminary sensitivity analysis that aimed at finding the optimum element size that establishes a balance between accuracy and numerical efficiency. The values of the constant parameters of the simulations (e.g. exchange current densities, Tafel slopes, etc.) are presented in Table 1. These constants were selected to represent typically measured properties during corrosion of steel in concrete. Further information on the effect of these constants on the results of the simulations can be found in another paper [28].
3. RESULTS AND DISCUSSION
3.1. Ring-anode phenomena
All numerical simulations carried out in this study have clearly demonstrated the formation of a ring-anode zone in the substrate. As illustrated in Fig. 6, which is a plot of the current density along the length of the reinforcing steel for a typical simulation, the formation of the ring anode is mainly due to the increased corrosion density along the 2-5 37
cm portion of the steel reinforcement from the intersection between the repaired zone and the substrate.The size of the ring anode observed in the simulations is also in agreement with the experimental and in situ observations. The anodic current density (steel dissolution rate) in this narrow ring has a peak near the intersection and asymptotically approaches to the initial microcell corrosion density before their interactions. The current density in the repaired zone experiences a sharp decrease at the intersection to negligible values (which can be considered as passive state) towards the centre of the patch. The inference from these results is that although the patch repair system decreases the microcell corrosion rate of the repaired area to the level of passive current density, the macrocell corrosion rate created due to the potential gradient between the two zones increases the anodic corrosion rate, particularly for the region close to the border of repair (see Fig. 2).
The simulations show that the ring anode zone starts exactly at the interface between the substrate and the repaired zone, and this result may initially seem different from Barkley’s observation that the passive region might extend out of the repaired region into the substrate such that the inner boundary of the anode in the substrate is 1 cm or 2 cm away from the interface. As Barkley also pointed out, the shift of the ring anode into the substrate can be attributed to the movement of the chloride ions from the interface into the substrate hence creating a narrow 1-2 cm zone from the interface in which the chloride threshold value is not exceeded. As a result, the interface was protected from corrosion and remained passive. Since the numerical approach used in this study did not consider the movement of chloride in the concrete, the shift of the ring anode is not obvious in the results; however, as also stated by Barley, the macrocell potential gradient 38
at the interface between the substrate and the patch can drive the chloride at rates as high as 2 to 3 mm/month and shift the passive zone by 1-2 cm within a year. However, it should be noted that, as demonstrated in the current study, the movement of chlorides is not a requirement for the formation of the ring-anode zone. The ring-anode zone form mainly due to the combined macrocell and microcell activity after the patch repair. In summary, the numerical simulations, which incorporate the kinetics of combined microcell and macrocell corrosion in the ring-node zones after a patch repair, support Barkley’s observations.
3.2. Effect of patch size and concrete cover thickness
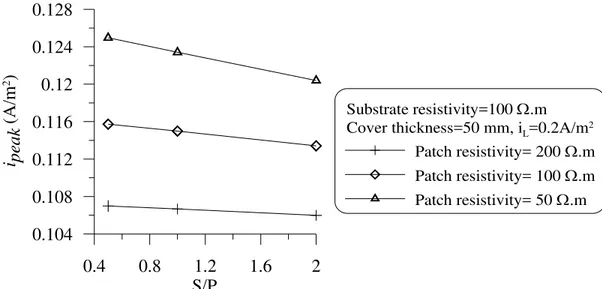
The effect of patch size on the kinetics of the corrosion along the steel reinforcement is investigated by numerically simulating three scenarios for the repair of a 100 Ω.m concrete with patches of the same (100 Ω.m), lower (50 Ω.m) and higher (200 Ω.m) resistivities, but with different sizes such that the substrate to patch ratio (S/P) were 0.5, 1.0 and 2.0. The results of this investigation are illustrated in Fig. 7. It can be observed from this figure that the effect of patch size (i.e., S/P ratio) does not have any significant effect on the distribution of the current density in the ring-anode zone. The peak current density at the interface and also the size of the ring anode were not affected by the S/P ratio or by the selection of the resistivity of the patch (see Fig.8). Therefore it can be stated that the ring-anode problem is a much localized problem that is governed by the kinetics of corrosion around the interface between the substrate and the repaired zone. The size of the patch is not a significant factor that positively or negatively affects the ring-anode characteristics.
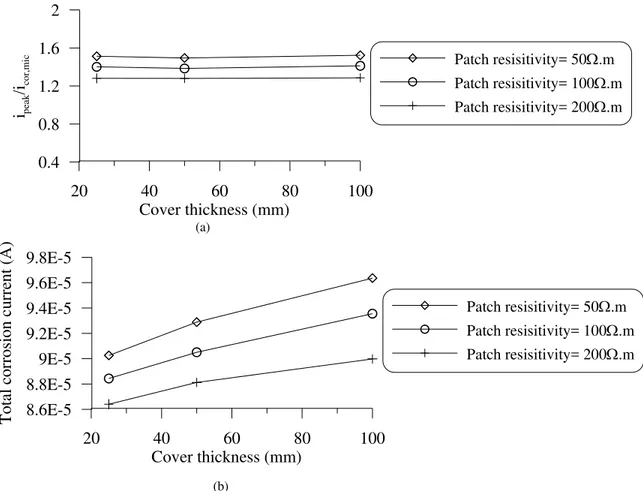
The effect of concrete cover thickness on the corrosion current density due to the patch repair was studied numerically using the developed model. Three concrete resistivities (100, 200 and 500 Ω.m) were simulated with S/P of 0.5. In these cases, the limiting current density was set to 0.2 A/m2 in order to have enough oxygen available around the surface of the reinforcement. The results of simulations are presented in Figs. 9 and 10. As illustrated in Figs. 9 and 10(a) the cover thickness does not influence the peak current density and the distribution of corrosion rate in the ring-anode zone. However, as the cover thickness becomes larger a slight rise of corrosion current density along the rebar in the substrate due to the macrocell corrosion can be observed. As illustrated in Fig. 10(b), the area under the corrosion current density curve of the ring-anode area (i.e. corrosion current, I) increases by the increase of cover thickness, and this increase is larger when patch with higher resistivity than that of the substrate is used. In other words, when patch with higher resistivity than that of the substrate is used the dependency of the total corrosion current to the cover thickness is more pronounced. Therefore, in the following investigations, S/P value and concrete cover thickness are selected as 0.5 and 50 mm, respectively.
3.3. Effect of concrete resistivity
In order to investigate the effect of resistivity on the distribution of corrosion current density along the rebar in concrete after a patch repair, three corroding concrete structures with three different resistivities of concrete (ρsubstrate) (low resistivity: 100 Ω.m, medium
resistivity: 200 Ω.m, and high resistivity: 500 Ω.m) were simulated. The rebar cover 40
thickness of 50 mm and the S/P ratio of 0.5 were used for each case. The limiting current density (iL) is set to 0.2 A/m2 in order to eliminate the effect of concentration polarization
that may be more obvious in saturated concrete in which there would be limited oxygen availability. For each case, three different types of patch repairs with resistivities lower, equal, and higher than those of the substrate are examined. In Table 2, the values of the patch resistivities (ρpatch) for each case are presented. The results of the simulations are
presented in Fig. 11.
In general, as illustrated in Fig. 11, it is obvious that substrate with low resistivity experience the most significant ring-anode effect, regardless of the resistivity of the patch used in the repair. For example, for cases with patch resistivity of 200 Ω.m, the peak current density in the ring-anode zone decreases from 0.1070 A/m2 for a substrate with resistivity of 100 Ω.m to 0.0981 A/m2 for a substrate with resistivity of 500 Ω.m. In each
case, the lowest peak corrosion current density in the ring-anode zone was obtained when a patch with resistivity higher than that of the substrate was used. As illustrated in Fig. 12, the total corrosion current in the repaired member decreases as the patch resistivity increases. In other words, if concrete resistivity can be used as an indicator of the quality of concrete and the patch (assuming higher quality may be correlated to higher density and higher electrical resistivity), using a higher quality patch (i.e., with higher resistivity that of the substrate) corresponds to a better repair strategy. Therefore based on the results obtained in this numerical investigation, it can be stated that using a patch with higher resistivity (i.e. quality) with respect to the substrate concrete diminishes the ring-anode effect. However, if the quality of the substrate and the patch are significantly different from each other, it is also possible that there may be mechanical compatibility
problems at the interface between the patch and the substrate (e.g. bond failure between two surfaces), which may, in long term, cause cracking and increase the rate of deterioration of the patched zone. Therefore selecting a patch with similar resistivity with the substrate is recommended for patch repairs. However, it should also be pointed out that if the resistivity of the substrate is low, regardless of the patch quality, the ring-anode effect will be significant; therefore, for these cases, the best solution is the replacement of the entire chloride-contaminated substrate concrete with a high quality concrete with high resistance to chloride penetration.
3.4. Effect of oxygen availability
The amount of oxygen available on the surface of rebar affects the limiting current density through Eq.3 and affects the concentration polarization characteristics. Therefore the oxygen concentration is an important parameter that should be considered in the study of corrosion kinetics in patch repairs. For this purpose, a series of patch repair cases were simulated such that the limiting current density was the variable of the investigation. The results of this investigation are illustrated in Figs. 13 and 14.
In Fig. 13, the corrosion current density of reinforcing steel after a patch repair is plotted for the different limiting current densities, varying from 0.008 to 0.6 A/m2. In the figure, the corresponding microcell corrosion current densities before the repairs are also plotted. The common expectation is that the decrease of the limiting current density (i.e. lower oxygen concentrations around the reinforcement) would reduce both microcell and macrocell corrosion rates; hence the ring anode-effect would be diminished. It has been
observed in the simulations that even at very low values of limiting current density, the ring anode can still be observed; however its damaging effect is less severe when the limiting current density is low.
The ratio of peak corrosion current density, ipeak, to microcell corrosion density before the
repair, icor,mic,versus limiting current densities is plotted in Fig. 14 for the different patch
resistivities. As illustrated in this figure, the ratio increases by decreasing the limiting current density for all S/P ratios. For the limiting current density less than 0.08 A/m2, the rate of increase is significantly large; however, the change is not significant for the limiting current densities beyond this value. Additionally, it can be observed that the patch resistivity also plays an important role; the higher resistivity of patch results in the lower magnitude of peak corrosion current density. As concluded before, the S/P ratio does not remarkably affect the corrosion kinetics in the ring anode.
4. CONCLUSIONS
A comprehensive numerical investigation on the kinetics of corrosion after patch repairs of reinforced concrete structures have been carried out. The outcome of the study revealed the following conclusions:
• Numerical simulations carried out in this study have clearly demonstrated the formation of a ring-anode zone in the substrate, supporting the experimental observations made by Barkley (2004).
• The size of the ring anode observed in the simulations, which spans a 2-5 cm portion of the steel reinforcement from the intersection between the repaired zone and the substrate, is in agreement with the experimental and in situ observations. • The anodic current density in the ring-anode zone has a peak near the intersection
of the substrate and the repaired concrete and asymptotically approaches to the microcell corrosion density observed before the patch repair.
• Barkley’s observation of the shift of the ring anode into the substrate can be attributed to the movement of the chlorides from the interface into the substrate hence creating a narrow 1-2 cm zone from the interface in which the chloride threshold value is not exceeded. However, as demonstrated in the current study, the movement of chlorides is not a requirement for the formation of the ring-anode zone. The ring-ring-anode zone form mainly due to the combined macrocell and microcell activity after the patch repair.
• The ring-anode problem is a much localized problem that is governed by the kinetics of corrosion around the interface between the substrate and the repaired zone. The size of the patch or the thickness of the concrete cover is a not significant factor that positively or negatively affects the ring anode characteristics.
• The substrate with low resistivity experience the worst ring-anode effect, regardless of the resistivity of the patch used in the repair.
• If concrete resistivity can be used as an indicator of the quality of concrete and the patch (assuming higher quality may be correlated to higher density and higher resistivity), using a higher quality patch (i.e., with higher resistivity that of the substrate) corresponds to a better repair strategy. However, considering the fact 44
that the high quality patch may also cause mechanical compatibility problems at the interface between the patch and the substrate, choosing patches with similar properties as the substrate is recommended.
• If the resistivity of the substrate is low, regardless of the patch quality, the ring-anode effect will be significant; therefore, for these cases, the best solution is the replacement of the entire chloride-contaminated substrate concrete with a high quality concrete with high resistance to chloride penetration.
• At very low values of limiting current density (i.e. during periods of oxygen deprivation), the ring-anode can still be observed; however its damaging effect is less severe when the limiting current density is low.
5. REFERENCES
[1] RILEM Draft Recommendation, Repair strategies for concrete structures damaged by reinforcement corrosion, Mater Struct 27 (1994) 415-436.
[2] H.G. Wheat, K.S. Harding, Galvanic corrosion in repaired reinforced concrete slabs-an update. Materials Selection and Design 5 (1993) 58-62.
[3] P. Schieβl, W. Breit, Local repair measures at concrete structures damaged by reinforcement corrosion – aspect of durability, International Symposium on
Corrosion of Reinforcement in Concrete Construction, Royal Society of Chemistry, SP 183 (1996) 327-336.
[4] F. Pruckner, O.E. Gjφrv, Patch repair and macrocell activity in concrete structures, ACI Mater J 99 (2002) 143-148.
[5] P. Castro, E. Pazini, C. Andrade, C. Alonso. Macrocell activity in slightly chloride-contaminated concrete induced by reinforcement primers, Corrosion 59 (2003) 535-546.
[6] G. Li, Y.S. Yuan, Electrochemical incompatibility for patch-repaired corroded reinforced concrete, Journal of China University of Mining and Technology 32 (2003) 44-47.
[7] D.J. Cleland, K. M. Yeoh, A. E. Long, Corrosion of reinforcement in concrete repair, Construction and Building Materials 11 (1997) 233-238.
[8] V. Kasselouri, N. Kouloumbi,T.H. Thomopoulos, Performance of silica fume-calcium hydroxide mixture as a repair material, Cem Concr Compos 23 (2001) 103-110.
[9] N.K. Emberson, G.C. Mays, Significance of properties mismatch in the patch repair of structural concrete, Part 1: properties of repair systems, Magazine of Concrete Research 42 (1990) 147-160.
[10] M. Raupach, P. Schieβl , Macrocell sensor systems for monitoring of the
corrosion risk of the reinforcement in concrete structures, NDT E Int, 34 (6)(2001) 435-442.
[11] P. Gu, J. J. Beaudoin, P. J. Tumidajski, N. P. Mailvaganam, Electrochemical incompatibility of patches in reinforced concrete, Concr Int 19 (1997) 68-72. [12] P.H. Emmons, A.M. Vaysburd, Corrosion protection in concrete repair: myth and
reality, Concr Int 19 (1997) 47-56.
[13] N. P. Mailvaganam, Concrete repair and rehabilitation: Issues and trends, The Indian Concrete Journal 75(2001) 759-764.
[14] J. Zhang, N. Mailvaganam, Corrosion characteristics and key electrochemical factors in patch repair, Can J Civ Eng 33 (6) (2006) 785-793.
[15] D.P. Barkey, Corrosion of steel reinforcement in concrete adjacent to surface repairs, ACI Mater J 101 (2004) 266-272.
[16] M. Raupach, Chloride-induced macrocell corrosion of steel in concrete - theoretical background and practical consequences, Constr Build Mater 10(5) (1996), 329-338.
[17] D. A. Jones, Principles and Prevention of Corrosion, 2nd ed., Prentice Hall, 1995. [18] H. Bohni, Corrosion in Reinforced Concrete Structures, CRC Press, New York,
2005.
[19] J. Gulikers, Theoretical considerations on the supposed linear relationship between concrete resistivity and corrosion rate of steel reinforcement, Mater Corros 56 (2005) 393-403.
[20] B. Elsener, Macrocell corrosion of steel in concrete–implications for corrosion monitoring, Cem Concr Compos 24(1) (2002) 65-72.
[21] R. W. Revie, H. H. Uhlig, Corrosion and Corrosion Control, 4th ed., John Wiley & Sons, 2008.
[22] P. Ghods, O.B. Isgor, Technical Report, Carleton University, Ottawa, Canada, 2008.
[23] ASTM G109 – 2007, Standard Test Method for Determining Effects of Chemical Admixtures on Corrosion of Embedded Steel Reinforcement in Concrete Exposed to Chloride Environments, Annual Book of ASTM Standards (West Conshohocken, PA: ASTM, 2007).
[24] S.Qian, J. Zhang, D. Qu, Theoretical and experimental study of microcell and macrocell corrosion in patch repairs of concrete structures, Cem Concr Compos 28(8) (2006) 685-695.
[25] P. Ghods, O. B. Isgor, M. Pour-Ghaz, A practical method for calculating the corrosion rate of uniformly depassivated reinforcing bars in concrete, Mater Corros 58 (2007) 265-272.
[26] J. Ge, On the Numerical Solution of Laplace’s Equation with Nonlinear Boundary Condition for Corrosion of Steel in Concrete, M.A.Sc. Thesis, Carleton University, Ottawa, Canada, 2006.
[27] M. Pour-Ghaz , O. B. Isgor , P. Ghods, Virtual experiments to investigate steel corrosion in concrete, ASCE International Workshop on Computing in Civil Engineering (Lucio Soibelman, Burcu Akinci – Editors), Pittsburgh PA, (2007) 542-549.
[28] J. Ge, O.B. Isgor, Effects of Tafel slope, exchange current density and electrode potential on the corrosion of steel in concrete, Mater Corros 58(8) (2007) 573-582.
List of Tables:
Table 1: Input parameters which have been used for running the model Table 2: Three different cases for investigating the effect of patch resistivity
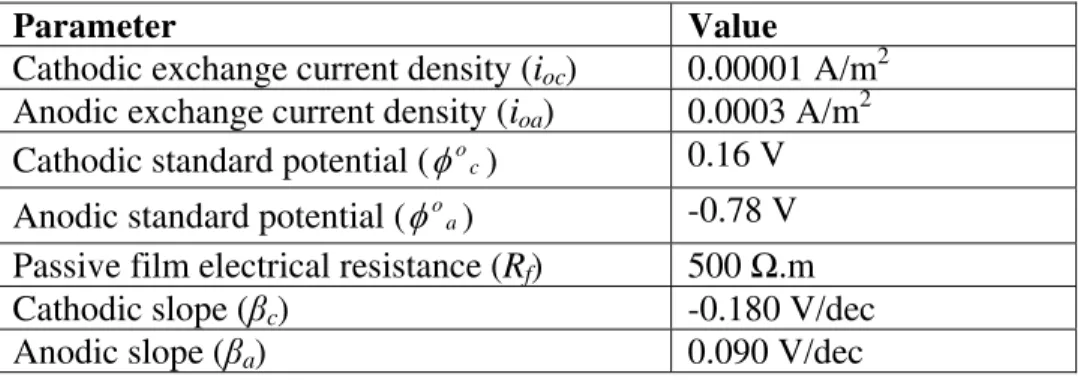
Table 1: Input parameters which have been used for running the model
Parameter Value Cathodic exchange current density (ioc) 0.00001 A/m2
Anodic exchange current density (ioa) 0.0003 A/m2
Cathodic standard potential (φoc) 0.16 V Anodic standard potential (φoa) -0.78 V Passive film electrical resistance (Rf) 500 Ω.m
Cathodic slope (βc) -0.180 V/dec
Anodic slope (βa) 0.090 V/dec
Table 2: Three different cases for investigating the effect of patch resistivity Cover thickness (mm) Limiting current density (A/m2) Old concrete resistivity (Ω.m) Patch resistivity (Ω.m) Case 1 50 0.2 100 50, 100, 200 Case 2 50 0.2 200 100, 200, 500 Case 3 50 0.2 500 200, 500, 1000 List of Figures:
Figure 1: Macrocell current distribution in patch repair, a) Castro et al.’s model; b) Barkey’s model
Figure 2: Schematic illustration of the patch repair effect on the mechanism of rebar corrosion
Figure 3: Schematic illustration of anodic polarization of rebar in the repaired zone Figure 4: Anodic and cathodic polarization curves a) substrate (old concrete), b) Patch repair
Figure 5: Schematic illustration of the domain, active and passive area and corresponding boundary conditions
Figure 6: Anodic and cathodic current density of rebar after the patch repair in the substrate and in the patch repair
Figure 7: Effect of the patch size on the corrosion current density of rebar: a) S/P=0.5, b) S/P=1, c) S/P=2
52 Figure 8: Effect of patch size on the maximum corrosion rate at the ring anode, ipeak.
Figure 9: Effect of cover thickness on the corrosion rate of rebar after the patch repair (iL=0.2 A/m2)
Figure 10: Effect of cover thickness on (a) ipeak to icor,mic ratio (b) total corrosion current
(I) (Substrate resistivity=100 Ω.m, S/P =0.5, iL=0.2 A/m2)
Figure 11: Effect of patch resistivity on the corrosion of rebar in concrete for three different hypothetical cases (Cover thickness=50 mm, S/P=0.5, iL=0.2 A/m2)
Figure 12: Effect of patch resistivity on the total macrocell corrosion current
Figure 13: Effect of iL on the corrosion rate of rebar due to the patch repair (Substrate
resistivity =100Ω.m, Patch resistivity=200Ω.m, Cover thickness= 50mm, S/P=0.5) Figure 14: Effect of iL on the ratio of ipeak to icor,mic for the different patch resistivities: a)
a) Castro et al.’s model
b) Barkey’s model
Figure 1: Macrocell current distribution in patch repair, a) Castro et al.’s model; b) Barkey’s model Localized anode Chloride contaminated Concrete Patch Repair Localized anode Patch Repair Chloride contaminated Concrete 53
Figure 2: Schematic illustration of the patch repair effect on the mechanism of rebar corrosion
After the repair
Combined microcell and macrocell corrosion
Substrate (Old concrete) Patch repair 0 0.03 0.06 0.09 0.12 Cu rr ent d en sity of stee l (A /m 2)
Before the repair
Microcell corrosion icor,mic
Substrate(Old concrete)
(a) (b)
Steel rebar
Figure 3: Schematic illustration of anodic polarization of rebar in the repaired zone i(A/m2) ioa φ(V) φaο (ia,repaired .Rf ) Eq.5 Eq.1 , log( a repaired) a oa i i β 55
Corrosion Rate, i Corrosion Rate, i
Potential
,
φ
ic,substrate imic ia,substrate
φpatch-φsubstrate=IRcon φsubstrate φcor mic Potential , φ φpatch IRcon ia,patch ic,patch
(a) Substrate (Old concrete) (b) Patch repair
Figure 4: Anodic and cathodic polarization curves a) substrate (old concrete), b) Patch repair
Repaired zone boundary
, ,
patch a patch c patch
φ =φ =φ
Substrate zone boundary
, ,
substrate a substrate c substrate
φ =φ =φ
0
n
φ
∂
=
∂
Undefined nodeSubstrate concrete Patch repair
Cl - Cl - Cl -Cl -Cl -Cl - Cl -Cl -d= Cover thickness L = 300 mm
Figure 5: Schematic illustration of the domain, active and passive area and corresponding boundary conditions
0 0.2 0.4 0.6 0.8 1
Length
0 0.04 0.08 0.12 -0.02 0.02 0.06 0.1Cu
rr
en
t den
si
ty (
A
/m
2)
A: Anodic current density B: Cathodic current density C: Corrosion before repair D=A-B: Macrocell corrosion
Patch repair Substrate A B C D
Figure 6: Anodic and cathodic current density of rebar after the patch repair in the substrate and in the patch repair
Figure 7: Effect of the patch size on the corrosion current density of rebar: a) S/P=0.5, b) S/P=1, c) S/P=2 0 0.03 0.06 0.09 0.12 Cu rr en t d ensi ty (A /m 2 ) 0 0.2 0.4 0.6 0.8 1 (Length) 0 0.03 0.06 0.09 0.12 Cu rr en t d en si ty (A /m 2 )
Substrate Patch repair
0 20 Node number40 60 0 0.03 0.06 0.09 0.12 Cu rr en t d ensi ty (A /m 2) Substrate resistivity=100 Ω.m
Cover thickness=50 mm, iL=0.2A/m2
Patch resistivity=50 Ωm Patch resistivity=100 Ωm Patch resistivity=200 Ωm (c) S/P=2 (b) S/P=1 (a) S/P=0.5 59
Figure 8: Effect of patch size on the maximum corrosion rate at the ring anode, ipeak. 0.4 0.8 1.2 1.6 2 S/P 0.104 0.108 0.112 0.116 0.12 0.124 0.128 i peak (A /m 2) Substrate resistivity=100 Ω.m Cover thickness=50 mm, iL=0.2A/m2
Patch resistivity= 200 Ω.m Patch resistivity= 100 Ω.m Patch resistivity= 50 Ω.m
0 0.04 0.08 C ur re n t d en si ty (A /m 2) 0 0.04 0.08 C ur rent de ns ity( A /m 2 ) 0 0.2 0.4 0.6 0.8 1 (Length) 0 0.04 0.08 0.12 C ur re nt de ns ity( A /m 2) Substrate resistivity= 200Ω.m, S/P=0.5 Cover thickness=100 mm Cover thickness=50 mm Cover thickness=25 mm Corrosion before repair (a) Patch resistivity=500 Ω.m
(b) Patch resistivity=200 Ω.m
(c) Patch resistivity=100 Ω.m
Substrate Patch repair
Figure 9: Effect of cover thickness on the corrosion rate of rebar after the patch repair (iL=0.2 A/m2)
Figure 10: Effect of cover thickness on (a) ipeak to icor,mic ratio (b) total corrosion current
(I) (Substrate resistivity=100 Ω.m, S/P =0.5, iL=0.2 A/m2)
20 40 60 80 100 Cover thickness (mm) 0.4 0.8 1.2 1.6 2 ipeak /ico r, mi c Patch resisitivity= 50Ω.m Patch resisitivity= 100Ω.m Patch resisitivity= 200Ω.m (a) 20 40 60 80 100 Cover thickness (mm) 8.6E-5 8.8E-5 9E-5 9.2E-5 9.4E-5 9.6E-5 9.8E-5 Tota l co rr os io n cu rr ent (A ) Patch resisitivity= 50Ω.m Patch resisitivity= 100Ω.m Patch resisitivity= 200Ω.m (b) 62
Substrate 0 20 40 60 Node number 0 0.03 0.06 0.09 0.12 C u rr en t dens it y ( A /m 2) Substrate resistivity=100 Ω.m Patch resistivity=50 Ωm Patch resistivity=100 Ωm Patch resistivity=200 Ωm (a) Case 1 (b) Case 2 0 0.03 0.06 0.09 0.12 C ur rent dens it y ( A/ m 2 ) Substrate resistivity=500 Ω.m Patch resistivity=200 Ωm Patch resistivity=500 Ωm Patch resistivity=1000 Ωm (c) Case 3 0 0.2 0.4 0.6 0.8 1 Length 0 0.03 0.06 0.09 0.12 C u rr ent den si ty ( A /m 2 ) Substrate resistivity=200 Ω.m Patch resistivity=100 Ωm Patch resistivity=200 Ωm Patch resistivity=500 Ωm Peak=0.0981 A/m2 Peak=0.1040 A/m2 Peak=0.1070 A/m2 Patch repair
Figure 11: Effect of patch resistivity on the corrosion of rebar in concrete for three different hypothetical cases (Cover thickness=50 mm, S/P=0.5, iL=0.2 A/m2)
Figure 12: Effect of patch resistivity on the total macrocell corrosion current 0 200 400 600 800 1000 Patch resistivity (Ω.m) 0.0x100 4.0x10⁻⁶ 8.0x10⁻⁶ 1.2x10⁻⁵ 1.6x10⁻⁵ 2.0x10⁻⁵ T o ta l mac roce ll cu rr en t, Ima c (A ) Substrate resisitivity= 500 Ω.m Substrate resisitivity= 200 Ω.m Substrate resisitivity= 100 Ω.m 64
Figure 13: Effect of iL on the corrosion rate of rebar due to the patch repair (Substrate
resistivity =100Ω.m, Patch resistivity=200Ω.m, Cover thickness= 50mm, S/P=0.5)
0 0.2 0.4 0.6 0.8 1 (Length) 0 0.04 0.08 0.12 Cu rr ent densit y (A/m 2 )
Combined microcell and macrocell corrosion after repair
iL = 0.008 A/m2
iL = 0.08 A/m2
iL = 0.2 A/m2
iL = 0.6 A/m2
Microcell corrosion before repair
iL = 0.008 A/m2
iL = 0.08 A/m2
iL = 0.2 A/m2
iL = 0.6 A/m2
0 0.2 0.4 0.6 iL(A/m2) 2 4 6 1 3 5 ipeak / icor, m ic 0 0.2 0.4 0.6 iL(A/m2) 2 4 6 1 3 5 ipea k / icor, m ic 0 0.2 0.4 0.6 iL(A/m2) 1 2 3 4 5 6 ipea k / icor, m ic Substrate resistivity=100Ω.m Cover thickness= 50 mm Patch Resistivity=50Ω.m Patch Resistivity=100Ω.m Patch Resistivity=200Ω.m (c) S/P= 2.0 (b) S/P= 1.0 (a) S/P= 0.5
Figure 14: Effect of iL on the ratio of ipeak to icor,mic for the different patch resistivities: a)
S/P=0.5, b) S/P=1, c) S/P=2