HAL Id: hal-00111091
https://hal.archives-ouvertes.fr/hal-00111091
Submitted on 10 Nov 2006
HAL is a multi-disciplinary open access
archive for the deposit and dissemination of
sci-entific research documents, whether they are
pub-lished or not. The documents may come from
teaching and research institutions in France or
abroad, or from public or private research centers.
L’archive ouverte pluridisciplinaire HAL, est
destinée au dépôt et à la diffusion de documents
scientifiques de niveau recherche, publiés ou non,
émanant des établissements d’enseignement et de
recherche français ou étrangers, des laboratoires
publics ou privés.
The continuous wagon wheel illusion is associated with
changes in electroencephalogram power at
approximately 13 Hz.
Rufin Vanrullen, Leila Reddy, Christof Koch
To cite this version:
Rufin Vanrullen, Leila Reddy, Christof Koch. The continuous wagon wheel illusion is associated with
changes in electroencephalogram power at approximately 13 Hz.. Journal of Neuroscience, Society for
Neuroscience, 2006, 26 (2), pp.502-7. �10.1523/JNEUROSCI.4654-05.2006�. �hal-00111091�
Behavioral/Systems/Cognitive
The Continuous Wagon Wheel Illusion Is Associated with
Changes in Electroencephalogram Power at
⬃13 Hz
Rufin VanRullen,
1Leila Reddy,
2and Christof Koch
21Centre National de la Recherche Scientifique, Centre de Recherche Cerveau et Cognition, Unite´ Mixte de Recherche 5549, Faculte´ de Me´decine Rangueil,
31062 Toulouse Cedex 9, France, and2Division of Biology, California Institute of Technology, Pasadena, California 91125
Continuously moving objects sometimes appear to spontaneously reverse their motion direction. The mechanisms underlying this
bistable phenomenon (the “continuous wagon wheel illusion”) are heavily debated, but one interpretation suggests that motion
infor-mation is perceived in discrete episodes at a rate between 10 and 15 Hz. Here, we asked observers to report the perceived direction of a
continuously rotating wheel while 32-channel electroencephalogram (EEG) was recorded. We then separated periods of perceived true
from illusory (reversed) motion and compared the EEG power spectrum under these two perceptually distinct yet physically identical
conditions. The only reliable difference was observed
⬃13 Hz over centroparietal electrodes, independent of the temporal frequency of
the wheel. Thus, it is likely to reflect internal processes rather than purely stimulus-driven activity. EEG power (13 Hz) decreased before
the onset of illusory motion and increased before transitions back to real motion. Using this relationship, it was possible to predict above
chance, on a trial-by-trial basis, the direction of the upcoming perceptual transition. These data are compatible with the idea that motion
perception occurs in snapshots
⬍100 ms in duration.
Key words: consciousness; bistable percepts; motion; human; illusion; EEG; electroencephalogram
Introduction
The precise temporal organization of our perceptual experience
is a major unanswered question (Crick and Koch, 2003;
Eagle-man and Churchland, 2005): do we perceive the world as a
con-tinuous flow of information or in discrete episodes or
“snap-shots” as in a regular movie (Stroud, 1956; Shallice, 1964; Harter,
1967; VanRullen and Koch, 2003)? The wagon wheel illusion may
provide some insights into this debate (Andrews and Purves,
2005). This phenomenon occurs, for example, when the
sam-pling rate of a video camera is too slow compared with the
tem-poral frequency of a moving object (such as a rotating wagon
wheel): on film, the object will appear to move in the opposite
direction. Under some conditions, the same illusion can also be
experienced by humans observing continuously moving objects
in the real world (Schouten, 1967). One explanation of this
curi-ous phenomenon could be that the visual system processes
mo-tion informamo-tion just as a video camera in a rapid sequence of
discrete snapshots (Purves et al., 1996). Recent experiments
esti-mated the rate of these postulated snapshots between 10 and 15
Hz (Simpson et al., 2005; VanRullen et al., 2005). Other
interpre-tations that assume continuous processing, however, have been
proposed for this illusion (Schouten, 1967; Pakarian and Yasamy,
2003; Kline et al., 2004), which remains a debated topic (Andrews
and Purves, 2005; Andrews et al., 2005; Holcombe et al., 2005).
Here, we investigate the electrophysiological correlates of this
illusion in the human brain: if illusory motion perception is
trig-gered by discrete processing (
⬃10–15 Hz), then the power
spec-trum of the electroencephalogram (EEG) during the illusion may
reflect the temporal frequency of this discrete subsampling.
In-deed, we found that only one EEG spectral component (⬃13 Hz)
was affected by the continuous wagon wheel illusion.
Materials and Methods
Stimulus. The stimuli were rotating “wheels” consisting of 16 cycles of a
sinusoidally modulated luminance pattern (i.e., 16 “spokes”) at 100% contrast. The wheel occupied 12.5° of visual angle, and a central gray disk of 0.6° provided for a fixation point. These wheels were displayed on a computer monitor with a refresh rate of 160 Hz, fast enough to avoid contamination by temporal framing artifacts, as determined from our previous investigations (VanRullen et al., 2005). For all intent and pur-poses, this series of images on a monitor approximated “continuous” motion. We used wheels rotating at a temporal frequency (or spoke alternation rate) of 10 and 7.5 Hz. Previous research (Simpson et al., 2005; VanRullen et al., 2005) demonstrated that the continuous wagon wheel illusion can be observed in both cases and is optimal for the former temporal frequency (10 Hz).
Subjects. Twelve observers (five females; 23–30 years of age)
partici-pated in this study. Two of them were authors of this study. The others were graduate and undergraduate students who were naive to the pur-pose of the experiment. All subjects signed informed consent and had normal or corrected-to-normal vision. Three of the subjects were left-handed; all subjects used the right hand for providing manual reports. Those who had never experienced the illusion were first accustomed to it for a few minutes (⬍10) before starting the experiment.
Experimental procedures. A constantly rotating wheel was presented for
Received Aug. 23, 2005; revised Oct. 31, 2005; accepted Nov. 17, 2005.
This work was supported by the Centre National de la Recherche Scientifique and the National Science Founda-tion–Engineering Research Center. We thank the two anonymous referees for constructive comments on this manuscript.
Correspondence should be addressed to Rufin VanRullen, Centre de Recherche Cerveau et Cognition, Centre National de la Recherche Scientifique, Faculte de Medecine Rangueil, 31062 Toulouse Cedex 9, France. E-mail: rufin@klab.caltech.edu.
DOI:10.1523/JNEUROSCI.4654-05.2006
2 min, during which observers had to report the perceived direction of rotation by continuously pressing the corresponding arrow on a key-board (the left arrow with the right index finger for counterclockwise motion, the right arrow with the right middle finger for clockwise mo-tion). Subjects were asked to perform 20 such 2 min trials with a wheel rotating at 10 Hz and 10 such trials with a wheel rotating at 7.5 Hz. These two types of trials were interleaved within the same experimental ses-sions. Subjects were free to rest between trials and to decide when to start the next trial. For any given subject, the actual rotation direction of the wheels was kept constant throughout the experiment, and this direction was counterbalanced across subjects. Some subjects reported mild dis-comfort induced by the constant stimulation, and the experiment was aborted for these subjects; but a minimum of 12 min of data were col-lected for each subject in each condition.
EEG recordings. A 32-channel EEG (Neuroscan, El Paso, TX) was
re-corded continuously (sampling rate, 1000 Hz) for the length of each trial. The EEG recording was synchronized with the display computer by means of pulses sent at the beginning and end of each trial and at the onset of each stimulus cycle during the trial (i.e., at 10 or 7.5 Hz, depend-ing on the stimulus condition). The electrode layout was modified from the 10 –20 system with an additional row of occipital electrodes and a linked-ears reference. A hardware notch filter was applied at 50 Hz (Eu-ropean electrical standards) to discard ambient electrical noise.
Power spectrum analysis. Based on the recorded subjects’ responses, the
EEG data for each 2 min trial was divided into a number of variable-length periods, during which actual motion was experienced, and a com-parable number (plus or minus one) of periods during which illusory motion was perceived. This was done after shifting the EEG time frame by 250 ms with respect to the time frame of the behavioral report, to take into account the subjects’ reaction time (Luce, 1986). For each subject and stimulus condition, the extent of the periods of perceived actual motion (generally longer than the illusory motion periods) was reduced so that the distributions of period durations for perceived actual and illusory motion were comparable (so the two datasets could be directly compared). The procedure for data reduction involved determining the distribution of illusory period durations and for each of these periods extracting a comparable amount of data from the middle of a “real mo-tion” period of sufficient duration. The resulting periods for each per-ceptual condition were then concatenated (the potential spectral artifacts induced by this concatenation were minimized using custom-designed Matlab code and manual rejection for any remaining artifacts), and the signals were bandpass filtered between 2 and 100 Hz. The power spec-trum was then calculated for each perceptual condition and electrode (using Welch’s averaged, modified periodogram method). Differences between conditions were estimated using t scores (mean difference di-vided by the SE across subjects).
EEG dynamics and receiver operator characteristic analysis. After we
determined that the 13 Hz spectral component of the EEG was the main correlate of the illusion (see Results), we selected the three electrodes in which this effect was most pronounced (electrodes C4, P4, and PO4 in the 10/20 nomenclature) and calculated the average 13 Hz power (⫾0.25 Hz) for these electrodes at each time point of the entire experiment (Fourier analysis with a fixed-length sliding Hanning window). These signals were then divided in 3 s epochs straddling each perceptual tran-sition (i.e., the moment at which a subject’s report changed on the key-board), and these epochs were averaged with respect to the time of the perceptual reversal. This was done separately for transitions to and from illusory motion. We also used these signals (before averaging) to perform the following receiver operator characteristic (ROC) analysis: for each perceptual transition, the slope of the signal (that is, the change in the absolute amount of power,⬃13 Hz) was estimated over the period (⫺2000 to 150 ms) before the transition occurred. A threshold was set and slopes that passed the threshold were classified as transitions from illusory motion, whereas slopes that did not pass the threshold were classified as transitions to illusory motion. A correctly classified transi-tion from illusory motransi-tion was counted as a “hit,” and an incorrectly classified transition to illusory motion was counted as a “false alarm.” The procedure was repeated for all applicable values of the threshold, and the proportion of hits was plotted as a function of the false alarm rate. The
area under the resulting ROC curve indicated (for each subject and stim-ulus condition) the ability of our 13 Hz EEG power signal to predict, on a trial-by-trial basis, the direction of the upcoming subjective perceptual reversal. A variant of this procedure was also applied, in which the critical time window used for determining the slope of the 13 Hz signal was allowed to vary for each subject, with the constraint that the window should be 1000 ms in length and entirely contained within the interval (⫺2000 to 150 ms). Finally, a control analysis was performed (for both variants of the ROC analysis) by first randomly shuffling the directions of the perceptual transitions and then applying the corresponding ROC analysis (this was repeated 100 times, and the results were averaged over repetitions). This control provided an independent estimate of the actual “chance level” for our ROC results.
Results
We collected large samples of EEG data (up to 60 min overall per
subject) while our 12 human observers fixated a constantly
rotat-ing wheel. Accordrotat-ing to the subjects’ reports, we separated these
data into periods of perceived actual motion and periods of
ex-perienced illusory motion (as in previous reports, the illusory
percept occurred
⬃25–30% of the total viewing time) and
com-pared the power spectrum of the EEG in these two conditions.
Because the physical stimulus was identical in both cases, and
only the subjective percept differed, we thus hoped to isolate the
EEG correlates of the continuous wagon wheel illusion.
The resulting power spectra in the two perceptual conditions
were very similar (Fig. 1 A, B), with a characteristically decreasing
profile and a local peak at 10 Hz in the
␣ band, for some of the
electrodes. Nevertheless, a statistical comparison revealed one
primary difference between these conditions (Fig. 1C,D):
⬃13 Hz
the EEG power was stronger during periods of experienced real
motion compared with periods of perceived illusory motion.
This difference at 13 Hz was significant for several electrodes,
even after a Bonferroni correction for multiple comparisons
across electrodes was applied (t
(23)⬎ 3.3; p ⬍ 0.05). There were
no other significant differences between the two perceptual
con-ditions, even in more classical frequency bands such as the theta
(4 –7 Hz),
␣ (8–12 Hz),  (15–25 Hz), or gamma bands (30–70
Hz), in which such correlates may have been expected.
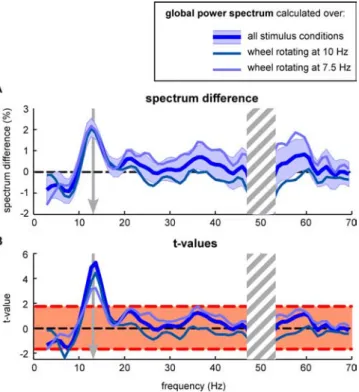
Next, we examined whether the 13 Hz EEG component may
have been directly driven or “entrained” by the periodic visual
stimulus or whether it could be considered a reflection of internal
processes operating independently of the visual stimulation. To
this end, we contrasted the results obtained for the two stimulus
conditions (i.e., with wheels rotating at 7.5 vs 10 Hz). For
sim-plicity and to increase statistical power, we first computed the
global power spectrum over the entire scalp (i.e., averaged across
all 32 electrodes) and again subtracted the two (global) power
spectra corresponding to perceived real and perceived illusory
motion. This comparison (Fig. 2) again yielded a single peak at
⬃13 Hz, in which the difference was highly significant (t
(23)⫽
5.3; p
⫽ 0.00001), confirming our previous observation.
Impor-tantly, when the same difference was calculated separately for the
two stimulus conditions (wheels rotating at 7.5 or 10 Hz), the
results were very similar (Fig. 2 A), and the 13 Hz component was
the only jointly significant effect (Fig. 2 B) (t
(11)⫽ 4.5, p ⬍ 0.0005
for the wheels at 10 Hz; t
(11)⫽ 3.2, p ⬍ 0.005 for the wheels at
7.5 Hz). The convergence of results derived from entirely
inde-pendent sets of trials is a further indication that the 13 Hz
differ-ence is a statistically solid phenomenon. Furthermore, this
con-vergence implies that the present EEG correlate of illusory
motion does not vary with the temporal frequency of the stimulus
and is thus likely to reflect an internal generator of the illusion
rather than a mere byproduct of the periodic visual stimulation.
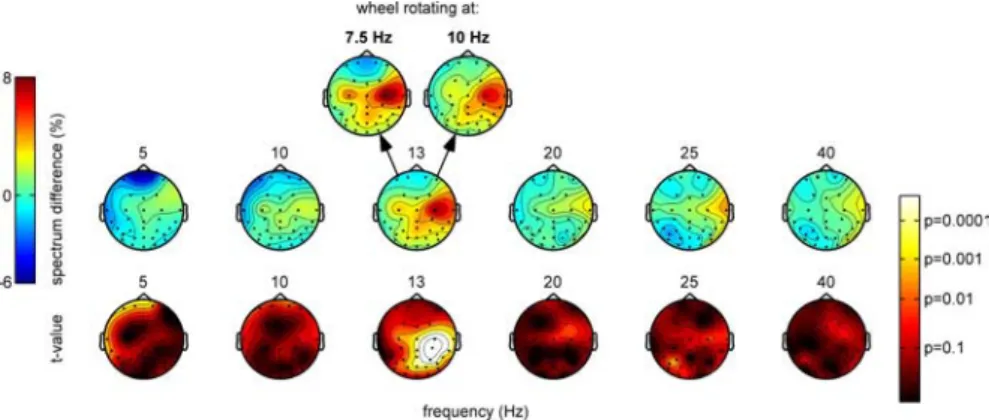
The spatial distribution of these effects on the scalp is
illus-trated in Figure 3, which again reveals that differences in the
subjectively perceived direction of motion (i.e., real vs illusory)
were mostly reflected in the 13 Hz spectral component rather
than in more classical frequency bands. The topography of the 13
Hz spectrum difference highlighted a group of centroparietal
electrodes, with a right hemisphere bias, an observation also
con-firmed by the corresponding significance scalp maps.
Further-more, the topographies obtained for the two stimulus conditions
(i.e., wheels rotating at 7.5 and 10 Hz) were remarkably similar,
although they were derived from entirely independent sets of
trials: this again suggests that the underlying effect is highly
reliable.
In our procedure, subjects reported illusory motion by
press-ing one key and real motion by presspress-ing another (half of the
subjects pressed the left arrow key to report illusory motion,
while the other half pressed the right arrow key). Given the
later-alization of the topography obtained in Figure 3 and the
proxim-ity of motor cortex to our most significant effects, one might
argue that what we are recording is in fact simply a correlate of
pressing one or the other arrow key. This would imply, however,
that the effect should happen in opposite directions for the two
groups of subjects, because illusory and real motion
corre-sponded to opposite sets of keys for those two groups. To address
this issue, we analyzed the power spectrum difference between
the two perceptual conditions separately for each group (over the
same, three most significant electrodes; as determined from Fig.
3). For both groups, there was a single significant spectral
com-ponent peaking at
⬃13 Hz (t test; p ⬍ 0.00001 for subjects who
reported the illusion with the left arrow key and p
⬍ 0.0001 for
the other group). Importantly, this component was of the same
sign for both groups (higher 13 Hz amplitude during real motion
perception), indicating that there was no confound as a result of
the key press (supplemental Fig. 5, available at www.jneurosci.org
as supplemental material). For completeness, we also verified
that the data obtained from left-handed and right-handed
sub-jects (three vs nine subsub-jects, respectively) was compatible. Again,
both groups revealed a single significant component at
⬃13 Hz (t
test; p
⬍ 5.10
⫺3and p
⬍ 5.10
⫺7for left- and right-handed
sub-jects, respectively), with a peak of the same sign (supplemental
Fig. 6, available at www.jneurosci.org as supplemental material).
Figure 1. EEG correlates of illusory motion perception. The power spectrum of the EEG was calculated independently for all periods during which real motion (A) and illusory motion (B) was experienced. All curves are averaged over 12 subjects. Each curve corresponds to one of the 32 scalp electrodes. Signals display a characteristically decreasing power spectrum, with a local peak at 10 Hz (in the␣ frequency range). The strong decrease of EEG power at 50 Hz is a consequence of the hardware notch filter. The signals around this value were not analyzed further and are hidden by hatched rectangles in all remaining plots. C, The subtraction of the two power spectra (real minus illusory motion; expressed as a percentage of the absolute power obtained in the illusory motion condition) reveals a strong difference,⬃13 Hz, observed for several electrodes simultaneously. D, This difference is highly significant, as shown by the t values estimated over the group of subjects (and here, collapsed over the 2 stimulus conditions). The dashed red lines mark the p⬍ 0.05 significance threshold, corrected for multiple compar-isons across electrodes (Bonferroni’s correction). More than one dozen electrodes exceed this threshold in the vicinity of 13 Hz, whereas no other significant correlate of the illusion is ob-served in other frequency bands.
Figure 2. The power difference at 13 Hz is independent of the temporal frequency of the stimulus. A, The difference in global power spectrum (averaged over all subjects and electrodes) between the periods of real and illusory motion percepts is computed for all stimulus conditions together and also separately for the wheels rotating at 7.5 and 10 Hz. The peak difference at 13 Hz is common to both curves. B. The t values confirm that the difference at 13 Hz is highly significant for both stimulus conditions. The dashed red lines mark the p⬍ 0.05 significance threshold.
Our final analysis explored the temporal dynamics of the
re-lationship between changes in the absolute amount of power at
⬃13 Hz in the EEG and the perceived direction of motion. As
shown in Figure 4 A, we found that 13 Hz power (calculated over
the three electrodes displaying the most significant effect; as
de-termined from Fig. 3) tended to decrease during the 2 s preceding
a perceptual transition from real to illusory motion (as
deter-mined from the subjects’ keyboard responses) and to increase
during the 2 s preceding the opposite perceptual transition, from
illusory to real motion. In other words, the slope of the 13 Hz
power signal within the last 2 s before a subject experienced a
perceptual reversal appeared to indicate the direction of this
up-coming transition. We tested whether this
relationship could be sufficiently
consis-tent to predict the direction of perceptual
transitions on a trial-by-trial basis by
per-forming an ROC analysis using the slope
of the 13 Hz EEG power over the period
⫺2000 to 150 ms before each perceptual
reversal as the prediction variable. The
area under the resulting ROC curve (Fig.
4 B) was on average 55.7% (
⫾1.6%),
which was significantly above chance level
(50%; t
(23)⫽ 3.2; p ⫽ 0.002). This was also
true when chance level was estimated by
shuffling the direction of the perceptual
transitions corresponding to each trial and
then performing the ROC analysis on this
shuffled data. The shuffling procedure was
repeated 100 times, and the resulting
chance level (averaged over repetitions)
was estimated at 50.9%, still significantly
below (paired t test; t
(23)⬎ 2.5; p ⬍ 0.01) our ROC predictions.
In a variant of this analysis, we acknowledged that different
subjects may use different strategies and/or rely on different
tem-poral dynamics of the 13 Hz power to determine their response.
Thus, we allowed the time window used for determining the slope
of the 13 Hz power to vary across subjects; the window duration
was fixed at 1000 ms, and only the window onset was permitted to
vary between 2000 and 1150 ms before the transition. The
ob-tained predictions were better in this case (Fig. 4C), with an
av-erage area under ROC curve of 60.9% (
⫾1.3%), which was
sig-nificantly higher than 50% (t
(23)⬎ 7.3; p ⬍ 10
⫺7) and also
significantly higher than the chance level determined from the
shuffling procedure applied with the same variable window
method (57.2%; paired t test; t
(23)⬎ 2.5; p ⬍ 0.01).
Discussion
The only component of the EEG power spectrum that was
af-fected during the continuous wagon wheel illusion was found at
⬃13 Hz. Furthermore, changes in the amount of power in the 13
Hz band of the EEG predicted above chance, on a trial-by-trial
basis, the direction of perceived motion, although the physical
stimulus never changed on the retina. This is compatible with the
notion that some neuronal process with a periodicity in the 13 Hz
regime may trigger the perceptual switch. Although the accuracy
of these predictions is only marginal, it is important to remember
that they rely on single-trial EEG data, which in general are
deemed inherently too noisy to be analyzed (Picton et al., 2000).
The level of prediction obtained is, in fact, comparable with
re-sults from single-cell experiments in monkeys, in which
per-ceived motion direction (during constant physical stimulation) is
also predicted with accuracy between 55 and 60% (Britten et al.,
1996). We hope that our reasonably successful endeavor may
thus motivate additional studies of the relationship between
single-trial EEG activity and conscious visual perception.
An important outcome of our results is the absence of any
correlate of the continuous wagon wheel illusion in the “classical”
frequency bands of the EEG. In particular, the gamma frequency
band (30 –70 Hz) has often been found to reflect conscious visual
perception (Tallon-Baudry et al., 1997; Rodriguez et al., 1999;
Tallon-Baudry and Bertrand, 1999), and thus correlates of
illu-sory motion perception might have been expected to turn up in
this band. Why was this not the case here? The continuous wagon
wheel illusion may very well engage different neuronal dynamics
Figure 3. Scalp distribution of the EEG correlates of illusory motion perception (average over 12 subjects). For six different temporal frequencies (⫾0.25 Hz) of the EEG, the relative power difference between periods of perceived real and perceived illusory motion is plotted as a color code (scale to the left) at the corresponding electrode location. The bottom row illustrates the statistical significance of this difference in a similar manner (scale to the right). At 13 Hz, where these effects are dominant, the scalp topography of the effects is comparable for the two stimulus conditions (wheels rotating at 7.5 or 10 Hz).
Figure 4. Variations in 13 Hz power predict upcoming transitions. A, Within the 2 s leading up to a perceptual reversal (i.e., a change of the subject’s response), the EEG power at 13 Hz (calculated over the 3 most significant electrodes; determined from Fig. 3) is a good indicator of the type of transition: it decreases before transitions from real to illusory motion and increases before transitions from illusory to real motion. The curves are averaged over all 12 subjects, and the shaded area represents SEM. B, Using the slope of this signal (calculated from⫺2000 to ⫺150 ms before each perceptual reversal), we attempted to predict the direction of the up-coming subjective transitions on a trial-by-trial basis. The histogram represents the distribution of areas under the resulting ROC curves for all subjects and stimulus conditions, reflecting the accuracy of the prediction. The vertical arrows point to the average area (55.7%), which was significantly higher than chance ( p⫽ 0.002). C, We could predict the direction of subjective reversals more accurately when we allowed the time window used for estimating the slope of the 13 Hz signal to vary between different subjects (keeping the window length equal to 1000 ms and entirely contained within the interval⫺2000 to 150 ms). This accounted for the possi-bility that the time course of 13 Hz EEG power may differ across subjects. In this case, the average area was 60.9%, significantly higher than chance ( p⬍ 10⫺7).
than in those previous experiments, but it is also worth noting
that the aforementioned studies have simply discarded (or
high-pass filtered) spectral components
⬍15 or 20 Hz on the
assump-tion that they mostly reflect cortical inactivity (Pfurtscheller et al.,
1996). A reexamination of the relationship between
low-frequency (i.e.,
⬍20 Hz) and high-frequency (⬎20 Hz)
compo-nents of the power spectrum may thus be called for in future
studies (von Stein and Sarnthein, 2000; Varela et al., 2001).
Previous work has explored the spectral correlates of
percep-tual reversals during binocular rivalry, another type of bistable
phenomenon. Both human EEG experiments (Kobayashi et al.,
1996; Doesburg et al., 2005) and electrophysiological
investiga-tions in the primary visual cortex of mammals (Fries et al., 1997;
Gail et al., 2004), however, have so far failed to come to an
agree-ment. Certain studies register mainly gamma-band correlates of
perceptual switching (Fries et al., 1997; Revonsuo et al., 1997;
Doesburg et al., 2005), whereas for others, the critical spectral
components are
⬃10 Hz (Kobayashi et al., 1996; Gail et al., 2004).
It is still an open question whether one or several spectral
corre-lates exist for the different types of bistable phenomena
(includ-ing Necker cubes, figure-ground ambiguous stimuli, binocular
rivalry, and others).
The fact that 13 Hz power decreases during the continuous
wagon wheel illusion does not necessarily imply that the
under-lying neural sources are less active in this perceptual condition
than during real motion. Alpha-band activity, which may include
this spectral component, is usually most clearly visible when the
cortex is at rest (Adrian and Yamagiwa, 1935). There is a
consid-erable body of literature showing event-related
desynchroniza-tion (ERD) in lower-frequency bands (5–25 Hz) as a result of
performing various visual tasks (Pfurtscheller et al., 1994, 1996;
Pfurtscheller and Lopes da Silva, 1999; Klimesch et al., 2000). The
amplitude of this ERD correlates with task complexity (Van
Win-sum et al., 1984; Dujardin et al., 1995) and attention (Dujardin et
al., 1993; Foxe et al., 1998; Worden et al., 2000). Interestingly,
these EEG or MEG power decreases in the 5–25 Hz frequency
range have been linked to task-dependent increases in the
func-tional magnetic resonance imaging blood oxygen
level-dependent hemodynamic response (Singh et al., 2002). Thus, our
decreased 13 Hz power during the illusion may, in fact,
corre-spond to increased activation of the underlying neuronal sources.
What, then, could be the sources of the present effect?
Infer-ring this from EEG data recorded at the scalp is a necessarily
speculative endeavor, which must only be done with caution. The
topographical analysis (Fig. 3) hints at an involvement of right
parietal regions in the illusion. These regions have been
impli-cated numerous times in visual tasks involving attention (Buchel
et al., 1998; Coull and Frith, 1998; Rees and Lavie, 2001; Corbetta
and Shulman, 2002), which would be compatible with the known
involvement of attention during the continuous wagon wheel
illusion (VanRullen et al., 2005). The same regions also display
increased activity at the time of perception switches during
bist-able stimulation (Lumer et al., 1998). An important observation
is that patients with right parietal lesions, although they can
dis-criminate continuous motion and also perceive flicker normally,
tend to show bilateral deficits in the perception of apparent
mo-tion (Battelli et al., 2001) and in the discriminamo-tion of the
direc-tion (onset vs offset) of temporal events (Battelli et al., 2003).
These temporal discrimination abilities may be critical for
per-ceiving reversed motion in our illusion; this line of reasoning
would thus bring us to predict that such patients may never
ex-perience the continuous wagon wheel illusion.
What are the theoretical implications of our results with
re-spect to the temporal organization of visual perception? The
present report is purely descriptive: we show that 13 Hz EEG
power correlates with the illusion, but this does not inform us as
to how this correlation comes about, and in particular what
neu-ral mechanisms could underlie. Note also that the mere existence
of this correlation does not allow us to infer with certainty the
direction of any causal link between 13 Hz EEG power and the
illusion (in other words, reversed motion perception may be
causing the 13 Hz power decrease rather than the opposite). We
previously proposed a Fourier motion energy model based on
discrete subsampling
⬃15 Hz that could accurately predict the
quantitative psychophysical properties of this illusion
(VanRul-len et al., 2005). It is easy to draw a direct link between this model
and our current results, but at this stage, such a link can only be
speculative. The present results by themselves cannot resolve the
debated question of discrete versus continuous motion
process-ing; yet they constrain the range of models of motion perception
that can explain the illusion. Obviously, models based on discrete
subsampling at 10 –15 Hz (Purves et al., 1996; Simpson et al.,
2005; VanRullen et al., 2005) are in a good position to satisfy these
new constraints. Other explanations, however, such as those
based on the properties of Reichardt motion detectors
(Reichardt, 1961; van Santen and Sperling, 1985) and neuronal
adaptation may still account for the illusion (Schouten, 1967;
Kline et al., 2004), but for this they would have to be modified to
accommodate not only for the temporal frequency dependency
of this illusion, as shown previously (Simpson et al., 2005;
Van-Rullen et al., 2005) and discussed by Andrews and Purves (2005),
Andrews et al. (2005), and Holcombe et al. (2005), but now also
for the very specific electrophysiological correlates at 13 Hz
dem-onstrated here.
References
Adrian ED, Yamagiwa K (1935) The origin of the Berger rhythm. Brain 58:323–351.
Andrews T, Purves D (2005) The wagon-wheel illusion in continuous light. Trends Cogn Sci 9:261–263.
Andrews T, Purves D, Simpson WA, VanRullen R (2005) The wheel keeps turning: reply to Holcombe et al. Trends Cogn Sci 9:560 –561.
Battelli L, Cavanagh P, Intriligator J, Tramo MJ, Henaff MA, Michel F, Barton JJ (2001) Unilateral right parietal damage leads to bilateral deficit for high-level motion. Neuron 32:985–995.
Battelli L, Cavanagh P, Martini P, Barton JJ (2003) Bilateral deficits of tran-sient visual attention in right parietal patients. Brain 126:2164 –2174. Britten KH, Newsome WT, Shadlen MN, Celebrini S, Movshon JA (1996) A
relationship between behavioral choice and the visual responses of neu-rons in macaque MT. Vis Neurosci 13:87–100.
Buchel C, Josephs O, Rees G, Turner R, Frith CD, Friston KJ (1998) The functional anatomy of attention to visual motion. A functional MRI study. Brain 121:1281–1294.
Corbetta M, Shulman GL (2002) Control of goal-directed and stimulus-driven attention in the brain. Nat Rev Neurosci 3:201–215.
Coull JT, Frith CD (1998) Differential activation of right superior parietal cortex and intraparietal sulcus by spatial and nonspatial attention. Neu-roImage 8:176 –187.
Crick F, Koch C (2003) A framework for consciousness. Nat Neurosci 6:119 –126.
Doesburg SM, Kitajo K, Ward LM (2005) Increased gamma-band syn-chrony precedes switching of conscious perceptual objects in binocular rivalry. NeuroReport 16:1139 –1142.
Dujardin K, Derambure P, Defebvre L, Bourriez JL, Jacquesson JM, Guieu JD (1993) Evaluation of event-related desynchronization (ERD) during a recognition task: effect of attention. Electroencephalogr Clin Neuro-physiol 86:353–356.
Dujardin K, Bourriez JL, Guieu JD (1995) Event-related desynchronization (ERD) patterns during memory processes: effects of aging and task diffi-culty. Electroencephalogr Clin Neurophysiol 96:169 –182.
Eagleman DM, Churchland PS (2005) Ten unsolved questions of neuro-science. Cambridge, MA: MIT.
Foxe JJ, Simpson GV, Ahlfors SP (1998) Parieto-occipital approximately 10 Hz activity reflects anticipatory state of visual attention mechanisms. NeuroReport 9:3929 –3933.
Fries P, Roelfsema PR, Engel AK, Konig P, Singer W (1997) Synchroniza-tion of oscillatory responses in visual cortex correlates with percepSynchroniza-tion in interoccular rivalry. Proc Natl Acad Sci USA 94:12699 –12704. Gail A, Brinksmeyer HJ, Eckhorn R (2004) Perception-related modulations
of local field potential power and coherence in primary visual cortex of awake monkey during binocular rivalry. Cereb Cortex 14:300 –313. Harter MR (1967) Excitability cycles and cortical scanning: a review of two
hypotheses of central intermittency in perception. Psychol Bull 68:47–58. Holcombe AO, Clifford CW, Eagleman DM, Pakarian P (2005) Illusory motion reversal in tune with motion detectors. Trends Cogn Sci 9:559 –560.
Klimesch W, Doppelmayr M, Rohm D, Pollhuber D, Stadler W (2000) Si-multaneous desynchronization and synchronization of different alpha responses in the human electroencephalograph: a neglected paradox? Neurosci Lett 284:97–100.
Kline K, Holcombe AO, Eagleman DM (2004) Illusory motion reversal is caused by rivalry, not by perceptual snapshots of the visual field. Vision Res 44:2653–2658.
Kobayashi T, Kato K, Owada T, Kuriki S (1996) Difference of EEG spectral powers observed between binocular rivalry and binocular fusion. Front Med Biol Eng 7:11–19.
Luce RD (1986) Response times. Oxford: Oxford UP.
Lumer ED, Friston KJ, Rees G (1998) Neural correlates of perceptual rivalry in the human brain. Science 280:1930 –1934.
Pakarian P, Yasamy MT (2003) Wagon-wheel illusion under steady illumi-nation: real or illusory? Perception 32:1307–1310.
Pfurtscheller G, Lopes da Silva FH (1999) Event-related EEG/MEG syn-chronization and desynsyn-chronization: basic principles. Clin Neurophysiol 110:1842–1857.
Pfurtscheller G, Neuper C, Mohl W (1994) Event-related desynchroniza-tion (ERD) during visual processing. Int J Psychophysiol 16:147–153. Pfurtscheller G, Stancak Jr A, Neuper C (1996) Event-related
synchroniza-tion (ERS) in the alpha band–an electrophysiological correlate of cortical idling: a review. Int J Psychophysiol 24:39 – 46.
Picton TW, Bentin S, Berg P, Donchin E, Hillyard SA, Johnson Jr R, Miller GA, Ritter W, Ruchkin DS, Rugg MD, Taylor MJ (2000) Guidelines for using human event-related potentials to study cognition: recording stan-dards and publication criteria. Psychophysiology 37:127–152.
Purves D, Paydarfar JA, Andrews TJ (1996) The wagon wheel illusion in movies and reality. Proc Natl Acad Sci USA 93:3693–3697.
Rees G, Lavie N (2001) What can functional imaging reveal about the role of attention in visual awareness? Neuropsychologia 39:1343–1353.
Reichardt W (1961) Autocorrelation, a principle for the evaluation of sen-sory information by the central nervous system. In: Sensen-sory communica-tion (Rosenblith WA, ed), pp 303–317. Cambridge, MA: MIT. Revonsuo A, Wilenius-Emet M, Kuusela J, Lehto M (1997) The neural
gen-eration of a unified illusion in human vision. NeuroReport 8:3867–3870. Rodriguez E, George N, Lachaux JP, Martinerie J, Renault B, Varela FJ (1999) Perception’s shadow: long-distance synchronization of human brain ac-tivity. Nature 397:430 – 433.
Schouten JF (1967) Subjective stroboscopy and a model of visual movement detectors. In: Models for the perception of speech and visual form (Wathen-Dunn I, ed), pp 44 – 45. Cambridge, MA: MIT.
Shallice T (1964) The detection of change and the perceptual moment hy-pothesis. Br J Stat Psychol 17:113–135.
Simpson WA, Shahani U, Manahilov V (2005) Illusory percepts of moving patterns due to discrete temporal sampling. Neurosci Lett 375:23–27. Singh KD, Barnes GR, Hillebrand A, Forde EM, Williams AL (2002)
Task-related changes in cortical synchronization are spatially coincident with the hemodynamic response. NeuroImage 16:103–114.
Stroud JM (1956) The fine structure of psychological time. In: Information theory in psychology (Quastler H, ed), pp 174 –205. Chicago, IL: Free Press.
Tallon-Baudry C, Bertrand O (1999) Oscillatory gamma activity in humans and its role in object representation. Trends Cogn Sci 3:151–162. Tallon-Baudry C, Bertrand O, Delpuech C, Permier J (1997) Oscillatory
gamma-band (30 –70 Hz) activity induced by a visual search task in hu-mans. J Neurosci 17:722–734.
VanRullen R, Koch C (2003) Is perception discrete or continuous? Trends Cogn Sci 7:207–213.
VanRullen R, Reddy L, Koch C (2005) Attention-driven discrete sampling of motion perception. Proc Natl Acad Sci USA 102:5291–5296. van Santen JP, Sperling G (1985) Elaborated Reichardt detectors. J Opt Soc
Am A 2:300 –321.
Van Winsum W, Sergeant J, Geuze R (1984) The functional significance of event-related desynchronization of alpha rhythm in attentional and acti-vating tasks. Electroencephalogr Clin Neurophysiol 58:519 –524. Varela F, Lachaux JP, Rodriguez E, Martinerie J (2001) The brainweb: phase
synchronization and large-scale integration. Nat Rev Neurosci 2:229 –239.
von Stein A, Sarnthein J (2000) Different frequencies for different scales of cortical integration: from local gamma to long-range alpha/theta syn-chronization. Int J Psychophysiol 38:301–313.
Worden MS, Foxe JJ, Wang N, Simpson GV (2000) Anticipatory biasing of visuospatial attention indexed by retinotopically specific alpha-band electroencephalography increases over occipital cortex. J Neurosci 20:RC63(1– 6).