Publisher’s version / Version de l'éditeur:
Physical Review B, 44, 22, pp. 12307-12313, 1991-12-01
READ THESE TERMS AND CONDITIONS CAREFULLY BEFORE USING THIS WEBSITE. https://nrc-publications.canada.ca/eng/copyright
Vous avez des questions? Nous pouvons vous aider. Pour communiquer directement avec un auteur, consultez la
première page de la revue dans laquelle son article a été publié afin de trouver ses coordonnées. Si vous n’arrivez pas à les repérer, communiquez avec nous à [email protected].
Questions? Contact the NRC Publications Archive team at
[email protected]. If you wish to email the authors directly, please see the first page of the publication for their contact information.
NRC Publications Archive
Archives des publications du CNRC
This publication could be one of several versions: author’s original, accepted manuscript or the publisher’s version. / La version de cette publication peut être l’une des suivantes : la version prépublication de l’auteur, la version acceptée du manuscrit ou la version de l’éditeur.
For the publisher’s version, please access the DOI link below./ Pour consulter la version de l’éditeur, utilisez le lien DOI ci-dessous.
https://doi.org/10.1103/PhysRevB.44.12307
Access and use of this website and the material on it are subject to the Terms and Conditions set forth at
Optical hole burning and spectral diffusion in ruby
Szabo, A.; Kaarli, R.
https://publications-cnrc.canada.ca/fra/droits
L’accès à ce site Web et l’utilisation de son contenu sont assujettis aux conditions présentées dans le site LISEZ CES CONDITIONS ATTENTIVEMENT AVANT D’UTILISER CE SITE WEB.
NRC Publications Record / Notice d'Archives des publications de CNRC:
https://nrc-publications.canada.ca/eng/view/object/?id=876870db-2176-4edf-a8f4-4c945d13c98e
https://publications-cnrc.canada.ca/fra/voir/objet/?id=876870db-2176-4edf-a8f4-4c945d13c98e
PHYSICAL REVIEWB VOLUME 44,NUMBER 22 1DECEMBER 1991-II
Optical
hole burning and
spectral
diffusion in ruby
A.
Szabo andR.
Kaarli*Institute ofMicrostructural Sciences, National Research Council ofCanada, Ottawa, Ontario, Canada KIAOR6
(Received 1July 1991)
Frequency-domain optical hole burning ofthe
R,
line["
A2(—
—')~E(
—
—')
transition] in dilute ruby isstudied at 2Kand with afield of 3.6kG applied along the caxis. A pump-probe (PP) technique is used with precise probe-frequency shifting obtained by an acousto-optic modulator. For sufficiently short PP
pulses (50ps),two holes (narrow and wide) are observed. The narrow (
-20
kHz half width athalfmax-imum at low power) hole-width dependence on Rabi frequency approximately agrees with that inferred from free-induction-decay measurements. Forthe present concentration (0.0034wt.%%uoCr~03)and field,
the narrow hole width isdetermined byfluctuating fields produced byCr-Cr spin flips [A.Szabo,
T.
Mu-ramoto, andR.
Kaarli, Phys. Rev. B42,7769(1990)].When the PPdelay time isvaried, the amplitude ofthe narrow hole decays with a 1/etime constant of-300
pscompared totheE
fluorescence lifetime of4ms. The wide hole (—
500 kHz half width athalf maximum) is due to Al-Cr superhyperfineinterac-tions and iscreated bya spectral di6'usion mechanism driven by Al-spin flipping inthe host lattice.
I.
INTRODUCTIONFollowing the initial experimental demonstration by
Brewer and DeVoe'
of
the failureof
the optical Blochequations (OBE)in describing the saturation
of
an opticaltransition in a solid
(Pr:LaF3),
a large numberof
theoreti-cal ' studies have appeared as well as further experi-mentalwork"
' (in ruby, Cr:A1203). As discussed by Herman, quantitative understandingof
the saturation behavior has not yet been achieved and further experi-mental studies are needed. In particular, Yamanoi and Eberly have suggested frequency-domain [hole-burning(HB)]studies to further test the various theories. As dis-cussed earlier, '
HB
can provide useful additional tests since, for the finite preparation times employed in the ex-periments, the various theories predict differingcompli-cated hole shapes in contrast to time-domain [free-induction-decay
(FID)]
predictions that look similar inshape forthe various theories.
Our first measurements'
of
high-resolutionHB of
theR& line in ruby showed that
HB
widths were—
10timeslarger than the
FID
widths. The purposeof
this paper isto explain this discrepancy and to outline conditions un-der which agreement between
HB
andFID
widths isob-tained. The underlying cause
of
this effect is shown tobespectral diffusion.
II.
EXPERIMENTA. Hole burning
The setup used for the
HB
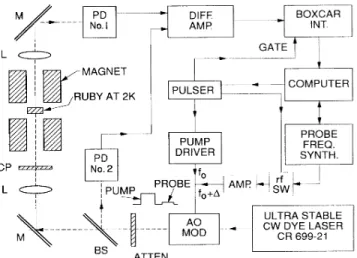
studies is shown inFig. 1.
The A2(
—
—,')~E( —
—,')
transition (selected by a circularpolarizer) in
0.
0034-wt%
Crz03 dilute ruby was studied. As in earlier work,"
' a fieldof
3.
6 kCx was applied along thec
axis and the sample temperature was 2K.
A Coherent model 699-21dye laser was modified' togive a peak-to-peak laser linewidth &2kHz for timesof
—
1ms.A pump-probe sequence
of
laser pulses, ''
repeated at25 Hz, was used to measure the hole shape. Except
where noted, all data was obtained for a pump
(=probe)
widthof
50 ps with a 10-pspump-probe separation time. The probe power was typically l—
5%%uoof
the pumppower. The light pulses were gated out
of
the cw beam by an acousto-optic modulator (AOM) drivensuccessive-ly by a fixed-frequency stable oscillator for the pump and
a computer-controlled frequency synthesizer to provide scanning probe
rf
pulses. The pump and probe pulse widths were equal and the boxcar gate was one-half the pulse width and set on the last halfof
the probe pulse. Following the AOM, the beam was split into"sample"
and"reference"
beams which were detected by silicon photodiodes with a common 6000
load and the signals subtracted to reduce amplitude noise and preventover-PD No.I DIFF. AMP. BOXCAR INT. I
c=&
pyyy~~
MAGNET RUBYAT2K PD CP No.2 I I LC
IPUMP GATE PULSER COMPUTER PUMP DRIVER Il PROBE FREQ. SYNTH, lff PROBE = AMP,Q
B~~
—— fo+ ULTRASTABLE CW DYELASER CR699-21 ATTEN.FIG.
1. Experimental setup for pump-probe hole-burning studies (seetext).12308 A. SZABO ANI3
R.
KAARLI loadingof
the amplifier by the pump pulse. (Not shownin
Fig.
1 are AOM switches in frontof
the two diodes tofurther suppress the pump pulse signals. ) Following
sub-traction, the probe signal was amplified by a low-noise amplifier (Stanford model SR560)and averaged by a box-car integrator. Each run consisted
of
101points taken at3-s intervals. The entire experiment was under computer
control with the data and experimental parameters stored on magnetic disc forlater analysis.
O
B.
Free-induction decayThe
FID
signal was directly detected by a photodiodeusing an AOM tosuppress the preparation optical pulse. While not quite as sensitive as the heterodyne scheme used earlier, ' itwas not susceptible tothe technical noise problems
of
the heterodyne method resulting in lessscatter
of
the data. Also, since no local oscillator beam exists in the sample,disturbance"
of
the inducedcoher-ence cannot occur. The diode signal was amplified by
ei-ther a low-noise, high-gain amplifier
of
1-MHz band-width (Stanford model SR560) or a 10-MHz bandwidth amplifier (Evans model 4163) for the faster decay times((1.
5ps) at higher Rabi frequencies. The decay signals were then averaged by a Data Precision6100
digitalos-cilloscope with amodel
660B
plug in. C. Rabi frequency measurements0
0
Time (p,s)
10
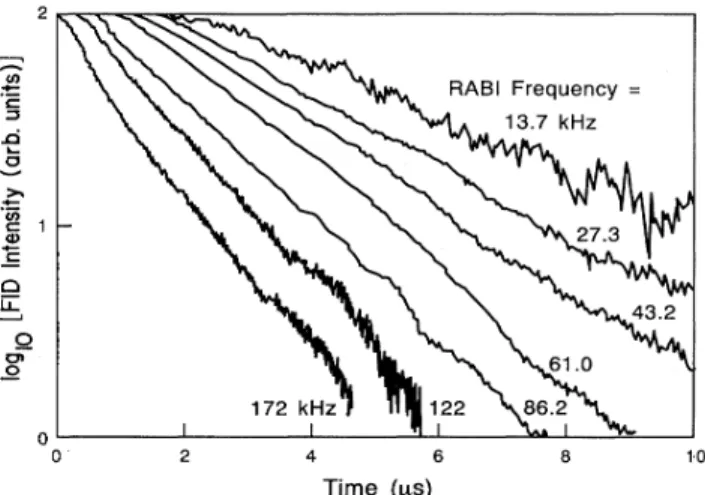
FIG.
2. Summary offree-induction decays observed for arange ofRabi frequencies.
Rabi frequencies, we found that
T,
b,~
T2/4 givingWF=1/(2~T2),
the normal optical Bloch result for the linewidthof
the population term wof
the Bloch vector (u,U,w).The Rabi frequency was measured by observation
of
the nutation frequency at high powers. The value ob-tained is,of
course, some average over the Gaussian beam shape. As shown by Shoemaker and Stryland, ' however, beam proNe effects do not significantly affectthe nutation frequency. Typically the observed nutation frequency is within
10% of
that calculated using the fieldintensity
of
the centerof
the beam.III.
RESULTSA. Free-induction decay
Examples
of
FID
data are summarized in Fig. 2. Thehole half-width,
8'~,
derived from theFID
decays iscal-culated from the equation
W~
=(
I/2n)
[I/(2T,
b,)—
1/T2],
where
T,
b, is the observed decay time and T2 is the de-phasing time measured by photon echoes.(For
the present ruby,T2=15
ius.)T,
b, is obtained by a regres-sion analysis fit to-2
ordersof
FID
intensity decay.It
should be noted fromFig.
2that theFID
decay is not a single exponential, thus the valuesT,
b, represent anaver-age decay. In particular, for large Rabi frequencies, there
is a fast initial decay followed by a slow decay. The re-gression analysis emphasizes the slow decay and this should be borne in mind for the derived hole widths presented later.
For
example, the hole width obtained from the initial partof
the decay (f~
=
172kHz) inFig.
2gives
8'+=83
kHz compared to8'+=58
kHz obtained by averaging over the entire decay. Finally, for smallB.
Hole burningExamples
of
theHB
data are shown inFig.
3 along with a regression analysis fitto
a Lorentzian line shape.Figure 4 shows
HB
data over a wider frequency range. This plot illustrates that the narrow central hole (Fig. 3) sits on a wide hole. The amplitudeof
the wide hole rela-tive to the narrow hole is found to increase as, (1)the lengthof
the pump pulse increases, (2)the separation be-tween the pump-probe pulses increases, and (3) the Rabifrequency increases.
An example
of
(1)is shown inFig.
5taken from earlier reported data' for a pump and probe pulseof
300 psseparated by 100
ps.
Under these conditions, only thewide hole is seen.
For
an intermediate pumping timeof
100 ps,
Fig.
6 shows a case where the broad and narrow holes have about equal amplitude. Earlier studies'of
the hole dependence on pump-probe separation show that, for a separation time2300
ps, the narrow hole disap-pears and only the broad hole remains.C. Summary ofdata
The dependence
of
the hole widths derived from theFID
and HB data (narrow hole) on the Rabi frequency isshown in
Fig.
7.
For
Rabi frequencies+
100 kHz, noHB
data is plotted since it becomes difticult to separate the narrow and wide holes.
If
8',
b, is the observed half-widthof
the hole, the deconvoluted width WH (plotted inFig.7)is given by
OPTICAL HOLE BURNING AND SPECTRAL DIFFUSION IN RUBY 12309 O CL L O (0 ntzian O 0 (h ~~ ~ ~ + ~ I —0.2 I —0.1 I 0.0 Frequency (MHz) ~~~ ~ ~ ~ ~ ~ ~ ~ 0 I 0.1 I 0.2 ~ ~ ~ ~ 0 Frequency (MHz) O (b)
FIG.
5. Hole shape observed when the pump and probepulsewidths are increased to 300ps. Rabi frequency
=
105kHz. I —0.2 I —0.1 I 0.0 Frequency (MHz) I 0.1 I 0.2
FIG.
3.Examples ofhole shapes seen for Rabi frequencies (a)8.9 kHz and {b)70 kHz. The solid curves show a regression
analysis fit ofa Lorentzian shape to the data. Pump and probe
pulsewidths
=
50ps.where we subtract the homogeneous width associated
with the probe from the observed width. Not included in
Eq.
(2) is the width arising from the finite widthof
the probe pulse. This isdificult to include precisely since theline shape from this source isnot Lorentzian. Numerical calculations show, however, that the correction to the
width is small;
-3
kHz for a 50-ps pulse. This was es-timated from the difference between the calculated hole width at a low Rabi frequency (1 kHz) for cw excitation [1/(2m T2)=10.
6 kHz] and for 50-ps pulses (—
16kHz),using the standard Bloch equations. '
O CL O (0 I —1.0 I 0.0 Frequency (MHz) 0.5 1.0 I —1.0 —0.5 0.0 Frequency (MHz) 0.5 1.0
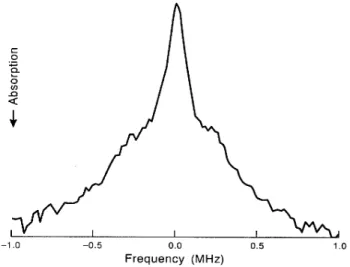
FIG.
4. Example ofhole shape observed over a wider fre-quency range than in Fig. 3. A narrow hole is observed sitting on awide hole. Rabi frequency=
36kHz and pump and probepulsewidths
=
50ps.FIG.
6. Hole shape showing an increase in the amplitude of the wide hole relative to the narrow hole as the laser intensity is increased. Compare to Fig. 4, Rabi frequency=
90kHz and12310 A. SZABO AND
R.
KAARLIbehavior, unlike the standard
OBE
which fail badly. Weconclude that the increasing hole width as the prepara-tion time is increased isnot aAuence effect.
40 20 CD O 0 0 I I 50 100 RABI Frequency (kHz) 150 200
FIG.
7. Rabi frequency dependence ofhole widths obtained from time-domain {free-induction decay) and frequency-domain(hole-burning) measurements.
IV. DISCUSSIGN
A. Comparison offrequency- and time-domain linewidths
A central result
of
this study is that near agreement isnow observed between frequency- and time-domain de-rived linewidths (Fig. 7) using short (50-ps) pump-probe pulses. Earlier studies' using 300-ps pump-probe pulses gave frequency-domain widths about an order
of
magni-tude larger than that inferred from time-domain(FID)
data.
An intuitive explanation for the frequency-domain re-sults might be that the hole width depends on Auence as shown by earlier calculations' using the standard
OBE.
TableI
shows hole widths calculated using the standardOBE
and two popular models for the modifiedOBE,
(1)Gauss-Markov and (2)random telegraph. The modified
OBE
predict widths that are almost independentof
preparation pulse lengths between 50 and 300 ps, unlike the standardOBE.
Although the modifiedOBE
arecer-tainly not
"correct"
in explaining all featuresof
opticalsaturation (in particular, hole shapes as will be discussed
later), they appear to approximately describe' the
FID
B.
Hole shapesFigure 3 shows that the experimental hole shapes are
Lorenztian consistent with the observed exponential de-cay
of
theFID
(for Rabi frequencies(100
kHz). Thesehole shapes disagree sharply with those predicted by the standard or modified
OBE.
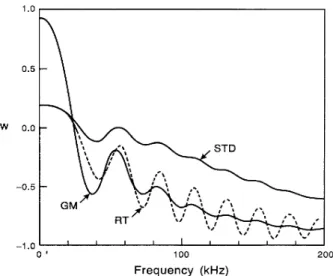
Theoretical hole shapes are shown inFig.
8 for a Rabi frequency=70
kHz and a preparation timeof
50 ps (pulseangle=7').
Generally all theories predict nutation structure in the hole. Inpar-ticular, as discussed earlier, ' the Gauss-Markov model
gives a long effective dephasing time near the center
of
the line and hence shows much deeper fluctuations there.As the pulse angle varies over multiples
of
m, the Blochvector component w at the center
of
the hole varies ap-proximately between+
1 and—
1 for the Gauss-Markov model. Experimentally, such a variation is not seen and the signal at the centerof
the line is always absorptive.To
some extent, the observed hole shape will be smoothed out by two factors: (1) convolutionof
the homogeneous line shape(10.
6-kHz half-width) with to,and (2)the effect
of
a Gaussian beam shape. These points remain to be studied in detail. However, the main factor in determining the hole shape is, we believe, spectraldiffusion during the pump-probe sequence.
C. Spectral di6'usion
Earlier work here' (in which the pump-probe separa-tion was varied), as well as the power and pump time dependence
of
the relative amplitudesof
the narrow andwide holes in the present work, suggests that the transfer
of
excitation between the two holes is due to spectral1.0
0.5
W 00
Hole half-width (kHz) Preparation Optical
time (ps) Bloch Gauss-Markov
Random
telegraph Expt.
TABLE
I.
Comparison oftheoretical and experimental hole half-width dependence on the width ofthe preparation pulse. In the calculation we assume the parameters, T&=4200 ps,T2
=
1S ps, correlation time=
1S ps, and a Rabi frequency=100
kHz. Also, the nutation structure {e.g.,Fig. 8)isaver-aged out incalculating the width.
—0.5 —1.0 QJ I I l 1QO Frequency (kHz) t g ~ t ii I I I 200 SO 300 cw 240 S30 1673 96 104 147 101 104 130
-60
610FIG.
8. Theoretical hole shapes for a Rabi frequency=70
kHz [compare to Fig. 3(b)], and three models for the opticalBloch equations: (1) standard {STD),(2) Gauss-Markov (GM), and (3) random telegraph (RT).
OPTICAL HOLE BURNING AND SPECTRAL DIFFUSION IN RUBY 12311 diffusion (SD). Before discussing the mechanisms for this
in detail, we first brieAy review SD concepts evolved for
magnetic resonance and discuss some additional concepts
needed to describe SD for optical transitions.
1.
BackgroundThe concept
of
spectral diffusion was first introducedin studies
of
magnetic resonance spectra. As noted byKlauder and Anderson' in 1962, SD is
"an
immensely complicated question."
Thirty years later, the complica-tions, both conceptual and experimental, still remain.The current description
of SD
rests on the recognitionof
at least three kinds
of
line broadening and the ideaof
spinor
resonance"packets.
"'
The most common typesof
broadening in solids, inhomogeneous and homogeneous,are well defined and understood. The former arises from
static variations in ion frequencies due to various host
de-fects and is observed in conventional linear spectroscopy.
An operational definition
of
the homogeneous linewidthis that it equals I/(m.T2) (FWHM), where T2 is the de-phasing time measured by echoes (assuming it has a Lorentzian shape), or, in general, is given by the Fourier
transform
of
the echo decay. In solids, at sum.ciently low temperatures and for which T2«
T
&, the dephasingsource is thought to be ultimately due to Aip-Hops
of
thehost and dopant spins. The spin Aips produce magnetic fiuctuations and hence corresponding frequency
jitter of
the ion under study. While it is obvious that hole burn-ing will occur for homogeneously broadened lines dis-tributed over a larger inhomogeneous width, it is notclear what will happen in the presence
of
a third typeof
broadening called quasistaticor
heterogeneous. ' Such broadening results from all possible configurationsof
host spin orientations around agiven ion.It
can be thoughtof
as a time-dependent inhomogeneous broadening. In thepacket description
of
saturation, we imagine that ions within a homogeneous linewidth from the excitation fre-quency will be excited and that this excitation will becar-ried over the heterogeneous linewidth as the spin orienta-tions evolve. A spectral difFusion time Td can be defined
as the time in which the frequency
of
an ion remains within a homogeneous width.In magnetic resonance, Td has been indirectly obtained from saturation measurements, ' however as far as the authors are aware, no frequency-domain observations has been made
of
hole burningof
a heterogeneously broadened line.To
give a feel for the various widths and lifetimes for Cr +magnetic resonance in the ruby groundstate, a value
of
Td=14
ps has been inferred using a transient saturation technique andT2-4
ps
(homogene-ous width=0.08 MHz)
measured by echoes. ' This isfor a sample
of
-0.
005%
concentration at fields 4—6ko
along thec
axis. The heterogeneous width due to Cr-Alsuperhyperfine (shf) broadening is
—
35MHz. In sum-mary, while the fluctuating packet descriptionof
satura-tion (as has evolved from the Portis original staticmod-el) is appealing from a conceptual and theoretical view,
some caution is needed in adopting this picture as has been emphasized by Klauder and Anderson. ' In the
case
of
optical transitions, SDassumes other complexities as will now bediscussed.If
SD is operationally defined as any process thatpro-duces a change in the inhomogeneously broadened ab-sorption line outside a monochromatically excited homo-geneous packet, then there are at least three distinct
pro-cesses that produce
SD.
(1) Energy transfer (spatialtransport): (a) spin-spin cross relaxation (direct process)
and (b) phonon-assisted transfer. (2) Environmental changes (no spatial transport): (a) host and impurity spin
Gipping (indirect process), (b) instantaneous diffusion, (c)
lattice changes (two-level systems), and (d) optically in-duced dynamic nuclear polarization. (3) Optical pump-ing.
We now briefly discuss some examples
of
these process-es. 1(a) has been observed in cw optical hole-burning ex-periments in ruby that showed a decreaseof
the entire A&inhomogeneous absorption line as well as a hole when the
3
2(+
—,' )~E(+
—,') lineof
Cr + was pumped with asingle-frequency laser. This result was shown to arise from Cr-Cr electron spin Aipping in the ground state be-tween ions resonant with the laser and nonresonant ions.
We note that, using the terminology
of
Mims, this is adirect spin process as opposed to 2(a) which is an indirect spin process. Process 1(b) has been observed ' in concen-trated ruby and other materials at temperatures
)
10K.
The overall effect
of
phonon-induced diffusion isthe same as 1(a)in that the entire inhomogeneous line isaffected by narrowband pumping.Process 2(a) is the one discussed earlier to explain SD
in magnetic resonance.
It
has also been used to describeoptical SD (Ref. 33) in the system
Pr +:CaF3.
Unlike process 1, this process produces SD over a frequency re-gion determined by the spin-spin and/or exchangein-teraction strength. The width
of
the SD is typically in the range0.
1—10 MHz depending on whether nuclear or electronic spins are involved. An example is thehetero-geneous dipolar broadened optical line width
of
—
80 kHzof
theH4~'D2
transitionof
Pr in LaF3 (homogene-ous width-20
kHz) produced byPr-F
nuclear spin dipo-lar interactions.Instantaneous diffusion [2(b)j has recently been ob-served in the optical region and arises because
of
thefrequency shift produced by nearby excited ions via an
electric dipole interaction. The observed shifts were in
the range 10—100 kHz for the system Eu
+:Y203.
Pro-cess 2(c)is usually seen ' in glasses and is much slower
(Td-s)
than diffusion times in crystals. Processes 2(d) and 3may be related, however, the mechanismof
optical-ly induced nuclear polarization in solids is poorlyunder-stood. Evidently, 2(d) is an intensity-dependent effect and results in nuclear ordering as suggested earlier by
DeVoe and Brewer. ' Finally, an example
of
3 isthe hole width seen at long times following optical excitation in the H4—
+'D2 transitionof Pr
+ in CaFz. A widthof 9
MHz is measured compared to the homogeneous width
of
0 37 MHz observed by echoes or delayed free-induction decay.It
appears that spectral diffusion in this material involves a complex seriesof
processes starting with indirect spin-flipping-induced diffusion outside the frozen cores at short times, followed by optical pumping12312 A. SZABG AND
R.
KAARLIof
the ground-state levels at times corresponding to thefiuorescence lifetime (500 ps) and finally spin flipping in the frozen core at longer times (s).
CA
2. Spectral diffusion in ruby
We believe that indirect spin fiipping [process 2(a)] is
responsible for optical SDin ruby. In ruby there are four spin systems to consider: (1) the Cr electronic spins in
resoriance and (2) nonresonant with the laser, (3) Al
nu-clear spins in the frozen core, and (4)Al spins just outside the core (i.
e.
,bulk spins). In addition, there are three op-tical linewidths to consider as discussed earlier.For
the dilute ruby used here, these linewidths have the FWHMvalues: inhomogeneous
-2
GHz, heterogeneous=1.
2 MHz, and homogeneous '-20
kHz. We notethat,
if
the crystal were perfect, then linear spectroscopywould display the heterogeneous width. The homogene-ous width, in principle, could be seen
if
a single ion could be observed assuming (a) the measurement was made in a time short compared to changes in the surrounding Al nuclear orientations and (b) the Cr-Al complex was ini-tially prepared to be in the same state. In practice, (b) would be nearly impossible to achieve (there are6'
possi-ble Al configurations in the first shell surrounding a Crion) which, along with optical pumping, would cause the
optical absorption to jump around making direct
frequency-domain observation
of
the homogeneous widthdificult.
We identify the wide hole (
—
1 MHz FWHM) in Figs. 4 and 6 as heterogeneous and the narrow hole as homo-geneous. The heterogeneous width is dueto
the Cr-Al shf interaction, whereas the homogeneous width still seems to be controlled by Cr-Cr interactions, even forthe present very dilute ruby. The increasing amplitude
of
the wide hole relative to the narrow hole as the laser in-tensity is increased is consistent with a packet modelof
SD in which the optical frequency
of
a given ion drifts inand out
of
resonance with the laser. The rateof
this driftwas measured by fixing the probe frequency equal to the pump frequency and observing the decay
of
the narrow line as the pump-probe spacing was varied (Fig. 9). This measurement shows that the narrow line completelycol-lapses into the broad line with a
1/e
timeof
-300
ps.
This time does not correspond to anyof
the known relax-ation processes in ruby as summarized in TableII.
We note that processes l(a) and 2(a) both can contribute tothe narrow line decay. However, the Cr-Cr direct
spin-fiip process
of
1(a)is too slow (2500-ps time constant )toaccount forthe observed 300-ps decay.
To
answer the questionif
indirect Cr-Cr Aips can pro-duce SD over the—
1-MHz wide line, we estimate theCr-Cr dipolar broadened width
of
the RI opticaltransi-tion. First consider the static dipolar broadening, kdp
(FWHM) in the ground state.
For
S
=
—'„we
have ap-proximatelyAd~=10(gB)
n/h.
For
0.
0034%
ruby, n=
1.
08 X10I8 ionsgcm3 givingLeLd
p 560kHz.
For
the optical transition, the effective magnetic gyromagnetic ratio is reduced from the1 CL h O tA JD C) O C) O 0 10 I I I 200 400 600 Pump-probe Separation (ps) 800
FIG.
9. Decay ofthe peak ofthe narrow hole following a 50-ps preparation pulse. Rabi frequency=
8.6 kHz. The dashed line isa regression analysis fittothe decay.TABLE
II.
A summary ofvarious relaxation times in dilute(0.0034Cr2O3 wt%) ruby at 2 Kand with a magnetic field of
-4
kGalong the crystal axis.Cr relaxation process
E
AuorescenceA~ spin lattice Optical (RI) dephasing'
Electron spin ( A2) dephasing
Resonant electron spin Aip'
Decay time (ps) 4200 5
X10'
15 7 2500 Al relaxation process Spin lattice Bulk dephasing' Frozen-core dephasing' 'Reference 38. "References 26 and 27. 'Reference 25.)
6X10'
50 1200ground-state value by the factor
(g,
„—
g,
)/(2gs,
)=0.
12,where
g,
„(g,
) are excited (ground-state) g values. Thisgives an optical dipolar width
of
0.
07 MHz&(
observed heterogeneous width. We conclude that Cr spin Gippingcannot explain the SD that leads to the narrow line
de-cay.
This leaves only the Cr-Al shf interactions which are further supported by the good agreement between
Endo's calculated heterogeneous width
of 1.
2 MHzversus the observed value
of
0.
8—1.
2MHz (Figs. 4—6).It
isnot clear
if
SD isdue to Aip-Hops in the Al frozen coreby,
e.
g., the mechanism suggested by Shakhmurotov orby Al spin Gipping in the bulk lattice. However, the fact that the narrow hole collapses into the wide one without appreciable broadening
of
the line suggests that the fre-quency jumps are && homogeneous width pointing tothe frozen core.OPTICAL HOLE BURNING AND SPECTRAL DIFFUSION IN RUBY 12313
A similar conclusion was reached by Boscaino et
al.
in their SDstudies
of
electron spin resonanceof
Cr + inruby. Also, recent photon-echo studies point tothe role
of
frozen-core dynamics in explaining in nonexponentialecho decay. Modeling
of
the various processes thatpro-duce optical dephasing and spectral diffusion ispresently in progress.
the observation time, must be less than the spectral diffusion time
if
correspondence isto be achieved between frequency- and time-domain derived hole widths. Theobserved spectral diffusion time
of
-300
ps
over awidthof
—
1 MHz ismainly determined by Al-nuclear-spin Aips in the host lattice, probably in the frozencore.
V. CONCLUSIONS ACKNOWLEDGMENTS
Our optical hole-burning studies in ruby show the preparation time is an important consideration in deter-mining the observed hole width. This time, together with
One
of
us (A.S.
) thanksR.
N.
Shakhmuratov for many interesting discussions. We thankJ.
Froemel for his ex-cellent technical assistance.'Present address: Institute ofPhysics, Tartu, Estonia.
~R. G. DeVoe and
R.
G. Brewer, Phys. Rev. Lett. 50, 1269(1983).
E.
Hanamura,J.
Phys. Soc. Jpn. 52, 3678(1983).M.Yamanoi and
J.
H.Eberly,J.
Opt. Soc.Am. B1,751(1984). 4J.Javanainen, Opt. Commun. 50,26(1984).5K.Wodkiewicz and
J.
H.Eberly, Phys. Rev.A32, 992 (1985).P.
R.
Berman andR.
G.Brewer, Phys. Rev.A32,2784(1985).7P.
R.
Berman,J.
Opt. Soc.Am. B3,564(1986); 3,572(1986).8A.
R.
Kessel,R.
N.Shakhmuratov, and L.D.Eskin, Zh. Eksp. Teor. Fiz. 94,202(1988) [Sov.Phys. JETP67,2071(1988)j.
P.A.Apanasevich, S. Ya.Kilin, and A.P.Nizovtsev,
J.
Appl.Spectrosc. 47, 1213 (1988).
A.
I.
Burshtein, A. A. Zharikov, and V. A.Malinovskii, Zh.Eksp. Teor. Fiz. 96, 2061 (1989)[Sov. Phys. JETP 69, 1164 (1989)1.
~
T.
Muramoto and A.Szabo, Phys. Rev. A 38,5928(1988). A.Szabo and
T.
Muramoto, Phys. Rev. A 39, 3992 (1989). A. Szabo,T.
Muramoto, andR.
Kaarli, in Coherence andQuantum Optics VI, edited by
J.
H.Eberly, L.Mandel, andE.
Wolf(Plenum, New York, 1990),pp. 1131—1135.
~4A.Szabo and
T.
Muramoto, Phys. Rev. A 37, 4040 (1988).~5A. Szabo, in Proceedings ofthe Tenth Vavilov Conference on
Nonlinear Optics (NOVA Science Publishers, New York, in
press).
R.
M. MacFarlane,R.
M.Shelby, andR.
L.Shoemaker, Phys.Rev.Lett. 43,1726(1979).
'
R.
L.Shoemaker andE.
W.Stryland,J.
Chem. Phys. 64, 1733 (1976).T.
Endo,T.
Muramoto, andT.
Hashi, Opt. Commun. 45, 122(1983).
J.
R.
Klauder and P. W. Anderson, Phys. Rev. 125, 912 (1962).20A.M. Portis, Phys. Rev.91,1070(1953). 2
T.
G.Castner, Phys. Rev.115,1506(1959).S.Clough and C.A. Scott,
J.
Phys. C 1,919(1968).~3M. Mehring, Principles
of
High Resolution NMR in Solids (Springer-Verlag, Berlin, 1983), p. 304.R.
Kubo, in Fluctuation, Relaxation and Resonance in Mag-netic Systems, edited by P.Ter Haar (Oliver and Boyd, Lon-don, 1962),p. 23.R.
Boscaino,F.
M.Gelardi, andR.
M.Mantegna, inStructure and Dynamicsof
Molecular Systems, edited byR.
Daudel et al.(Reidel, Dordrecht, 1985),p. 149.P.
F.
Liaoand S.R.Hartmann, Opt. Commun. S,310(1973).D.
R.
Taylor andJ.
P.Hessler, Phys. Lett.53A, 451(1975). 8R.F.
Wenzel, Phys. Rev.B1, 3109 (1970).29P.
E.
Jessop and A.Szabo, in Proceedingsof
the Fifth Interna tional Conference on Laser Spectroscopy, edited by A.R.
W. McKellar,T.
Oka, andB.
P.Stoiche6' (Springer-Verlag,Ber-lin, 1981),pp.408-411.
W.
B.
Mims, in Electron Paramagnetic Resonance, edited by S.Geschwind (Plenum, New York, 1972),pp. 263—351.
P. M. Seizer, D. S. Hamilton, and W. M. Yen, Phys. Rev. Lett. 3S,858(1977).
Y. S.Baiand M.
D.
Fayer, Phys. Rev.B39,11066(1989). 3R. M. Shelby andR.
M. MacFarlane,J.
Lumin. 314432,839(1984).
R.
G. DeVoe, A. Wokaun, S. C. Rand, andR.
G. Brewer, Phys. Rev.B23, 3125 (1981).J.
Huang,J.
M. Zhang, A. Lezama, andT.
W. Mossberg, Phys. Rev.Lett. 63,78(1989).W. Breinl,
J.
Friedrich, and D. Haarer,J.
Chem. Phys. S1, 3915 (1984).K.
A.Littau,Y.
S.Bai,and M.D.Fayer,J.
Chem. Phys. 92, 4145(1990).8A. Szabo,
T.
Muramoto, andR.
Kaarli, Phys. Rev.B42,7769 (1990).A.Szabo, Opt. Commun. 33, 301 (1980).
T.
Endo,T.
Muramoto, andT.
Hashi, Phys. Lett. 99A, 128(1983).
4~A.Szabo,
J.
Opt. Soc.Am. 3, 514 (1986).As discussed in A.Compaan, Phys. Rev. B5,4450 (1972),we
take the quasistatic width tobe —,the total dipolar width.
R.
N. Shakhmuratov, Pis'ma Zh. Eksp. Teor. Fiz. 51, 454 (1990)[JETPLett. 51, 513 (1990)].44J. Ganem, Y. P.Wang, D.Boye,
R.
S.Meltzer, W.M.Yen,R.
Wannemacher, and
R.
M. MacFarlane, Phys. Rev. Lett. 66,695(1991);
J.
Ganem,Y.
P.Wang,R.
S.Meltzer, and W.M.Yen, Phys. Rev.B43, 8599(1991).