Publisher’s version / Version de l'éditeur:
Vous avez des questions? Nous pouvons vous aider. Pour communiquer directement avec un auteur, consultez la première page de la revue dans laquelle son article a été publié afin de trouver ses coordonnées. Si vous n’arrivez pas à les repérer, communiquez avec nous à PublicationsArchive-ArchivesPublications@nrc-cnrc.gc.ca.
Questions? Contact the NRC Publications Archive team at
PublicationsArchive-ArchivesPublications@nrc-cnrc.gc.ca. If you wish to email the authors directly, please see the first page of the publication for their contact information.
https://publications-cnrc.canada.ca/fra/droits
L’accès à ce site Web et l’utilisation de son contenu sont assujettis aux conditions présentées dans le site LISEZ CES CONDITIONS ATTENTIVEMENT AVANT D’UTILISER CE SITE WEB.
Internal Report (National Research Council of Canada. Division of Building
Research), 1982-12-01
READ THESE TERMS AND CONDITIONS CAREFULLY BEFORE USING THIS WEBSITE.
https://nrc-publications.canada.ca/eng/copyright
NRC Publications Archive Record / Notice des Archives des publications du CNRC :
https://nrc-publications.canada.ca/eng/view/object/?id=e0e8d252-89e7-4e08-8149-3958c113cc01 https://publications-cnrc.canada.ca/fra/voir/objet/?id=e0e8d252-89e7-4e08-8149-3958c113cc01
NRC Publications Archive
Archives des publications du CNRC
For the publisher’s version, please access the DOI link below./ Pour consulter la version de l’éditeur, utilisez le lien DOI ci-dessous.
https://doi.org/10.4224/20338037
Access and use of this website and the material on it are subject to the Terms and Conditions set forth at
A statistical study of the thermal performance of a group of 1300
houses on the Canadian Prairies
NATIONAL RESEARCH COUNCIL OF CANADA
DIVISION OF BUILDING RESEARCH
DBR INTERNAL REPORT NO.
473A STATISTICAL
STUDY OF THE THERMAL PERFORMANCE OF
A GROUP OF 1300 HOUSES ON THE CANADIAN PRAIRIESby C.P. H e d l i n and M. B a n t l e
Chsdtsd by: Approved by:
L a w *
Gold oats: December, 1982Prepared for: Records P u r p o s e s
ABSTRACT
From d a t a on t h e consumption of n a t u r a l g a s and e l e c t r i c i t y i n 1300 h o u s e s i n Regina, l e a s t s q u a r e s a n a l y s i s d e t e r m i n e d t h e s l o p e - i n t e r c e p t r e l a t i o n s h i p between t h e e n e r g y e q u i v a l e n t of t h e n a t u r a l g a s consumed and t h e h e a t i n g degree-days f o r e a c h house, and t h e c o e f f i c i e n t of c o r r e l a t i o n i n e a c h c a s e . Energy r e q u i r e d f o r s p a c e h e a t i n g a s a f u n c t i o n of h o u s e s i z e v a r i e d from 0.4 MJ/m2DD f o r t h e s m a l l e s t h o u s e s t o 0.14 M J / ~ ~ D D f o r t h e l a r g e s t . I n t e n g r o u p s of n o m i n a l l y i d e n t i c a l h o u s e s ( t o t a l 3 5 2 ) , t h e e f f e c t of occupant b e h a v i o u r , c o n s t r u c t i o n v a r i a b i l i t y , changes s i n c e c o n s t r u c t i o n , o r i e n t a t i o n and c o l o r produced d e v i a t i o n s i n t h e s l o p e - i n t e r c e p t r e l a t i o n s h i p of l e s s t h a n 1 0 % i n 213, o r 20% i n 95% of t h e houses. The r e l a t i o n s h i p between n a t u r a l g a s consumption and h e a t i n g degree-days i s n e a r l y l i n e a r i n t h e h e a t i n g p e r i o d , b u t i s d i f f e r e n t i n t h e non-heating p e r i o d and i n t h e p e r i o d of i n t e r m i t t e n t h e a t i n g .
A
STATISTICAL STUDY
OF THE
TlWRHALPERFORMANCE OF
A
GROUP OF
1300 HOUSES OM TEE
CAUADIAN PRAIRIES
C.P. H e d l i n and M. B a n t l e
For h o u s e s on t h e Canadian p r a i r i e s , a major p a r t of t h e purchased e n e r g y shows up a s s p a c e h e a t t h a t i s needed t o b a l a n c e h e a t l o s s through w a l l s , windows, roof and f l o o r s d u r i n g t h e h e a t i n g season. Some of t h i s comes a s t h e by-product of l i g h t i n g , cooking, d o m e s t i c w a t e r h e a t i n g , r e f r i g e r a t o r s o r f r e e z e r s . A major p a r t of i t i s provided by t h e f u r n a c e s p e c i f i c a l l y f o r s p a c e h e a t i n g . I n a d d i t i o n t o t h a t o b t a i n e d from
purchased e n e r g y , h e a t a l s o comes from o c c u p a n t s and from t h e sun.
I n any g i v e n h o u s e , such f a c t o r s as occupancy l e v e l s and l i f e s t y l e a f f e c t energy consumption f o r s p a c e h e a t i n g ; however, t h e s i z e of t h e house and i t s h e a t l o s s c h a r a c t e r i s t i c s a r e t h e main f a c t o r s a f f e c t i n g s p a c e h e a t i n g needs. L a b o r a t o r y measurements of t h e t h e r m a l p r o p e r t i e s of components, combined w i t h c a l c u l a t i o n p r o c e d u r e s , a r e s t a n d a r d methods of a r r i v i n g a t h e a t l o s s e s t i m a t e s . These r e q u i r e t h e u s e of a p p r o x i m a t i o n s and c a n n o t t a k e i n t o a c c o u n t t h e e f f e c t s of d i f f e r e n c e s i n c o n s t r u c t i o n and occupancy.
I n some c a s e s , measuring i n s t r u m e n t s c a n be employed t o g a i n i n f o r m a t i o n . However, t h e time and e f f o r t r e q u i r e d l i m i t t h e number of such measurements t h a t c a n be made.
L a b o r a t o r y and f i e l d i n s t r u m e n t a l measurements c a n b e extended a n d , i n some c a s e s , t h e i r v a l i d i t y t e s t e d , by u s i n g t h e t o t a l measured e n e r g y consumptions. l s 2 Where t h e s e v a l u e s a r e measured by u t i l i t y companies,
t h e y may c o v e r a l l of t h e purchased e n e r g y , u n l e s s f i r e p l a c e s o r wood- b u r n i n g s t o v e s a r e used. The i n t e r a c t i o n of many f a c t o r s means t h a t i t i s d i f f i c u l t t o i d e n t i f y some s p e c i f i c e f f e c t s ; t h e l i m i t a t i o n s of such a n a l y s e s must be r e c o g n i z e d and t h e y s h o u l d n o t be e x p e c t e d t o r e v e a l i n f o r m a t i o n a b o u t e f f e c t s t h a t a r e t o o h e a v i l y masked t o b e i d e n t i f i a b l e .
Analyses based on purchased e n e r g y might be d i v i d e d i n t o two
c a t e g o r i e s : t h o s e i n v o l v i n g i n d i v i d u a l h o u s e s and t h o s e i n v o l v i n g g r o u p s of houses. The p r e s e n t s t u d y f a l l s i n t o t h e l a t t e r c a t e g o r y . The
a n a l y s e s a r e s t a t i s t i c a l . A s a r e s u l t , t h e c o n c l u s i o n s a r e drawn f o r p o p u l a t i o n s of h o u s e s and a r e e x p r e s s e d i n terms of p r o b a b i l i t y r a t h e r
t h a n i n t h e p r e c i s e numbers o f t e n a s s o c i a t e d w i t h h e a t b a l a n c e e s t i m a t e s f o r i n d i v i d u a l houses.
T h i s s t u d y i n v o l v e s d a t a from h o u s e s i n which n a t u r a l g a s i s used f o r s p a c e h e a t i n g and, n o r m a l l y , f o r d o m e s t i c w a t e r h e a t i n g , and
e l e c t r i c i t y f o r a l l o t h e r e n e r g y needs. N a t u r a l g a s and e l e c t r i c a l consumption d a t a were p r o v i d e d by t h e Saskatchewan Power C o r p o r a t i o n f o r
about 1340 homes i n t h e c i t y of Regina. Between 20 and 60 r e a d i n g s were a v a i l a b l e f o r e a c h house f o r t h e p e r i o d 1969-77. I n f o r m a t i o n a b o u t t h e s i z e and shape, and some c o n s t r u c t i o n d e t a i l s f o r t h e s e homes was
provided by t h e c i t y of Regina A s s e s s o r ' s O f f i c e .
The y e a r of c o n s t r u c t i o n r a n g e s from 1911 t o 1973; main f l o o r a r e a (MFA) ranged from a b o u t 33 m2 t o 156 m 2 , t o t a l f l o o r a r e a of t h e h e a t e d s p a c e (TFA) from 50 m2 t o 430 m 2 , and h e i g h t from 1 t o 23 s t o r i e s . Most of t h e houses had f u l l basements b u t some had only p a r t i a l basements o r none a t a l l . Those w i t h no basement were b u i l t o v e r c r a w l s p a c e s o r were s lab-on-grade homes.
I n s u l a t i o n l e v e l s v a r i e d . Before 1930 most houses were b u i l t w i t h no i n s u l a t i o n , though i t would have been added t o many of them l a t e r . Those b u i l t between 1945 and 1973 would i n i t i a l l y have had no basement i n s u l a t i o n ; w a l l s would normally have R7
-
R10 i n s u l a t i o n b u i l t i n t o them, and approximately R10 i n s u l a t i o n would have been p l a c e d i n c e i l i n g s .Heat balance r e l a t i o n s h i ~ s
Fuel consumption v a r i e s w i t h t h e weather. I n t h i s s t u d y , h e a t i n g degree-days a r e used t o r e p r e s e n t t h e weather v a r i a b l e . It i s e x p r e s s e d i n terms of t e m p e r a t u r e T:
where
day
i s t h e average number of h e a t i n g days/day f o r t h e p e r i o d of o b s e r v a t i o n . T i s e q u a l t o t h e o u t s i d e t e m p e r a t u r e (Ta) e x c e p t f o r p e r i o d s t h a t i n c l u d e days having mean t e m p e r a t u r e s g r e a t e r t h a n 18°C. For v a l u e s of T below 15°C t h e d i f f e r e n c e between T and Ta a v e r a g e s l e s s t h a n 0.5 "C ( F i g u r e 1 ) .The h e a t e q u i v a l e n t of t h e f u e l consumption (EG) c a n b e expressed:
The h e a t e q u i v a l e n t of t h e n a t u r a l g a s i s assumed t o b e 3.73
w/m3
(1000 B T U / ~ ~ ~ ) . IG and SG a r e t h e o r d i n a t e i n t e r c e p t (MJ/day) and s l o p e (MJ/OC) r e s p e c t i v e l y . The s u b s c r i p t G i s used t o d e n o t e n a t u r a l gas. R e s u l t s shown f o r one house i n F i g u r e 2 r e p r e s e n t n a t u r a l g a s and e l e c t r i c i t y consumption o v e r a p e r i o d of about two y e a r s .I n F i g u r e 3 , h e a t i n p u t s from o t h e r s o u r c e s a r e combined with t h e h e a t e q u i v a l e n t of t h e n a t u r a l g a s and p l o t t e d a g a i n s t T.
ED
r e p r e s e n t st h e sum of h e a t i n p u t s from occupants (Eo) e l e c t r i c i t y (EE) and t h e sun (ESR). The g r a p h i s completed by s t a c k i n g EG on t o p of
ED
( t h u s t h e l i n e ETO t = EG+
ED i n F i g u r e 3a). When t h e u s e f u l p a r t of t h e h e a t from t h e *Throughout t h i s r e p o r t energy q u a n t i t i e s a r e e x p r e s s e d a s d a i l y t o t a l s .w a t e r h e a t i n g s y s t e m (Ew) i s added t o E t h e t o t a l m i s c e l l a n e o u s h e a t (EM) i s o b t a i n e d . The h e a t e q u i v a l e n t o f ' t h e f u e l s u p p l i e d t o t h e f u r n a c e i s shown (EF) i n F i g u r e 3a.
I n F i g u r e 3b t h e e s t i m a t e d h e a t l o s s [EST = 125
+
19.3 (18-
T) MJ/day] i s added t o complete t h e h e a t b a l a n c e diagram.It i s assumed t h a t t h e e n e r g y consumption f o r w a t e r h e a t i n g d o e s n o t v a r y s i g n i f i c a n t l y t h r o u g h o u t t h e y e a r . It i s f u r t h e r assumed t h a t a f i x e d f r a c t i o n of t h a t h e a t i s c o n v e r t e d i n t o s p a c e h e a t and t h a t t h e r e m a i n d e r ( ) i s l o s t . Each of t h e h e a t i n p u t s c a n b e r e p r e s e n t e d i n degree-days u s i n g t h e r e l a t i o n s h i p t h e n f o r t h e m i s c e l l a n e o u s components ( e x c l u d i n g h o t w a t e r ) The t o t a l h e a t i n p u t t o t h e h o u s e a n d From E q u a t i o n 2 , and from E q u a t i o n
5 ,
I n t h i s r e p o r t STot and SG a r e c a l l e d t h e h e a t i n p u t and f u e l
consumption c o e f f i c i e n t s r e s p e c t i v e l y . T h e o r e t i c a l l y a t l e a s t , t h e y a r e i n d e p e n d e n t of t h e i n t e r i o r t e m p e r a t u r e of t h e house. F u r t h e r r e g a r d i n g f u e l c o n s m e d i n t h e f u r n a c e ( E p ) : where SF i s t h e f u r n a c e consumption c o e f f i c i e n t . SG i s a p p r o x i m a t e l y e q u a l t o t h e h e a t i n p u t c o e f f i c i e n t (STot) and t h e f u r n a c e consumption c o e f f i c i e n t (SF). For t h i s r e a s o n , SG i n t h i s r e p o r t i s t a k e n t o be a measure of t h e t h e r m a l b e h a v i o r of h o u s e s and i s u s e d f o r t h a t purpose.
This study comprises two areas of analysis:
I. The nature of the linear fuel consumption
-
heating degree-day
relationship [EG
=IG
+
SG (18
-
T)] (fuel consumption means all of the
natural gas used).
a. The continuity and linearity of fuel consumption
-
degree-day
plots,
h. The coefficients of correlation of fuel consumption
-
degree-day
relationships for houses,
c. The uncertainty of slope of the fuel consumption
-
degree-day
relationship.
TI. Factors affecting fuel consumption:
a.
Size of house,
b.
Differences in the fuel consumption coefficient (SG) for
nominally identical houses.
FUEL
COUSUHPTIOB
-
HEATIBG DEGREE-DAY RBLATIOBSHIP
The continuity and linearity of fuel consumption
-
degree-day
relationship
The year may be divided into three parts: the heating season, in
which furnace heat is required continuously; the non-heating season, in
which no furnace heat is required; and a transition period in which
furnace heat is required intermittently. These differences in heating
requirements and other seasonal effects would be expected to produce
discontinuity, or at least non-linearity in the fuel consumption
-
degree-day relationship. Such plots usually show a generally linear
distribution, but the data for individual houses are usually too sparse
and too scattered to permit firm conclusions to be drawn about linearity.
However, statistical analysis using data for a group of houses allows the
use of a large number of points and averaging to get a more precise
picture of a general relationship.
For the equation
IG and SG can be found by least squares analysis.
It is necessary to distinguish between measured energy consumption
(EG) and predicted consmption
(Ep). For the first, the relationship
might b e more p r o p e r l y w r i t t e n a s a n approximat ion:
w h i l e E p = IG (18
-
T).
E q u a t i o n 2 c a n b e m o d i f i e d t o r e a d
where E is a c o r r e c t i o n t o t h e observed h e a t i n g degree-days needed t o
make t h e o b s e r v e d energy consumption c o i n c i d e w i t h t h e p r e d i c t e d v a l u e .
The n a t u r e of E a s an a v e r a g e f o r a group of h o u s e s was s t u d i e d
u s i n g d a t a f o r 2 3 f u l l basement bungalows b u i l t i n t h e 1960's.
was found f o r e a c h of a p p r o x i m a t e l y 1000 d a t a p o i n t s . These were averaged o v e r 1 ° C i n t e r v a l s f o r 1 8 > T
'
8 and o v e r 2°C i n t e r v a l s f o r 8 > T and were p l o t t e d a g a i n s t 18-
T =day day
i n F i g u r e 4. ForT = 17.5
e
i s approximately +0.5"C. I n t h e r e g i o n T>
10, t h e d i f f e r e n c e between t h e observed and t h e p r e d i c t e d r e l a t i o n s h i p r e a c h e s a maximum a t T=
l l ° C , where E = - l ° C , a n e r r o r of a b o u t 25% ( d o t t e d l i n e ) . Suchd e v i a t i o n , assuming t h a t i t i s r e a l , would c o r r e s p o n d t o a s p a c e h e a t i n g r e q u i r e m e n t which i s less t h a n t h a t p r e d i c t e d by h e a t i n g d e g r e e d a y s . For T < 9OC t h e r e i s some e v i d e n c e of d e v i a t i o n i n t h e o t h e r d i r e c t i o n . The n e g a t i v e v a l u e of E f o r T >
9
and t h e p o s i t i v e v a l u e of E f o r T < 9 would seem t o c o r r e s p o n d t o a change i n f u e l demand f o r s p a c e h e a t i n g .I n t h e f o l l o w i n g a n a l y s i s a l l of t h e d a t a p o i n t s were used; no a t t e m p t was made t o e x c l u d e summer v a l u e s .
The p e r i o d s covered were of unequal l e n g t h , r a n g i n g from 30 d a y s t o a s l o n g a s 250 d a y s i n i s o l a t e d c a s e s , and a v e r a g i n g a b o u t 65 days. If t h e l o n g e r t e s t p e r i o d i s d e s i r e d t o produce a more a c c u r a t e d a t a p o i n t , t h e n w e i g h t i n g i n p r o p o r t i o n t o t h e l e n g t h o f p e r i o d would be
a p p r o p r i a t e . T h i s q u e s t i o n was n o t i n v e s t i g a t e d h e r e o t h e r t h a n t o compare i n t e r c e p t s , s l o p e s and c o e f f i c i e n t s of c o r r e l a t i o n , u s i n g d a t a f o r 15 h o u s e s , and a n a l y s i n g b o t h ways ( i . e . d a t a p o i n t s weighted i n d i r e c t p r o p o r t i o n t o t h e time span, and p o i n t s n o t w e i g h t e d ) . The a v e r a g e s of t h e i n t e r c e p t s , s l o p e s and c o e f f i c i e n t s of c o r r e l a t i o n f o r weighted and unweighted r e s u l t s d i f f e r e d by 1.7, 0.1, and 0.3% of t h e mean v a l u e s r e s p e c t i v e l y . However, f o r i n d i v i d u a l c a s e s t h e r e a r e more
s i g n i f i c a n t d i f f e r e n c e s . Maximum d i f f e r e n c e s i n i n t e r c e p t , s l o p e and c o e f f i c i e n t of c o r r e l a t i o n were 20,6 and 3% r e s p e c t i v e l y . Using t h e same sequence, s t a n d a r d d e v i a t i o n s were 12.5, 2.5 and 1.0% of t h e mean v a l u e s .
Weighting was used i n a l l c a s e s i n t h i s p a p e r e x c e p t f o r t h e d a t a i n F i g u r e 2.
Amount of v a r i a t i o n i n f u e l c o n s u m ~ t i o n a c c o u n t e d f o r bv h e a t i n g degree-days
The r e l i a b i l i t y of t h e s e l e a s t s q u a r e s r e l a t i o n s h i p s i n d e s c r i b i n g t h e f u e l consumption o f h o u s e s depends o n how much of t h e v a r i a t i o n i n e n e r g y consumption i s a c c o u n t e d f o r by t h e h e a t i n g degree-day p a r a m e t e r . Measures of t h i s a r e g i v e n by t h e c o e f f i c i e n t of c o r r e l a t i o n ( r ) and t h e c o e f f i c i e n t of d e t e r m i n a t i o n s ( r 2 ) .
C o e f f i c i e n t s of c o r r e l a t i o n were c a l c u l a t e d f o r a number of h o u s e s . F i g u r e 5 , which i s b a s e d o n results f o r 571 h o u s e s of a l l s t y l e s and a g e s , shows t h a t f o r a p p r o x i m a t e l y 26% of t h e h o u s e s t h e c o e f f i c i e n t of c o r r e l a t i o n was a b o u t 0.99, f o r 75% of them i t exceeded 0.95 and f o r 90% i t exceeded 0.90. The c o e f f i c i e n t o f d e t e r m i n a t i o n i s d e f i n e d a s t h e f r a c t i o n of v a r i a n c e ( v a r i a t i o n ) t h a t i s e x p l a i n e d by t h e r e l a t i o n s h i p . A s c a l e f o r c o e f f i c i e n t of d e t e r m i n a t i o n i s g i v e n a t t h e t o p of F i g u r e 5. T h i s i n d i c a t e s t h a t t h e r e l a t i o n s h i p e x p l a i n e d 80% of t h e v a r i a t i o n i n a b o u t 92% of t h e c a s e s , and 90% of t h e v a r i a t i o n i n 75% of t h e c a s e s ; t h e r e m a i n i n g v a r i a t i o n presumably c o u l d b e d u e t o a l l o t h e r e f f e c t s .
No s p e c i a l e f f o r t was made t o d e t e r m i n e t h e c a u s e of low
c o r r e l a t i o n s . I n a few c a s e s t h e r e a s o n was a p p a r e n t ; swimming p o o l s may r e q u i r e a g r e a t d e a l of h e a t and s o d i s t o r t t h e e n e r g y consumption
-
degree-day r e l a t i o n s h i p t h a t i t becomes u n u s a b l e a s a measure o f h o u s e t h e r m a l performance. U n c e r t a i n t y i n t h e f u e l consumption c o e f f i c i e n t ( S G ) The n a t u r a l g a s-
degree-day r e l a t i o n s h i p i n F i g u r e 2 h a s a r e g r e s s i o n c o e f f i c i e n t ( s l o p e ) of 23.08 MJ/DD, a n i n t e r c e p t o f 161 MJ/day, and a c o r r e l a t i o n c o e f f i c i e n t of 0.980. F u r t h e r , t h e 99% c o n f i d e n c e i n t e r v a l f o r t h e s l o p e i s g i v e n by 23.08'
2.19 MJ/DD,i . e . t h e r e i s a 1% chance t h a t t h e s l o p e would d i f f e r from t h e c a l c u l a t e d v a l u e by a s much a s 2.19 M J / D D . The 90% c o n f i d e n c e i n t e r v a l i s g i v e n by 23.08 2 1.33 M J / D D . ~
Ninety-nine p e r c e n t c o n f i d e n c e i n t e r v a l s f o r s l o p e s were computed by t h e a n a l y s i s of d a t a f o r 400 h o u s e s o f a l l s t y l e s , b u i l t a f t e r 1945. These v a l u e s were used t o c a l c u l a t e t h e h a l f - w i d t h s o f t h e c o n f i d e n c e bands a s a p e r c e n t a g e o f t h e c a l c u l a t e d s l o p e . The f r e q u e n c y c u r v e peaks a t a b o u t 99%, b u t i t i s skewed and t h e mean v a l u e i s a p p r o x i m a t e l y 10%
( F i g u r e 6 ) .
S e v e r a l o t h e r f e a t u r e s of t h i s method of r e l a t i n g e n e r g y consumption t o h e a t i n g degree-days m i g h t b e mentioned. The r e l i a b i l i t y o f i n d i v i d u a l p o i n t s w i l l v a r y w i t h t h e s p a n of t i m e t h a t may n o t b e d i r e c t l y a c c o u n t e d f o r by h e a t i n g degree-days, b u t may b e more a f f e c t e d by s o l a r r a d i a t i o n and wind. However, i t would b e d i f f i c u l t t o a s s i g n a v a l u e t o t h i s a v e r a g i n g e f f e c t .
I n t h i s s t u d y , a r a t h e r l a r g e number of d a t a p o i n t s , c o v e r i n g a number of y e a r s , was a v a i l a b l e f o r e a c h house. When t h e method i s u s e d
t o a s s e s s house performance, i t must be done o v e r a much s h o r t e r t i m e p e r i o d . F u r t h e r a n a l y s i s would b e needed t o b e t t e r e v a l u a t e t h e a c c u r a c y of t h e method, b u t e x p e r i e n c e s u g g e s t s t h a t r e a s o n a b l e i n d i c a t i o n s can be o b t a i n e d even o v e r s h o r t p e r i o d s ( e . g . , h a l f a y e a r o r a y e a r ) a s l o n g a s b o t h warm- and cold-weather r e s u l t s a r e o b t a i n e d .
FACTORS
AFFECTIBG FUEL COHSUMPTIOBJ FOR SPACE
EEATIRJGS e v e r a l s e t s of v a r i a b l e s may a f f e c t f u e l consumption f o r s p a c e h e a t i n g . One s e t i n c l u d e s s i z e , s h a p e a n d s t y l e , e . g . , s i n g l e s t o r e y ,
two s t o r e y o r s p l i t l e v e l . A second s e t i n c l u d e s f a c t o r s s u c h a s o r i e n t a t i o n , occupancy and c o l o r . The most i m p o r t a n t v a r i a b l e s a r e t h e r m a l i n s u l a t i o n and a i r t i g h t n e s s . I n t h i s s t u d y of s i z e e f f e c t , t h e i r i n f l u e n c e s w i l l b e n u l l i f i e d u n l e s s t h e r e e x i s t s a s i z e - t h e r m a l p r o p e r t y dependence f o r t h e h o u s e s . T h i s c o u l d n o t be d e t e r m i n e d w i t h any c e r t a i n t y .
House s i z e and s t y l e
S e v e r a l d i f f e r e n t measures of house s i z e might be used. These i n c l u d e volume, e x t e r i o r s u r f a c e a r e a a n d f l o o r a r e a . None i s i d e a l . A c t u a l l y t h e y a r e f a i r l y c l o s e l y r e l a t e d t o one a n o t h e r . The r a t i o o f volume t o t o t a l f l o o r a r e a i s a p p r o x i m a t e l y e q u a l t o c e i l i n g h e i g h t o r f l o o r - t o - f l o o r h e i g h t . Apart from c a t h e d r a l c e i l i n g s and a few o t h e r s p e c i a l c a s e s , c e i l i n g h e i g h t s i n t h e k i n d of h o u s e i n t h i s s t u d y would r a n g e from a b o u t 2.3 t o 2.45 m , a d i f f e r e n c e of a b o u t 6%.
It s h o u l d be n o t e d t h a t t h e t e r m ' f l o o r a r e a ' i s u s e d l o o s e l y h e r e . The s i z e s a r e b a s e d o n e x t e r i o r measurements. Thus o c c u p i a b l e f l o o r a r e a i s l e s s t h a n t h e i n d i c a t e d amount by a q u a n t i t y a p p r o x i m a t e l y e q u a l t o t h e p r o d u c t of p e r i m e t e r and w a l l t h i c k n e s s . The e x t e r i o r measurement h a s been used b e c a u s e i t i s t h e normal way of e x p r e s s i n g house s i z e i n
t h i s r e g i o n .
The r e l a t i o n s h i p between e x t e r i o r s u r f a c e a r e a and f l o o r a r e a f o r most h o u s e s c a n b e e x p r e s s e d a p p r o x i m a t e l y a s
Ext. S u r f . a r e a = P x H x of f l o o r s
+
2 MFA ( 1 4 ) where P i s t h e p e r i m e t e r of t h e house (m),H
i s t h e f l o o r - t o - f l o o r h e i g h t(m) and MFA i s t h e p l a n area (m2).
I n t h e s e h o u s e s , p e r i m e t e r b e a r s a f a i r l y c l o s e r e l a t i o n s h i p t o p l a n a r e a . An a n a l y s i s w a s done on 106 h o u s e s of d i f f e r e n t f l o o r a r e a a n d / o r p e r i m e t e r , i n c l u d i n g a l l t h e s t y l e s mentioned p r e v i o u s l y ( F i g u r e
7).*
*Because of e r r o r s i t i s p o s s i b l e t h a t some of t h e h o u s e s were of t h e same d e s i g n , even though t h e d a t a s u g g e s t e d t h a t t h e y were d i f f e r e n t .
These came from a g r o u p of 742 post-1945 h o u s e s . The r e l a t i o n s h i p between p e r i m e t e r and p l a n a r e a , o b t a i n e d by l e a s t s q u a r e s f i t t i n g i s
P
= 17.3+
0.24MFA
w i t h a s t a n d a r d e r r o r of e s t i m a t e e q u a l t o 1.9 m , o r 4.8% of t h e a v e r a g e p e r i m e t e r . S t a t i s t i c a l l y , E q u a t i o n 8 s h o u l d a p p l y w i t h i n 4.8% f o r 68% of t h e houses and w i t h i n 9.6% f o r 95% of t h e houses. The g r o u p i n F i g u r e 7 i n c l u d e s f o u r h o u s e s t h a t s t a n d a p a r t from t h e o t h e r s . T h e i r p e r i m e t e r s exceed t h e a v e r a g e f o r t h e i r s i z e by 12 t o 25%. Each o f them was t h e o n l y h o u s e of i t s k i n d . I f t h e y a r e e x c l u d e d , t h e s t a n d a r d e r r o r of e s t i m a t e d r o p s t o 2.6%.
P
= 18.0+
0.23MFA
( 1 6 ) The two terms on t h e r i g h t s i d e of E q u a t i o n 14 a r e a p p r o x i m a t e l y e q u a l f o r bungalows, i . e . t w i c e t h e p l a n a r e a i s a p p r o x i m a t e l y e q u a l t o t h e t o t a l w a l l a r e a . T h e r e f o r e i f E q u a t i o n 15 was used a s a n a p p r o x i m a t e v a l u e of P i n E q u a t i o n 14, t h e r e i s a 68% c h a n c e t h a t t h e e r r o r i ns u r f a c e a r e a r e s u l t i n g from t h i s a p p r o x i m a t i o n would be l e s s t h a n 2.4%
and a 95% c h a n c e t h a t i t would b e l e s s t h a n 4.8%.
I n t h e p r e s e n t c a s e t o t a l f l o o r a r e a i s used a s t h e measure of house s i z e . It i s a widely recognized measure and, a s shown above, b e a r s a f a i r l y c l o s e r e l a t i o n s h i p t o e n v e l o p e area. The l a t t e r i s i m p o r t a n t s i n c e h e a t l o s s e s and g a i n s o c c u r t h r o u g h i t . It i s n o t t h e purpose o f t h i s s t u d y t o d e a l w i t h t h e d e t a i l e d s u r f a c e a r e a
-
t h e r m a l r e s i s t a n c e v a l u e s u s e d i n h e a t b a l a n c e s t u d i e s . I n t h i s s t u d y o n l y a v e r y l i m i t e d amount of i n f o r m a t i o n a b o u t t h e t h e r m a l p r o p e r t i e s of t h e e n v e l o p e was a v a i l a b l e ; i t s p u r p o s e i s t o i n v e s t i g a t e o t h e r q u e s t i o n s . For t h e s t u d y of t h e e f f e c t of s i z e t h e houses w e r e d i v i d e d i n t o f i v e d i f f e r e n t g r o u p s b a s e d o n s t y l e . Among h o u s e s b u i l t i n 1945 o r l a t e r , 975 were i n c l u d e d i n t h i s p a r t of t h e s t u d y : 1. 640 s i n g l e s t o r e y houses w i t h f u l l b a s e m e n t s ,2. 81 houses w i t h more t h a n one b u t l e s s t h a n two s t o r e y s and w i t h f u l l basements,
3. 79 h o u s e s o f two o r more s t o r e y s w i t h f u l l b a s e m e n t s ,
4. 96 s p l i t l e v e l h o u s e s ,
5. 79 s i n g l e s t o r e y houses w i t h no basements.
Fuel consumption c o e f f i c i e n t s
(SG) f o r two s t o r e y , f u l l basement
houses a r e p l o t t e d a g a i n s t t o t a l f l o o r a r e a ( F i g u r e 8 ) . V a l u e s f o r h o u s e s of t h e same model were averaged t o produce a s i n g l e p o i n t . 'Lttus e a c h p o i n t r e p r e s e n t s one o r more h o u s e s of a g i v e n model. I n s p i t e of t h e s c a t t e r , t h e p l o t d e m o n s t r a t e s a n upward t r e n d w i t h i n c r e a s i n g s i z e .To r e d u c e t h e s c a t t e r , f i v e o r more p o i n t s were a v e r a g e d t o produce a s i n g l e v a l u e . n e s e a v e r a g e v a l u e s a r e a l s o shown i n F i g u r e 8.
T h i s a v e r a g i n g was a l s o done f o r t h e o t h e r s t y l e s of h o u s e s l i s t e d above. The combined r e s u l t s a r e shown i n F i g u r e 9. T h i s g i v e s a
c u r v i l i n e a r p l o t w i t h s l o p e s t h a t v a r y from a b o u t 21 W / D D f o r h o u s e s w i t h a t o t a l f l o o r a r e a of 50 m2 t o 50 M J / D D a t 350 m2.
Data were a v a i l a b l e f o r o t h e r g r o u p s of houses which w e r e n o t used i n p r e p a r i n g F i g u r e 9
but
a r e superimposed o n i t . These i n c l u d e h o u s e s b u i l t b e f o r e 1945 and d u p l e x e s . A l l had f u l l basements. It a p p e a r s t h a t o n a v e r a g e t h e h o u s e s of a l l t y p e s , b u i l t between 1911 and 1932, had s l o p e v a l u e s r o u g h l y 25% g r e a t e r t h a n t h o s e on t h e main c u r v e .C o n s m p t i o n s / d e g r e e d a y f o r d u p l e x e s were s u b s t a n t i a l l y l e s s t h a n t h e a v e r a g e f o r o t h e r h o u s e s of c o r r e s p o n d i n g s i z e .
The c u r v e t h r o u g h t h e p o i n t s i n F i g u r e 9 was used t o p r e p a r e a second c u r v e (SG/A, s c a l e o n r i g h t s i d e of f i g u r e ) . T h i s g i v e s t h e f u e l c o n s m p t i o n c o e f f i c i e n t / u n i t a r e a , d e g r e e d a y v e r s u s a r e a . This shows v a l u e s f a l l i n g s h a r p l y from about 0.42 M J / ~ ~ D D f o r 50 m2 t o 0.15 M J / m 2 D ~ f o r h o u s e s 200 m2 o r l a r g e r .
V a r i a t i o n i n f u e l consumption f o r n o m i n a l l y i d e n t i c a l h o u s e s
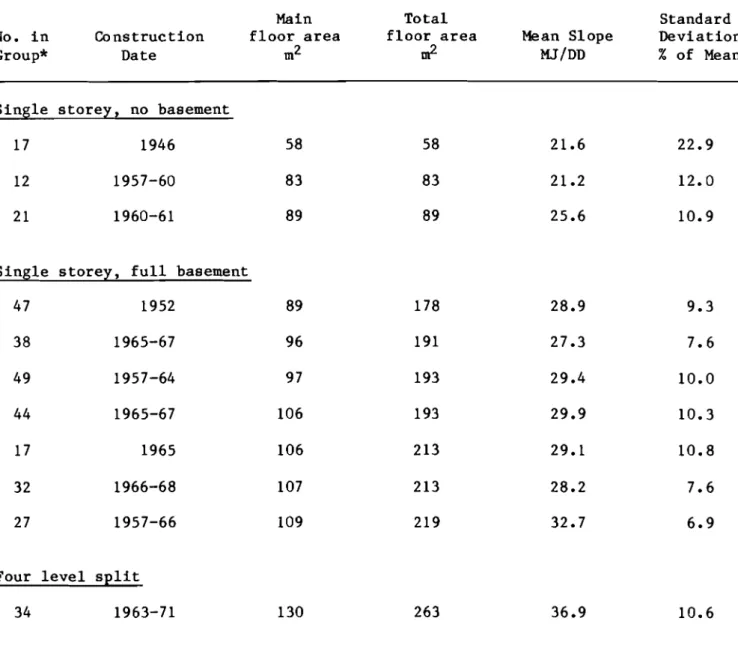
The d a t a i n c l u d e v a l u e s f o r a number of g r o u p s o f h o u s e s of t h e same model. These were c o n s t r u c t e d a c c o r d i n g t o t h e same p l a n s , n e v e r t h e l e s s would have somewhat d i f f e r e n t t h e r m a l performances due t o d i f f e r e n c e s i n e x p o s u r e , o r i e n t a t i o n , c o l o r , q u a l i t y of c o n s t r u c t i o n , owner management and changes made by t h e owners a f t e r p u r c h a s e , s u c h a s basement f i n i s h i n g and a d d i t i o n a l i n s u l a t i n g . 4 It i s t o b e e x p e c t e d t h a t f u r n a c e e f f i c i e n c y would a l s o v a r y from house t o house. A s i n d i c a t e d e a r l i e r , s t a t i s t i c a l u n c e r t a i n t y a b o u t t h e s l o p e i n t r o d u c e s a n o t h e r v a r i a b l e . For e l e v e n s u c h g r o u p s , of 12 t o 49 h o u s e s , t h e s l o p e s were found f o r e a c h house. The means a n d s t a n d a r d d e v i a t i o n s of t h e s l o p e s were computed f o r e a c h g r o u p
(Table 1 )
.
F i n a l l y t h e d a t a f o r s e v e r a l of t h e above g r o u p s , comprising 141 h o u s e s , were a n a l y s e d . The s l o p e f o r e a c h h o u s e was found a s a f r a c t i o n of t h e mean f o r i t s group. These f r a c t i o n s were used t o p r e p a r e t h e
f r e q u e n c y d i s t r i b u t i o n p l o t i n F i g u r e 10.
Table 1 shows t h a t t h e s t a n d a r d d e v i a t i o n i n s l o p e s r a n g e s from a low of 6.9% t o a h i g h of 22.9% and a v e r a g e s approximately 11% (10% i f t h e 22.9% group i s e x c l u d e d ) . T h i s would s u g g e s t t h a t d e v i a t i o n s i n SG (from t h e mean f o r t h e group) due t o t h e f a c t o r s l i s t e d above ( d i f f e r e n c e s i n e x p o s u r e , q u a l i t y of c o n s t r u c t i o n e t c . ) were l e s s t h a n
+
10 o r 11% i n a b o u t 213 of t h e h o u s e s and less t h a n a b o u t '20% f o r 95% of t h e houses. S i m i l a r l y i n - F i g u r e 10, a p p r o x i m a t e l y 213 of t h e h o u s e s would f a l l i n t h es~
r a n g e 0.9 <
,
< 1.1. XS t u d i e s u s i n g r e c o r d s of consumption f o r n a t u r a l g a s and e l e c t r i c i t y were c a r r i e d o u t o n a p p r o x i m a t e l y 1400 h o u s e s of a l l s t y l e s , r a n g i n g i n s i z e from about 45 t o 400 m2 t o t a l f l o o r a r e a . Slope i n t e r c e p t
r e l a t i o n s h i p s between e l e c t r i c i t y and n a t u r a l g a s consumption and h e a t i n g degree-days were found f o r e a c h house. From a n a l y s i s of t h e s e d a t a t h e f o l l o w i n g c o n c l u s i o n s were reached.
1. The r e l a t i o n s h i p between t h e e n e r g y e q u i v a l e n t of n a t u r a l g a s consumption and h e a t i n g degree-days i s e x p r e s s e d h e r e a s
E~ = I G
+
SG ( ~ D D / d a y ) . It i s n e a r l y l i n e a r f o r many houses. 2. The s l o p e of t h i s r e l a t i o n s h i p , (SG, t h e f u e l consumptionc o e f f i c i e n t ) i s a p p r o x i m a t e l y e q u a l t o t h e c o e f f i c i e n t g i v e n by t h e s l o p e o f t o t a l h e a t i n p u t v e r s u s degree-days (STot) and a l s o t o t h e s l o p e of t h e r e l a t i o n s h i p between f u e l i n p u t t o t h e f u r n a c e and h e a t i n g d e g r e e - d a y s
(%).
T h e r e f o r e SG i s a u s e f u l measure of t h e r m a l performance of t h e house. 3. The r e l i a b i l i t y of SG depends i n p a r t on i t s s t a t i s t i c a l u n c e r t a i n t y . For 400 h o u s e s , t h i s u n c e r t a i n t y a t t h e 99% l e v e l of c o n f i d e n c e averaged a b o u t 10%. 4. The c o e f f i c i e n t s of c o r r e l a t i o n f o r t h e n a t u r a l g a s consumption-
h e a t i n g degree-day d a t a f o r i n d i v i d u a l h o u s e s v a r i e dwidely. For a p p r o x i m a t e l y 90% of t h e houses i t exceeded 0.90; f o r 50% i t exceeded 0.975.
5. SG i n c r e a s e s w i t h i n c r e a s i n g house s i z e i n a c u r v i l i n e a r
f a s h i o n , r a n g i n g from a b o u t 21 W / D D f o r h o u s e s w i t h a t o t a l f l o o r a r e a of 50 rn2, t o 50 W / D D f o r houses w i t h a t o t a l f l o o r a r e a of 350 m2.
6. For groups of nominally i d e n t i c a l h o u s e s , t h e s t a n d a r d d e v i a t i o n s f o r SG (and a v e r a g e d a i l y consumption of n a t u r a l g a s p l u s e l e c t r i c i t y ) were a p p r o x i m a t e l y 10% of t h e mean v a l u e s f o r t h e groups. These would a p p e a r t o p r o v i d e a measure of t h e combined e f f e c t s of such f a c t o r s a s e x p o s u r e , o c c u p a n t management, f u r n a c e e f f i c i e n c y , c o l o r and o r i e n t a t i o n , a s w e l l a s v a r i a t i o n s i n q u a l i t y of house c o n s t r u c t i o n and changes made a f t e r c o n s t r u c t i o n , o n t h e t h e r m a l performance of t h e house.
1. Lawrence S. Mayer and J e f f r e y A. Robinson. A S t a t i s t i c a l A n a l y s i s of t h e Monthly Consumption of Gas and E l e c t r i c i t y i n t h e Home, C e n t e r f o r Environmental S t u d i e s Report No. 18. P r i n c e t o n U n i v e r s i t y , 1975. 2. C.P. Hedlin and H.W. O r r . A Study o f t h e Use of N a t u r a l Gas and
E l e c t r i c i t y i n Saskatchewan Homes, SHELTER, P r o c e e d i n g s of t h e T e c h n i c a l Program of t h e 9 1 s t Annual E I C Meeting, J a s p e r , A l b e r t a , NRCC 16898, May 1977, pp. 123-131.
3. Edwin L. Crow, F r a n c e s A. Davis and Margaret W. Maxfield. S t a t i s t i c s , C o l e s P u b l i s h i n g Co. L t d . , T o r o n t o , 1978.
4. G.P. M i t a l a s . N e t a n n u a l h e a t l o s s f a c t o r method f o r e s t i m a t i n g h e a t r e q u i r e m e n t s i n b u i l d i n g s , D i v i s i o n o f B u i l d i n g R e s e a r c h , N a t i o n a l Research C o u n c i l of Canada, B u i l d i n g Research Note 117, Ottawa, November 197
6.
Acknowledgement
The a u t h o r s w i s h t o e x p r e s s t h e i r a p p r e c i a t i o n t o t h e Saskatchewan Power C o r p o r a t i o n f o r p r o v i d i n g t h e e n e r g y consumption d a t a and t o t h e Regina C i t y A s s e s s o r ' s o f f i c e f o r p r o v i d i n g s i z e and o t h e r i n f o r m a t i o n a b o u t t h e s e h o u s e s . Without t h e i r a s s i s t a n c e and c o o p e r a t i o n t h e s t u d y c o u l d n o t have been c a r r i e d o u t . We a l s o wish t o t h a n k H.W. O r r and S.S. Tao f o r t h e i r a d v i c e and a s s i s t a n c e and T.B. Remple f o r h i s work i n c a r r y i n g o u t t h e a n a l y s e s .
TABLE 1 MEANS AND STANDARD DEVIATIONS OF FURNACE EFFICIENCY SLOPES
Main T o t a l S t a n d a r d
No. i n C o n s t r u c t i o n f l o o r a r e a f l o o r a r e a Mean S l o p e D e v i a t i o n
Group* Date m2 m2 W/DD % of Mean
- S i n g l e s t o r e y , no basement
17
1946
5
8
12
1957-60
83
2
11960-61
8
9
S i n g l e s t o r e y , f u l l basement47
1952
89
178
28.9
9.3
3
8
1965-67
9
6
191
27.3
7.6
49
1957-64
9
7
193
29.4
10.0
4
4
1965-67
106
193
29.9
10.3
Four l e v e l s p l i t3
4
1963-71
130
263
36.9
10.6
*9
h o u s e s were r e j e c t e d from t h e o r i g i n a l347
h o u s e s i n t h e s e g r o u p s , t h r e e b e c a u s e t h e y had h e a t e d swimming p o o l s and s i x b e c a u s e t h e i r s l o p e s d e v i a t e d w i d e l y from t h e o t h e r s of t h e i r group.F I G U R E 1 O U T D O O R T E M P E R A T U R E T a V S T , T I S B A S E D O N M O N T H L Y A V E R A G E S O F H D D l d a y F O R M A Y T O S E P T E P B E R 1 9 7 5 - 8 0 , S A S K A T O O N F I G U R E 2 N A T U R A L G A S l E G l A N D E L E C T R I C I T Y ( E E l - C O N S U M P T I O N D A T A F O R O N E H O U S E P L O T T E D A G A I N S T T - 1 8
-
H D D l d a yWASTED HOT WATER EF (ENERGY SUPPLIED T O F U R N A C E ) U S E F U L SPACE HEAT F R O M D O M E S T I C H O T WATER -9- - - 9 - - -
SPACE H E A T FROM OCCUPANTS, SOLAR A N D E L E C T R I C I T Y ( E D ) 1 F I G U R E 3 SPACE HEAT FROM FURNACE STRUCTURAL H E A T L O S S ( E s t v
---
1 ( a ) E N E R G Y I N P U T S F R O M O C C U P A N T S , S O L A R G A I N , E L E C T R I C I T Y F O R N O N - H E A T I N G P U R P O S E S , D O M E S T I C H O T W A T E R S Y S T E M S A N D F U R N A C E F U E L ( b ) S T R U C T U R A L H E A T L O S S S U P E R I M P O S E D O V E R 3 ( a )I I I
. . . .
.
. .
.o....
. . .. C A L C U L A T E D V A L U E S O F E~ -IG G-
L I N E R E P R E S E N T I N G A P E R F E C T F I TP
/-
@-
/ 6-
0"...
..a. --
-
-
-
-
-
-
-
-
C5)'"
1 I I I F I G U R E 4 P L O T O F E G-
I G I S G ( c ) V S T F O R 23 H O U S E S . T H I S S H O W S A R E L A T I O N S H I P B E T W E E N F L l E L C O N S U M P T I O N ( E G ) A N D H E A T I N G D E G R E E - D A Y S I D A YCOEFFICIENT OF DETERMINATION
P L O T O F F R E Q U E N C Y
V S
T H E C O E F F I C I E N T O F
C O R R E L A T I O N ( B O T T O M ) A N D C O E F F I C I E N T O F
D E T E R M I N A ' T I O N ( T O P ) F O R N A T U R A L G A S
C O N S U M P T I O N
-
D E G R E E - D A Y D A T A . C L I R V E
B A S E D OIV R E S U L T S F O R
5 7 1
H O U S E S
100
0.9
0.8
10.7
I0.6
0.5
I I+
I I I I I I I I I I I 1-
-
-
-
40
20
-
-
1
II
I 1.O
0.9
0.8
0.7
COEFFICIENT OF CORRELATION
UNCERTAINTY % AT 99% CONFIDENCE LEVEL
F I G U R E 6
99% C O N F I D E N C E L I M I T S FOR S G A S P E R C E N T A G E S OF THE S L O P E S
0
0 FULL BASEMENT
-
I STOREY 0-
FULL BASEMENT-
2 STOREIS 0-
D FULL BASEMENT
-
1-2 STOREYS FOUR LEVEL SPLIT-
-
-
-
-
-
I I I I I I I II
> 5 0 6 0 7 0 8 0 9 0 100 110 120 130 M F A ( M A I N F L O O R A R E A ) , m2 F I G U R E 7 E X T E R I O R G R O U N D L E V E L P E R I M E T E R V S N O M I N A L M A I N F L O O R A R E A ( E X T E R I O R M E A S U R E M E N T S I F O R 1 0 6 D I F F E R E N T H O U S E P L A N STOTAL FLOOR AREA, m2 ( N O M I N A L )
F I G U R E 8
N A T U R A L G A S C O I V S U M P T I O N
-
D E G R E E - D A Y
S L O P E S ( S G ) V S T O T A L N O M I N A L F L O O R
TOTAL F L O O R A R E A , m 2 ( N O M I N A L )
F I G U R E 9
I
0 FULL BASEMENT
-
I
STOREYFULL BASEMENT
-
2 STOREYS0 FULL BASEMENT
-
1-2
STOREYSA NO BASEMENT
-
I STOREYFOUR LEVEL SPLIT 0
-
Q HOUSES BUILT 191 1 - 3 2 (ALL TYPES)
8 DUPLEXES R013 0. @ 0 O