HAL Id: hal-02378131
https://hal.univ-lorraine.fr/hal-02378131
Submitted on 2 Dec 2020HAL is a multi-disciplinary open access archive for the deposit and dissemination of sci-entific research documents, whether they are pub-lished or not. The documents may come from teaching and research institutions in France or abroad, or from public or private research centers.
L’archive ouverte pluridisciplinaire HAL, est destinée au dépôt et à la diffusion de documents scientifiques de niveau recherche, publiés ou non, émanant des établissements d’enseignement et de recherche français ou étrangers, des laboratoires publics ou privés.
Aqueous surface chemistry of gold mesh electrodes in a
closed bipolar electrochemical cell
Alonso Gamero-Quijano, Grégoire Herzog, Micheál Scanlon
To cite this version:
Alonso Gamero-Quijano, Grégoire Herzog, Micheál Scanlon. Aqueous surface chemistry of gold mesh electrodes in a closed bipolar electrochemical cell. Electrochimica Acta, Elsevier, 2019, pp.135328. �10.1016/j.electacta.2019.135328�. �hal-02378131�
1
Aqueous Surface Chemistry of Gold Mesh Electrodes in a Closed Bipolar
Electrochemical Cell
Alonso Gamero-Quijano,a Grégoire Herzog,b Micheál D Scanlona,c*
a The Bernal Institute and Department of Chemical Sciences, School of Natural Sciences,
University of Limerick (UL), Limerick V94 T9PX, Ireland.
b Laboratoire de Chimie Physique et Microbiologie pour les Matériaux et l’Environnement
(LCPME), UMR 7564, CNRS, Université de Lorraine, 405 rue de Vandoeuvre, Villers-lès-Nancy, F-54600, France.
c Advanced Materials and Bioengineering Research (AMBER) Centre, Ireland.
*E-mail: micheal.scanlon@ul.ie
This document is a postprint. Final version has been published in Electrochimica,Acta 2020, 330, 135328 (https://www.sciencedirect.com/science/article/abs/pii/S0013468619322005)
Abstract
The influence of the bipolar electrode on the voltammetry observed with a closed bipolar electrochemical cell (CBPEC) goes far beyond simply conducting electrons between the two electrolyte solutions. The surface of each pole of the bipolar electrode may contain redox active functional groups that generate misleading or interfering electrochemical responses. Herein, a 4-electrode CBPEC configuration was studied with the opposite poles of the bipolar electrode resting in separate aqueous and organic electrolyte solutions. Using gold mesh wire electrodes as the poles, we systematically investigated the many experimental variables that influence the observed voltammetry upon addition of a reductant (decamethylferrocene) to the organic phase. External bias of the driving electrodes forced electrons released by decamethylferrocene at the organic pole to flow along the bipolar electrode and reduce redox active surface functional groups at the aqueous pole, such as oxide or hydroxide groups, or carry out the
2
oxygen reduction reaction (ORR) or hydrogen evolution reaction (HER). The 4-electrode CBPEC configuration diminishes capacitive currents, permitting observation of voltammetric signals from electron transfer processes related to surface functional groups at the aqueous pole at much lower scan rates than possible with working electrodes in conventional 3-electrode electrochemical cells. Surface modification, by oxidative or reductive electrochemical pre-treatment, changes the potential window experienced by the aqueous pole in the 4-electrode CBPEC in terms of its position versus the standard hydrogen electrode (SHE) and dynamic range. In a related observation, the electrochemical responses from the surface functional groups on the aqueous pole completely disappear after oxidative pre-treatment, but remain after reductive pre-treatment. The flow of electrons from decamethylferrocene to the surface of the aqueous pole is limited in magnitude, by the decamethylferrocene concentration, and kinetically limited, due to decamethylferrocene diffusion to the organic pole, in comparison to the infinite supply of electrons delivered to the surface of a working electrode in a 3-electrode cell. This unique feature of the 4-electrode CBPEC facilitates a very gradual evolution of the surface chemistry at the aqueous pole, for example from fully oxidised after oxidative pre-treatment to a more reduced state after repetitive cyclic voltammetry cycling. Perspective applications of this slow, controlled release of electrons to the electrode surface include spectroelectrochemical analysis of intermediate states for the reduction of metal salts to nanoparticles, or conversion of CO2 to reduced products at catalytic sites. The use of indium
tin oxide (ITO) electrodes in CBPEC experiments for specific reactions is recommended to avoid misleading or interfering electrochemical responses from redox active functional groups prevalent on metallic surfaces. However, the electronic bridge to implement entirely depends on the reaction under study, as ITO also has drawbacks such as a lack of electrocatalytic activity and the requirement of an overpotential due to its semiconducting nature.
Keywords
Bipolar electrochemistry, bipolar electrode, redox active surface functional groups, oxygen reduction reaction, hydrogen evolution reaction
1. Introduction
Bipolar electrochemistry entails oxidation and reduction reactions proceeding simultaneously at spatially separated sites on a single electrode, the bipolar electrode [1]. The
3
redox reactions on the bipolar electrode are driven by a potential gradient in solution, generated by an external bias of the driving electrodes. The bipolar electrode is electrically floating or “wireless” [2]. As the electric field varies in strength along the length of the bipolar electrode, so too does the magnitude of the interfacial potential difference between the bipolar electrode and solution (in parallel to the driving electric field) [3]. This interfacial potential difference initiates the electrochemical reactions at the surface of the bipolar electrode. The charge is conserved on the bipolar electrode, and therefore the reduction current is equal to the oxidation current [4].
In a closed bipolar electrochemical cell (CBPEC), the two poles of the bipolar electrode rest in two separate electrolyte solutions [5,6]. Each of these electrolytes have their own driving electrode. Thus, if a reduction reaction is to occur at the surface of the pole of the bipolar electrode in one electrolyte, and oxidation at the other, electroneutrality must be maintained in each electrolyte as electrons flow along the bipolar electrode. This is achieved by the opposite redox reactions occurring at the driving electrodes in each electrolyte [7,8]. To optimise the potential applied to each driving electrode, in order to precisely tune the interfacial potential difference between the bipolar electrode and solution, reference electrodes may also be introduced into each electrolyte. This is known as a CBPEC in a 4-electrode configuration and may conceptually be compared to two back-to-back 3-electrode electrochemical cells connected by a conducting electronic bridge, i.e., the bipolar electrode [9]. The opposite poles of the bipolar electrode are effectively working electrodes in each electrolyte, with the driving electrodes operating as the counter electrodes.
The CBPEC configuration is highly versatile, with the experimental conditions experienced by each pole of the bipolar electrode often diverging widely, e.g., in terms of the nature of the solvent and solute, pH, temperature, exposure to light, etc. In particular, the CBPEC configuration has proved very popular for the development of novel (spectro)electroanalytical sensors [10,11]. The basic premise of such devices is that the signal generated at one pole (known as the reporting pole) is an accurate reflection of the processes occurring at, and the state of, the pole resting in the analyte (the sensing pole) [12]. The reporting signal has typically been the detection of an optical signal generated by the oxidation half-reaction (electrochemiluminescence [13], electrochromism [14], and electrofluorescence [15]), with the sensing being through the reduction half-reaction.
Herein, we discuss the 4-electrode CBPEC with aqueous-organic electrolyte solutions [16–18], with one pole of the bipolar electrode immersed in various aqueous electrolytes and
4
the other in the organic solvent -trifluorotoluene (TFT) containing a highly hydrophobic salt. Electron transfer between redox couples at opposite poles of a bipolar electrode, immersed in aqueous and organic electrolytes, respectively, is thermodynamically equivalent to the corresponding interfacial electron transfer event at the interface between two immiscible electrolyte solutions (ITIES) [16].
The interpretation of voltammetry for a 4-electrode CBPEC is non-trivial as the electrochemical features are determined by thermodynamic and kinetic factors that influence the redox processes at both poles of the bipolar electrode simultaneously [9]. The bipolar electrode is not simply an electron conductor between the two electrolytes, its surface may contain redox active functional groups that influence the voltammetry – just as the surface chemistry of any working electrode influences the voltammetry observed in a conventional 3-electrode cell. In this regard, we provide a systematic understanding of the voltammetry of the 4-electrode CBPEC with aqueous-organic electrolyte solutions when a reductant, consisting of a ferrocene-derivative, is introduced to the organic phase and the bipolar electrode is metallic. The number of factors which required careful consideration when evaluating the voltammetry of this seemingly simple system was extensive, such as the relative diffusion coefficients of species in the aqueous and organic electrolytes, the nature of the redox reaction (diffusion-controlled vs. surface-active) in each electrolyte, the redox potential of the ferrocene derivative, the nature of the aqueous anions (protonated or non-protonated, strongly or weakly adsorbing), the electrochemical pre-treatment of the aqueous pole of the bipolar electrode (reductive vs. oxidative pre-treatment), the presence of oxygen in the aqueous electrolyte, the nature of the bipolar electrode (metallic vs. non-metallic), the concentration of reductant in the organic phase, and the width of the potential window applied during the 4-electrode CBPEC experiment.
The experimental findings emphasise the ease with which misleading electrochemical signals can be generated in a 4-electrode CBPEC once an electron donor (or acceptor) species is introduced to either electrolyte, especially if the poles of the bipolar electrode have redox active surface functional groups. The systematic nature of our study provides a guide to avoid such experimental artefacts and permit the widespread use of this under-utilised, but hugely versatile, electrochemical technique.
2. Experimental methods
5
All chemicals were used as received without further purification. All aqueous electrolyte solutions were prepared with ultra pure water (Millipore Milli-Q, specific resistivity 18.2 Mcm). The organic solvent ,,-trifluorotoluene (TFT, 99+%) was received from Acros Organics. Dimethylferrocene (DiMFc, 95%) and decamethylferrocene (DcMFc, 97%) were purchased from Sigma-Aldrich. Bis(triphenylphosphoranylidene)ammonium chloride (BACl, 97%), potassium ferricyanide (K3Fe(CN)6, ≥99%), potassium ferrocyanide
(K4Fe(CN)63H2O, ≥99.95), lithium chloride (LiCl, ≥ 95%), sodium chloride (NaCl, ≥99%),
lithium sulfate (Li2SO4, ≥99%) and lithium perchlorate (LiClO4,≥95%) were purchased from
Sigma-Aldrich. Lithium tetrakis(pentafluorophenyl)borate diethyletherate ([Li(OEt2)2]TB)
was received from Boulder Scientific Company. BACl and [Li(OEt2)2]TB were used to prepare
the organic electrolyte salt bis(triphenylphosphoranylidene)ammonium tetrakis(pentafluorophenyl)borate (BATB) by metathesis of equimolar solutions of BACl and [Li(OEt2)]TB in a methanol-water (2:1 v/v) mixture. The resulting precipitates were filtered,
washed and recrystallized from acetone. Phosphate buffered saline (PBS) tablets were purchased from Sigma-Aldrich and used in the preparation of the phosphate buffer solution. The pH of the latter was fixed to pH 7 by dissolving a PBS tablet in ultra pure water and diluting to achieve final concentrations of 2 mM phosphate buffer, 0.54 mM potassium chloride (KCl), and 27.4 mM NaCl.
2.2 Electrochemical measurements
The configuration of the 4-electrode CBPEC used in this study is shown in Scheme 1, and an image of the setup is provided in Fig. S1, ESI. The poles of the bipolar electrode consisted of two gold mesh electrodes, one immersed in the aqueous phase (Pw) and the other
in the organic phase (Po). Each pole was connected through a copper wire. Two Ag/AgCl wires
were used as pseudo-reference electrodes, one immersed in the aqueous phase and the other in the organic reference solution, i.e., an aqueous solution of 10 mM LiCl and 1 mM BACl, through Luggin capillaries. Platinum wire electrodes, one in each phase, were used as counter electrodes (driving electrodes). Prior to each electrochemical measurement, to eliminate the presence of any trace impurities, a flame anneal procedure was implemented [19,20]. Briefly, the gold mesh electrode was carefully heated in a butane-oxygen flame and protected with a drop of ultrapure water while the electrode was at relatively high temperatures. The gold mesh electrode was then carefully transported and immersed in the aqueous or organic compartment of the CBPEC, respectively. Additional studies were carried out replacing the gold mesh with either platinum mesh or ITO electrodes for both Pw and Po.
6
Scheme 1. Configuration of the 4-electrode closed bipolar electrochemical cell (CBPEC) used
in this study. Each pole of the bipolar electrode consisted of gold mesh wires (unless stated otherwise), with one immersed in each compartment, denoted Pw in the aqueous phase and Po
in the organic phase, and connected with an electric wire. The electron donating ferrocene derivative, either decamethylferrocene (DcMFc) or dimethylferrocene (DiMFc), was dissolved in the α,α,α-trifluorotoluene (TFT) organic phase. The organic electrolyte salt was 5 mM bis(triphenylphosphoranylidene)ammonium tetrakis(pentafluorophenyl)borate (BATB). Several aqueous electrolytes were studied; 2 mM phosphate buffer solution, 5 mM sodium chloride (NaCl), 10 mM lithium sulfate (Li2SO4) and 10 mM lithium perchlorate (LiClO4). The
4-electrode CBPEC experiments were carried out under aerobic conditions and the scan rate used was 20 mVs–1 (unless stated otherwise).
All electrochemical experiments were carried out with a WaveDriver 20 bipotentiostat from Pine Research Instrumentation, Inc., and controlled by AfterMath software version 1.4. The potential window experienced by Pw during a CV scan in the 4-electrode CBPEC
configuration was measured with an Amprobe 35XP-A multimeter using an auxiliary Ag/AgCl pseudo-reference electrode as an electric contact. As is the case for electrochemical measurements at the interface between two immiscible electrolyte solutions (ITIES), the applied potential (E) in the 4-electrode CBPEC configuration with aqueous-organic electrolyte solutions is related to the Galvani potential scale by the relationship: 𝐸 = ow + 𝐸ref.. As the
reference electrodes used at the ITIES and the CBPEC configuration were identical, the value of 𝐸ref. determined using the model ion transfer probe tetramethylammonium cation (TMA+) at the ITIES can also be used to calibrate all voltammetry data obtained in the CBPEC configuration to the Galvani potential scale. This procedure has been outlined in detail previously [21].
3. Results and Discussion
7
In a conventional 3-electrode cell, the peak on the forward sweep with a positive current indicates the species in solution is being oxidised at this potential on the working electrode. However, in the 4-electrode CBPEC with immiscible aqueous–organic solutions, the peak on the forward sweep with a positive current indicates the flow of negative charge, i.e., electrons, from the organic to aqueous compartment through the progress of two half-reactions [9]. As outlined in eqn (1) and (2), simultaneously, an aqueous electron acceptor species (Aw) is
reduced at Pw and an organic electron donor species (Do) is oxidised at Po.
Do0+ Po0 → Do++ Po− (1)
A0w+ P
w− → A−w+ Pw0 (2)
When the sweep direction is reversed and scanned negatively, the back-reactions of eqn (1) and (2) take place, and electrons flow from the aqueous to organic compartment producing a peak on the reverse sweep with a negative current. Overall, assuming Aw and Do exchange a
single electron, the heterogeneous redox reaction is:
Do0+ A0w → Do++ A−w (3)
Thus, to summarise simply, a positive current during a 4-electrode CBPEC experiment means a species in the aqueous electrolyte is being reduced at that potential, while a negative current means a species in the organic phase is being reduced. Therefore, important aqueous reactions at Pw, such as the oxygen reduction reaction (ORR) or hydrogen evolution reaction (HER), take
place at positive potentials and produce positive currents in a 4-electrode CBPEC experiment. By comparison, the ORR and HER at the working electrode in a conventional 3-electrode cell appear at negative potentials and produce negative currents.
3.2 Voltammetry in a 4-electrode CBPEC with a low concentration of a reductant in the organic phase
Cyclic voltammograms (CVs) were obtained with the 4-electrode CBPEC outlined in Scheme 1 with a phosphate buffer solution. This potentiodynamic mode controls the potential difference between the two half-cells along the selected potential window on the Galvani potential scale (ow). A blank CV, with only the aqueous and organic electrolytes present in each phase, displayed a featureless double-layer with no faradaic process recorded within the potential window (Fig. 1a, dashed line). A further CV upon addition of micromolar concentrations of the reversible redox probe DcMFc in the TFT organic phase, acting as Do,
8
appearance of a positive peak centered at –0.280 V as the potential was swept positively indicated the flow of electrons from Po to Pw. Thus, an unidentified species was reduced at Pw
(thereby acting as Aw), as the DcMFc species were oxidised at Po. When the direction of the
scan was reversed, the back-reactions occurred with a negative peak centered at –0.350 V. The standard Galvani potential difference for the heterogeneous electron transfer (HET) between Aw and Do with a 4-electrode CBPEC, assuming Aw and Do exchange a single electron,
is given by: ow HET ⊖ = [𝐸 Do+/Do0 ⊖ ] SHE o − [𝐸A w 0/A w − ⊖ ] SHE w (4)
Thermodynamically, owHET⊖ represents the Galvani potential difference where electron transfer is expected to take place between Aw and Do, and is assumed to be the half-wave
potential of the reversible redox process (ow1/2) recorded with the 4-electrode CBPEC. The latter assumption, however, does not take into account the presence of overpotentials (owET) or iR drop (owiR) during the electrochemical measurement which would shift ow1/2 to more positive potentials: ow 1/2 = o w HET ⊖ + o w ET+ o wiR (5) [𝐸 D o +/D o 0 ⊖ ] SHE o and [𝐸A w 0/A w − ⊖ ] SHE w
are the standard redox potentials of the organic electron donor
and aqueous electron acceptor redox couples, respectively, on the SHE scale. [𝐸 D
o +/D o 0 ⊖ ] SHE o for the DcMFc+/DcMFc redox couple in TFT has been determined previously as +0.107 V [21]. Thus, measuring ow1/2 as –0.315 V from Fig.1a and assuming the overpotential and iR drop were negligible during the CV measurement, [𝐸A
w 0/A w − ⊖ ] SHE w
of the unknown redox process at the surface of Pw was +0.422 V. It should be noted at this point that, as will be detailed
throughout this article, the overpotential and iR drop are not negligible and thus the value of [𝐸A w 0/A w − ⊖ ] SHE w
= +0.422 V should be considered as a close guideline to the true value and not an absolute value.
As detailed in Eqn (4) and (5), if the HET occurs between Do and the unknown redox
process at the surface of Pw on the gold mesh in the aqueous compartment, ow1/2 for the
9
Thus, the strongly reducing DcMFc redox couple ([𝐸 DcMFc
o +/DcMFc o 0 ⊖ ] SHE o = +0.107 V) was
replaced with the weaker DiMFc redox couple ([𝐸 DiMFc
o +/DiMFc o 0 ⊖ ] SHE o = +0.584 V) in the TFT organic phase [21]. The change of the electron donor in the 4-electrode CBPEC led to a shift of the reversible redox response towards more positive potentials (Fig. 1b). From a thermodynamic point of view, a potential shift of 0.477 V was expected. However, the experimentally observed shift was 0.570 V. Although, the latter was proportional to the difference of the standard redox potentials of both electron donors employed, an overpotential of 93 mV was required. This overpotential is inherent to the 4-electrode CBPEC, with further detailed explanations on this topic given in section 3.9.
Fig. 1. (a) Redox response using a 4-electrode CBPEC in the presence of micromolar
concentrations of a reversible redox species in the organic phase acting as a reductant (Do).
Cyclic voltammograms (CVs) were obtained with a 2 mM phosphate buffer solution, with or without 16 µM DcMFc present in the TFT organic phase. (b) Nature of the organic electron donor species. CVs were obtained with a 2 mM phosphate buffer solution, and either 14 µM DiMFc or DcMFc present in the TFT organic phase. (c) Scan rate studies. CVs were obtained with scan rates across the range 10-200 mVs–1 using a 4-electrode CBPEC with a 5 mM NaCl aqueous electrolyte, and 16 µM DcMFc present in the TFT organic phase. (d) Plots of peak current (ip / A) versus the square root of the scan rate (1/2 / (Vs–1)1/2) and peak-to-peak
10
separation (Ep / mV) versus scan rate ( / Vs–1) from the CVs presented in (c). The scan rate
used was 20 mVs–1, unless stated otherwise. The full configuration for the 4-electrode CBPEC experiments is shown in Scheme 1.
A scan rate study was performed with the 4-electrode CBPEC, across the range 10-200 mVs–1, with 16 M DcMFc in the TFT organic phase and a 5 mM NaCl aqueous electrolyte (Fig. 1c). The plot of the peak current (ip) versus the square root of the scan rate (1/2) was
linear, indicating that the HET recorded with the 4-electrode CBPEC was limited by a diffusion-controlled electrochemical reaction (Fig. 1d, black triangles). The limiting reaction is likely to be that in the organic phase, involving the diffusion of micromolar concentrations of DcMFc towards Po to compensate the charge of surface processes at Pw, a high-surface area
mesh electrode. Furthermore, the peak-to-peak separation increased with fast scan rates (Fig. 1d, red dots), as expected for a diffusion-controlled reaction. Nevertheless, as noted in Eqn (1) and (2), in the 4-electrode CBPEC, two half-reactions occurs simultaneously at Pw and Po.
Thus, if one of the reactions is diffusion-controlled, the overall bipolar response may also be diffusion-controlled even if the second reaction involves a diffusionless surface process. In this regard, it is noteworthy that at lower scan rates (10 and 20 mV·s–1) the peak shape and the peak-to-peak separation became less characteristic of a diffusion-controlled process (Fig. 1c). This is the first evidence that the electroactive species acting as Aw may be attributed to a
diffusionless surface process on Pw. The diffusion of DcMFc to Po is less dominant at slow
scan rates and the features of the observed CVs in the 4-electrode CBPEC change, being influenced more by the redox reaction at Pw.
3.3 Reversible gold oxide or hydroxide formation and reduction at the aqueous pole of the bipolar electrode in a 4-electrode CBPEC
In order to identify the unknown aqueous redox process acting as Aw in Fig. 1, the
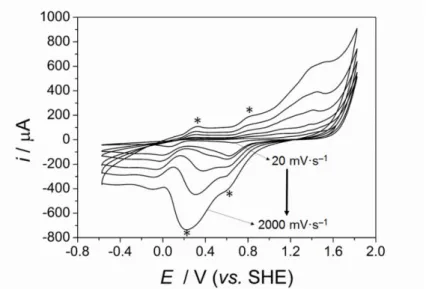
electrochemistry of the gold mesh in the aqueous compartment with a 2 mM phosphate buffer solution was probed using a conventional 3-electrode cell (Fig. 2). Electron transfer processes, such as gold oxide or hydroxide formation and their reduction, respectively, take place across a wide potential window ranging from +0.100 to +0.700 V vs. SHE. In a 3-electrode cell, certain electron transfer processes are obscured by capacitive currents at low scan rates (20 and 100 mVs–1) and only become apparent at high scan rates (200 to 2000 mVs–1) [22–24], as indicated by the asterisks in Fig. 2 at 2000 mVs–1. However, the 4-electrode CBPEC configuration diminishes such capacitive currents by a mechanism that is still unclear and
11
currently under investigation. Despite the fact that Pw and Po are high surface area gold mesh
electrodes, capacitive currents on the order of 10–7 A were measured (Fig. 1a). Thus, electron transfer processes involving surface functional groups on Pw, typically only seen at high scan
rates (200 to 1000 mVs–1) on gold working electrodes in a 3-electrode cell, may appear at 20 mVs–1 using a 4-electrode CBPEC configuration in the presence of micromolar concentrations of an electron donor such as DcMFc in the organic phase.
Fig. 2. CVs from a conventional 3-electrode cell obtained with a 2 mM phosphate buffer
solution and a gold mesh working electrode. Electrochemical electron transfer processes related to surface functional groups concealed by capacitive currents at the gold surface at lower scan rates (20 and 100 mVs–1) become apparent at higher scan rates (200, 500, 1000 and 2000 mVs–1), as indicated by the asterisks.
A complication when analysing CVs in a 4-electrode CBPEC configuration, as reported by Hotta et al. [16], is that Pw and Po experience different polarisable potential windows during
the external bias. The potential window at Pw spans a much shorter range than that at Po. This
is because the aqueous and organic phases are fundamentally different in terms of their conductivities, with a much larger iR drop experienced in the organic phase. Thus, to induce electron transfer between DcMFc and the unknown aqueous redox process on Pw, the potential
window of Pw must cover a range than encompasses [𝐸A w 0/A w − ⊖ ] SHE w = +0.422 V. To confirm the latter, the potential window of Pw was monitored using a multimeter and an auxiliary Ag/AgCl
pseudo-reference as an electric contact. The Galvani potential difference in the 4-electrode CBPEC was scanned from –0.600 to +0.200 V using the configuration detailed in Scheme 1
12
with 16 M DcMFc in the TFT organic phase and a phosphate buffer solution. The potential window of Pw was found to range from +0.630 to +0.410 V vs. SHE, i.e., Pw was always
polarised positively during potentiodynamic cycling. In accordance with Hotta et al. [16], the potential window of Pw was short, just 220 mV, yet crucially did encompass [𝐸A
w 0/A w − ⊖ ] SHE w = +0.422 V and indeed spanned the key potential range where electron transfer processes such as gold oxide or hydroxide formation and their reduction, respectively, take place, as shown in Fig. 2.
The 220 mV potential window experienced by Pw indicates that the same scan rate is
not experienced by each pole in the 4-electrode CBPEC during a CV. The underlying reason for this, as noted, is the different iR drops in the aqueous and organic phase. The lower iR drop in the aqueous phase in comparison to the organic phase, leads to a slower drop in potential (in essence a slower scan rate) at Pw than Po. As a consequence, while a 20 mVs–1 scan rate is set
by the potentiostat, covering a potential window 800 mV in width (from –0.600 to +0.200 V), the 220 mV potential window experienced at Pw indicates an effective scan rate of only 5.5
mVs–1 in the aqueous compartment. This lower scan rate at Pw may also possibly explain the
low capacitive currents observed during the 4-electrode CBPEC experiments described herein. The reversibility of the redox process observed with the 4-electrode CBPEC in Fig. 1 suggests that hydroxide formation and reduction on the surface of the gold mesh is the leading candidate to act as Aw, over the less reversible oxide formation and reduction surface process.
The redox process is unlikely to be hydrogen adsorption. The latter is not a surface process observed with gold electrodes, and is not seen in the voltammetry of the gold mesh electrode in a 3-electrode cell (Fig. 2). In the following sections, the possibility that alternative redox processes, such as anion adsorption, oxygen reduction, and hydrogen evolution, give rise to the redox response with [𝐸A
w 0/A w − ⊖ ] SHE w
= +0.422 V are all explored and, ultimately, ruled out.
3.4 Voltammetry in a 4-electrode CBPEC in the presence of different aqueous electrolyte anions
The possibility of anion adsorption being responsible for the aqueous redox process occurring at Pw, and acting as Aw, was investigated by changing the aqueous phase in the
4-electrode CBPEC from a 2 mM phosphate buffer solution to either 5 mM NaCl, 10 mM Li2SO4,
or 10 mM LiClO4 (Fig. 3). The reversible redox response in the presence of DcMFc in the TFT
13
(Fig. 3), in each case reasonably near the ow1/2 value initially observed with the phosphate buffer solution. These small shifts in ow1/2 and minor variations in the shape of the redox response between aqueous electrolytes are attributed to influence of the different anions on the adsorption (or re-structuring) of the water on the surface of Pw [25]. Furthermore, slight
experimental errors associated with the calibration of the pseudo-reference Ag/AgCl reference electrodes in each compartment of the 4-electrode CBPEC are possible.
Fig. 3. Varying the aqueous electrolyte anion. CVs were obtained using a 4-electrode CBPEC
with either a 5 mM NaCl, 2 mM phosphate buffer solution, 10 mM Li2SO4 or 10 mM LiClO4
aqueous electrolyte, and micromolar concentrations of DcMFc present in the TFT organic phase. The scan rate used was 20 mVs–1. The full configuration for the 4-electrode CBPEC experiments is shown in Scheme 1.
Surface oxides or hydroxides on gold may be reduced or oxidised using the exchange of protons with adsorbed phosphates in the phosphate buffer solution, such as H2PO4– and
HPO42– [26,27], and hence go through a proton-coupled electron transfer mechanism (PCET)
14
mechanism cannot occur if the absorbing species is a chloride (Cl–), sulfate (SO42–), or
perchlorate (ClO4–) anion. Thus, the role of adsorbed phosphates in a PCET mechanism giving
rise to the redox response in Fig. 1a is unlikely. Furthermore, ClO4– adsorbs weakly to a gold
electrode, whereas SO42– adsorbs strongly [28]. As a result, for CVs obtained using a
3-electrode cell with a gold mesh working 3-electrode, additional voltammetric features appear with a 10 mM Li2SO4 aqueous electrolyte in comparison to using 10 mM LiClO4 (Fig. S2,
ESI). One of these additional peaks on the CV appears in the potential region matching the potential window experienced by Pw in a 4-electrode CBPEC experiment (+0.630 to +0.410 V
vs. SHE). Nevertheless, no extra peaks were observed for CVs with the 4-electrode CBPEC across the potential range of –0.600 V to +0.200 V using 10 mM Li2SO4 as the aqueous
electrolyte in comparison to using 10 mM LiClO4 (Fig. 3). Again, this indicates that the redox
response at ow1/2 = –0.315 V is unlikely to involve anion adsorption.
3.5 Voltammetry in a 4-electrode CBPEC after oxidative or reductive electrochemical pre-treatment of the aqueous pole of the bipolar electrode
Further experiments were performed to confirm the impact of the surface chemistry of Pw on the electrochemical responses observed with the 4-electrode CBPEC. Pw was
electrochemically pre-conditioned potentiostatically, acting as the working electrode in a 3-electrode cell configuration, prior to being used in the 4-3-electrode CBPEC, either at +1.2 V vs. SHE (oxidative pre-treatment) or –0.9 V vs. SHE (reductive pre-treatment), respectively, for 100 seconds. In the absence of DcMFc in the TFT organic phase, CVs with a featureless double-layer were observed for both electrochemical pre-treatments (Fig. S3, ESI), in accordance with the blank CV recorded in Fig. 1a for an unconditioned gold mesh as Pw.
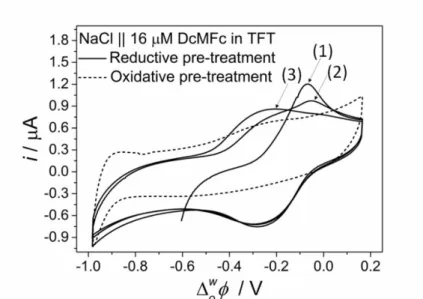
However, with micromolar concentrations of DcMFc present in the TFT organic phase, markedly different electrochemical responses were observed with the 4-electrode CBPEC depending on the nature of the electrochemical pre-treatment, as shown with NaCl as the aqueous electrolyte in Fig. 4. Reductive pre-treatment led to the observation of a reversible redox response (Fig. 4, solid lines) at a near identical ow1/2 to that with the unconditioned gold mesh as Pw. At least three CV cycles were needed to stabilise this redox response. The
sharp positive peak in the first CV cycle broadened and shifted towards more negative potentials over the course of the next two CV cycles. Reductive pre-treatment of the gold mesh leads to the removal of oxide/hydroxide monolayers from the gold surface which typically ages after repetitive cycles [23,29,30]. As Pw in the 4-electrode CBPEC during a CV, oxidation and
15
The first CV cycle produced a sharp positive peak centered at –0.070 V due to the oxide/hydroxide-free gold mesh. However, for the second CV cycle, the surface of Pw was
already partially modified with oxide/hydroxide monolayers [24]. Therefore, two positive peaks were observed during the second CV cycle, indicating the presence of two processes with different kinetic profiles. These two processes may have been oxide formation either within patches of pristine gold or on sites where oxide formation had already occurred. By the third cycle, the surface of Pw was more uniform and produced a single broad positive peak. The
broad nature of this peak indicated a much larger heterogeneity of absorption sites than was the case during the first CV scan. These trends during the first three CV cycles were highly reproducible and observed after reductive pre-treatment of Pw and subsequent immersion into
any of the aqueous electrolytes investigated. For example, the experimental data for Li2SO4 as
the aqueous electrolyte in the 4-electrode CBPEC is shown in Fig. S4, ESI. On the other hand, oxidative pre-treatment of the gold mesh acting as Pw led to all of the voltammetric features
disappearing, again irrespective of the aqueous electrolyte, as shown for 4-electrode CBPEC experiments with NaCl (Fig. 4, dashed line) and Li2SO4 (Fig. S4, ESI) as the aqueous
electrolytes.
Fig. 4. Reductive and oxidative pre-treatment of the aqueous pole of the bipolar electrode (Pw).
CVs were obtained with a 5 mM NaCl aqueous electrolyte and 16 µM DcMFc present in the TFT organic phase after electrochemical oxidative (+1.2 V vs. SHE) or reductive (–0.9 V vs. SHE) pre-treatment of the gold mesh electrode acting as Pw. For the latter, the first 3 CV scans
are shown. The scan rate used was 20 mVs–1. The full configuration for the 4-electrode CBPEC experiments is shown in Scheme 1.
16
The potential windows of both reductively and oxidatively pre-treated gold mesh electrodes acting as Pw were monitored using a multimeter and an auxiliary Ag/AgCl
pseudo-reference as an electric contact while the Galvani potential difference in the 4-electrode CBPEC was scanned from –0.600 to +0.200 V. The configuration used is detailed in Scheme 1, with a 2 mM phosphate buffer solution and 16 µM DcMFc present in the TFT organic phase. When Pw was reductively pre-treated, the potential window varied from +0.600 to +0.390 V vs. SHE
during potentiodynamic cycling (indicating a scan rate of ~5 mVs–1 at Pw), in line with the
potential window observed for an untreated Pw, as discussed in section 3.3. However, when Pw
was oxidatively pre-treated, the potential window varied only slightly during potentiodynamic cycling, from +0.980 to +0.940 V vs. SHE, a mere 40 mV (indicating a very slow scan rate of just 1 mVs–1 at Pw). Thus, the potential window of Pw is relatively dynamic when reductively
pre-treated, varying across a 210 mV range as the CV is scanned from –0.600 to +0.200 V in the 4-electrode CBPEC. On the other hand, the potential window of Pw is almost static when
oxidatively pre-treated, varying only 40 mV during the same 4-electrode CBPEC experiment. Futhermore, depending on the type of electrochemical pre-treatment for Pw, the
potential window experienced by Pw differs during the 4-electrode CBPEC experiment.
Reductive pre-treatment leads to a potential region of the gold mesh being scanned (+0.600 to +0.390 V vs. SHE) that is rich in electron transfer processes related to oxide or hydroxide formation or reduction, respectively, as seen in Fig. 2, that can act as Aw. Thus, the reversible
redox response in the 4-electrode CBPEC seen in Fig. 4 after reductive pre-treatment is due to the same surface process with a predicted redox potential of +0.422 V vs. SHE on Pw, capable
of acting as Aw, as seen for the untreated Pw in Fig. 1. However, oxidative pre-treatment leads
to a tiny potential region of the gold mesh being scanned at far more positive potentials (+0.980 to 0.940 V vs. SHE). After oxidative pre-treatment, the electrode is coated in a thick passivating oxide film that is kinetically difficult to reduce (in comparison to the much more electrochemically reversible oxide or hydroxide groups present on Pw after reductive
pre-treatment). Thus, the small potential variation experienced by Pw is simply too short and at too
positive potentials to reduce the passivating gold oxide film on Pw by promoting electron
transfer from DcMFc, acting as Do, to the surface of Pw. The passivating gold oxide film on the
mesh is not capable of acting as Aw as the CV is scanned from –0.600 to +0.200 V in the
4-electrode CBPEC, electroneutrality cannot be reached in either compartment, and therefore electrons cannot flow along the bipolar electrode as described in Eqn (1) and (2).
17
Thus, a key conclusion is that any surface modification, such as oxide formation or possibly even modifying a gold electrode with a self-assembled monolayer of thiol molecules, may lead to different potential regions of Pw being scanned during the 4-electrode CBPEC
experiment and even affect the scan rate experienced by Pw. As a consequence, misleading
experiment results may be easily generated.
3.6 Use of other metallic electrodes and non-metallic electrodes as the poles of the bipolar electrode
The nature of Pw was also investigated by replacing the gold mesh in the aqueous
compartment with a platinum mesh electrode. By changing the nature of Pw from gold to
platinum, the redox response with a phosphate buffer solution and micromolar concentrations of DcMFc in the TFT organic phase was positioned at a more negative ow1/2 = –0.473 V both without pre-treatment and also after reductive pre-treatment (Fig. 5a). For a direct comparison of the shifts in the redox responses using platinum instead of a gold mesh (both without pre-treatment) as Pw, see Fig. S5, ESI. This is clear evidence that the redox response on Pw, acting
as Aw, is attributed to the surface chemistry of Pw, and not Po. Indeed, if the gold mesh in the
organic compartment acting as Po was replaced with a platinum mesh, but Pw remained
unchanged as a gold mesh, no change in the voltammetry was observed (data not shown), i.e., the same reversible redox process centered at –0.320 V was recorded as seen when both Pw and
Po were gold mesh electrodes. In other words, DcMFc diffused to Po and acting as Do underwent
electron transfer with the metal. This half-reaction, described in Eqn (1), was not influenced by the nature of Po once it was a conductive material (e.g., a metallic electrode or ITO).
In comparison to the electrochemistry of gold or platinum electrodes, the electrochemistry of non-metallic indium tin oxide (ITO) electrodes is devoid of any electron transfer processes due oxide or hydroxide formation and their reduction, respectively. In this regard, ITO electrodes were used as Pw and Po. As shown in Fig. 5b, no reversible redox
responses were observed while the Galvani potential difference in the 4-electrode CBPEC was scanned from –1.200 to +0.200 V with a phosphate buffer solution and an excess (>1 mM) of DcMFc present in the TFT organic phase. Only an increase in current at positive potentials was seen, attributable to the irreversible reduction of the ITO [31], beginning at a Galvani potential difference of ~0 V.
18
Fig. 5. Nature of the aqueous pole of the bipolar electrode. (a) Platinum mesh electrodes were
used as both Pw and Po. CVs were obtained with a 2 mM phosphate buffer solution and 10 M
DcMFc present in the TFT organic phase. Pw was investigated without pre-treatment, and after
reductive and oxidative electrochemical pre-treatment. (b) Indium tin oxide (ITO) electrodes were used as both Pw and Po. A CV was obtained with a 2 mM phosphate buffer solution and
excess (> 1 mM) DcMFc present in the TFT organic phase at an extended potential window. Scan rate used was 20 mVs–1. The full configuration for the 4-electrode CBPEC experiments is shown in Scheme 1.
3.7 Observing the ORR in a 4-electrode CBPEC with a high concentration of a reductant in the organic phase
Studies of the aqueous phase purged with nitrogen, and maintained under anaerobic conditions throughout, were undertaken to investigate if the ORR at Pw is the aqueous redox
reaction acting as Aw during the 4-electrode CBPEC experiments (see Fig. S6, ESI). CVs under
anaerobic conditions with a phosphate buffer solution and micromolar concentrations of DcMFc in the TFT organic phase display identical reversible peak shapes and ow1/2 values
19
to those measured in the presence of oxygen in Fig. 1. Also, the same trends were observed under anaerobic conditions after oxidative and reductive pre-treatment of Pw as was the case
with oxygen present in Fig. 4. Therefore, these reversible redox processes recorded as the CV is scanned from –0.600 to +0.200 V with the 4-electrode CBPEC did not involve O2 reduction.
Thusfar, the 4-electrode CBPEC experiments discussed were carried out in the presence of relatively low micromolar concentrations of DcMFc in the TFT organic phase. To investigate the influence of DcMFc concentration, CVs were obtained with a five-fold increase of the DcMFc concentration in the TFT organic phase using the configuration detailed in Scheme 1, with a 10 mM LiClO4 aqueous electrolyte and either 20 or 100 µM DcMFc present
in the TFT organic phase. The charge transfer recorded on the forward and reverse sweeps was directly proportional to the increase of DcMFc concentration (Fig. 6a). Integration of the charge under the peak on the forward sweep revealed a 5-fold increase in charge (from 0.276 mC to 1.401 mC) upon increasing the concentration of DcMFc from 20 M (Fig. 6a, solid blank line) to 100 M (Fig. 6a, solid red line). Thus, the aqueous redox process (Aw) on the gold mesh at
ow1/2 = –0.315 V is limited by the concentration of DcMFc (Do).
Extending the potential window in the 4-electrode CBPEC slightly, with LiClO4 as the
aqueous electrolyte and 20 M concentration of DcMFc in the TFT organic phase, revealed the presence of a diffusion-controlled peak at approximately ~0 V (Fig. 6a, dotted black line). No such peak is seen at this potential with such low DcMFc concentrations for any of the other aqueous electrolytes tested, as shown in Fig. 3. This peak is attributed to the ORR on Pw. The
reason the ORR is only seen at this relatively negative potential with LiClO4 in the 4-electrode
CBPEC is attributed to the weak interaction of ClO4– anions with the surface of the gold mesh
[28]. As demonstrated in 3-electrode experiments with Au(100) electrodes at neutral and basic conditions, the presence of a strongly adsorbing anion in solution, such as Cl–, SO42–, H2PO4–
and HPO42–, herein, may compete with HO2– for the adsorption sites and force its desorption,
hindering the reduction to OH– [28]. Therefore, the weaker the adsorption of the anion, the more positive the potential required to initial the ORR on the working electrode in a 3-electrode cell (and conversely the more negative a potential required in a 4-electrode CBPEC, as noted in section 3.1). Upon increasing the concentration of DcMFc in the organic phase five-fold, within the potential window of –0.600 to +0.200 V in the 4-electrode CBPEC, the ORR appears as a constant increase in current with an onset at ~0 V as the transfer of electrons from DcMFc to the surface of Pw is no longer limiting (Fig. 6b, solid red line).
20
Fig. 6. Concentration of the organic electron donor species. (a) CVs were obtained with a 10
mM LiClO4 aqueous electrolyte and either 20 or 100 µM DcMFc present in the TFT organic
phase. Extending the potential window with 20 M DcMFc present in the TFT organic phase revealed a diffusion limited peak attributed to the oxygen reduction reaction (ORR). (b) On extending the potential window with 100 M DcMFc present in the TFT organic phase, the ORR was no longer diffusion limited and appeared as a constant increase in current. Scan rate used was 20 mVs–1. The full configuration for the 4-electrode CBPEC experiments is shown in Scheme 1. Pw was reductively pre-treated at –0.9 V vs. SHE prior to the 4-electrode CBPEC
experiments.
3.8 Observing the HER in a 4-electrode CBPEC with a high concentration of a reductant in the organic phase at a positively extended potential window
The HER demands a significant overpotential on a gold electrode immersed in 2 mM phosphate buffer solution. Extending the potential window with a 3-electrode cell, the onset potential for the HER on the gold mesh electrode occurred at –0.800 V vs. SHE (Fig. 7a). Also,
21
before any hydrogen production, the ORR was observed as a broad, asymmetric peak centered at 0 V vs. SHE (Fig. 7a). Referring back to section 3.1, while the HER occurs at more negative potentials than the ORR on the working electrode in a 3-electrode cell, the HER will occur at more positive potentials than the ORR on Pw in a 4-electrode CBPEC. Furthermore, as shown
in Fig. 6b, to clearly observe the ORR, and therefore also the HER, large concentrations of DcMFc in the TFT organic phase are required.
To demonstrate the potentials at which the HER takes place in a 4-electrode CBPEC experiment with a gold mesh electrode (reductively pre-treated at –0.9 V vs. SHE) as Pw and a
phosphate buffer solution, the positive edge of the potential window was extended significantly, and a large excess (> 1 mM) of DcMFc was dissolved in the TFT organic phase (Fig. 7b). During the forward scan, from negative to positive potentials, the onset of the current due to the ORR appeared at ~0 V and reached a maximum current at ~0.8 V in the extended potential window tested. During the backward scan, the ORR displayed an asymmetric CV profile, in accordance with the voltammetry recorded in a conventional 3-electrode cell (Fig. 7a). The onset of the HER with the 4-electrode CBPEC began at ~1.2 V (Fig. 7b), and displayed a resistive current profile. The latter is likely due to the large iR drop in the organic compartment and the diffusion of DcMFc to Po. At micromolar concentrations of DcMFc the
classic irreversible redox response of the HER is not observed with the 4-electrode CBPEC in the extended potential window tested in Fig. 7b.
22
Fig. 7. Observing the hydrogen evolution reaction (HER). (a) Extending the potential window
of CVs from a 3-electrode cell, obtained with a 2 mM phosphate buffer solution, to observe the H2 evolution reaction at the gold mesh working electrode. The scan rate used was 20 mVs–1.
(b) The CV was obtained with a 2 mM phosphate buffer solution and excess (>1 mM) DcMFc
present in the TFT organic phase at a positively extended potential window. The scan rate used was 100 mVs–1. The full configuration for the 4-electrode CBPEC experiment is shown in Scheme 1. Pw was reductively pre-treated at –0.9 V vs. SHE prior to the 4-electrode CBPEC
experiments.
3.9 Slow reduction (at fast scan rates) of the aqueous pole of the bipolar electrode after oxidative electrochemical pre-treatment at a negatively extended potential window in a 4-electrode CBPEC
As noted in section 3.5, after oxidative pre-treatment of Pw, when the CV is scanned
from –0.600 to +0.200 V in the 4-electrode CBPEC, only a tiny 40 mV potential variation takes place on Pw. This small potential variation is insufficient to reduce the passivating gold oxide
23
magnitude of the potential variation on Pw after oxidative pre-treatment, the potential window
in the 4-electrode CBPEC was extended negatively by 600 mV (from –1.200 to +0.200 V), with Li2SO4 as the aqueous electrolyte and 50 M DcMFc in the TFT organic phase (Fig. 8a).
Starting at –1.200 V and scanning positively, a large peak with a positive current attributed to the reduction of the gold oxide layer was observed with a peak maximum of –0.600 V. On the reverse sweep, oxide formation took place with a a very negative potential of –1.000 V. With each successive CV cycle, the characteristics of the voltammogram changed dramatically (see CV cycles 1, 3, 8 and 10 in Fig. 8a), as the electrode surface became gradually more reduced due to the oxide not fully re-forming on the reverse sweep. In other words, with each cycle Pw
exhibited more and more features typical of a reductively pre-treated gold mesh (Fig. 8b, solid line). Specifically, by the 10th CV cycle, the peaks at very negative potential due to the reduction and re-oxidation of the passivating oxide layer almost disappeared, a positive peak at –0.235 V appeared due to the reduction of hydroxide or oxide groups on the reduced gold mesh surface, and a peak with an onset potential at ~0 V appeared attributable to the ORR (Fig. 8b, dotted line). CVs after reductive pre-treatment of Pw, as shown in Fig. 8b, solid line, did
not vary with successive CV cycles. This indicates that the nature of the surface chemistry of the gold mesh did not change during the course of the 4-electrode CBPEC experiment.
For the experiment shown in Fig. 8a, the potential window of the oxidatively pre-treated gold mesh electrode acting as Pw was monitored using a multimeter and an auxiliary Ag/AgCl
pseudo-reference as an electric contact while the Galvani potential difference in the 4-electrode CBPEC was scanned from –1.200 to +0.200 V. Extension of the potential window negatively by 600 mV led to an increase in the magnitude of the potential variation on Pw after oxidative
pre-treatment, from +1.159 to +0.787 V during the first CV cycle. This 372 mV variation is significantly larger than the 40 mV variation seen for CVs scanned from –0.600 to +0.200 V in the 4-electrode CBPEC, as described in section 3.5. In line with the variation of the CVs shown in Fig. 8a, the potential window experienced by Pw with each CV cycle also changed
due to the gradual reduction of the gold mesh surface with each successive CV cycle, as summaried in Table S1, ESI, for the first 6 CV cycles. The latter was due to the larger potential variation on Pw being sufficient to reduce the passivating gold oxide film by promoting electron
transfer from DcMFc to the surface of Pw. Indeed, with each cycle the potential window
experienced by Pw approached that typical of a reductively pre-treated gold mesh (Table S1,
ESI). Also, in line with the invariant nature of the CVs after reductive pre-treatment of Pw (Fig.
24
measured as +0.725 to –0.062 V (Table S1, ESI). Furthermore, as observed using the smaller potential window in section 3.5, the potential variation on the reductively pre-treated Pw was
more wide-ranging, changing by a substantial 787 mV compared with the 372 mV experienced by the oxidatively pre-treated Pw.
Fig. 8. Slow reduction of the oxidatively pre-treated aqueous pole of the bipolar electrode. (a)
The CV was obtained with a 10 mM Li2SO4 aqueous electrolyte and 50 M DcMFc present in
the TFT organic phase at a negatively extended potential window. Pw was oxidatively
pre-treated at +1.2 V vs. SHE prior to the 4-electrode CBPEC experiments. The features on the CV changed with each successive CV cycle, as shown for CV cycles 1, 3, 8 and 10. (b) The same experiment as in (a) was performed except that Pw was reductively pre-treated at –0.9 V vs.
SHE prior to the 4-electrode CBPEC experiments (solid line). The scan rate used was 20 mVs–
1. The CV scan direction is indicated by the solid black arrows. The full configuration for the
25
The bipolar electrode in the 4-electrode CBPEC is an equipotential body and is typically considered to have a floating potential along Pw and Po [9]. However, for the experiments
described herein, the fact that the potential window on Pw barely changed after oxidative
pre-treatment when applying the short potential window (–0.600 to +0.200 V), means that “the floating potential” concept is not an entirely accurate description in this case. An understanding of how the potentiostat measures the difference of potential between the aqueous (𝐸ref.w ) and organic (𝐸ref.o ) reference electrodes is key. The organic reference electrode is sensing the aqueous solution through Pw, which undergoes modification during oxidative or reductive
pre-treatment, thus giving a different potential window in each instance. Furthermore, any dynamic changes in the surface chemistry of Pw during a 4-electrode CBPEC experiment will lead to
dynamic changes in how the organic reference electrode senses the aqueous phase.
We speculate that the very small potential window experienced by Pw is a consequence
of how the potentiostat in a 4-electrode configuration measures the potential of the aqueous compartment. When applying the short potential window (–0.600 to +0.200 V), after reductive pre-treatment of Pw, the potential measured between the aqueous and organic compartments in
the 4-electrode CBPEC (𝐸measured) can be expressed as follows, 𝐸measured = 𝐸ref.o − (𝐸ref.w + 𝑖𝑅dynamic)
(6) After oxidative pre-treament 𝐸measured is expressed as
𝐸measured = 𝐸ref.o − (𝐸ref.w + 𝑖𝑅constant)
(7) The surface chemistry, and iR drop (𝑖𝑅dynamic), is constantly evolving after reductive pre-treatment of Pw, whereas the oxide film and iR drop (𝑖𝑅constant) are stable after oxidative
pre-treatment of Pw unless a very negative potential (–1.200 to +0.200 V) is applied in the
4-electrode CBPEC. The latter leads to a subsequent evolution of the potential window experienced by Pw after oxidative pre-treatment with successive CV cycles, as shown in Fig. 8
and Table S1, ESI.
The experiment shown in Fig. 8a, monitoring the slow reduction of a passivating gold oxide layer and the resultant gradual appearance of redox responses due to electron transfer processes related to surface functional groups or the ORR, at a relatively fast scan rate of 20 mVs–1, is impossible to achieve using a gold mesh as a working electrode in a 3-electrode cell.
26
For the latter, the metallic working electrode acts as a source or sink of electrons. Thus, by potentiostatically tuning the Fermi level of the metal towards reduction, for example, the number of electrons that may be supplied to the surface of the metallic electrode is effectively unlimited and occurs instanteously. This means that in a single CV sweep all of the passivating gold oxide layer would be reduced, and the response of the working electrode instantly switched from that of a fully oxidised surface to that of a fully reduced surface. The detail of the processes occuring in the interim between the two extremes is lost. However, with a 4-electrode CBPEC, the reduction of the surface functional groups at Pw was severely delayed,
being dependent on the concentration of DcMFc in the organic phase for the number of electrons available to be shuttled to Pw and also by the diffusion of DcMFc to Po. Therefore,
the 4-electrode CBPEC allows the very gradual evolution of the surface chemistry of Pw, from
that characteristic of a fully oxidised surface to that of a fully reduced surface (or vice versa if an organic oxidant is introduced to the organic phase), to be monitored electrochemically.
Perspective work in this area will involve combining the 4-electrode CBPEC with in situ spectroscopic techniques, such as infra-red or Raman spectroscopy, to open a new line of research into the slow reduction (or oxidation) of electrode surfaces using relatively fast scan rates applied by the potentiostat. In this manner, surface processes such as gold nanoparticle nucleation and growth may be slowed down and controlled with exceptional precision by precisely feeding the number of electrons required to slowly reduce metallic salts at the surface of Pw through tuning the concentration of the reductant in the organic phase. Monitoring such
processes in situ using 4-electrode CBPECs integrated into scanning or transmission electron microscopy (SEM or TEM) holders is a particularly exciting prospect. Furthermore, if catalytic sites are present on Pw, the slow flow of electrons to these sites may provide a unique
mechanism to study the slow evolution of catalytic intermediates, such as during electrocatalytically activated CO2 reduction.
4. Conclusions
The primary focus of this article is to highlight the significant contribution of redox active functional groups on, and electrochemical modification of, the surface of the aqueous pole of a bipolar electrode on the observed voltammetry in a closed bipolar electrochemical cell (CBPEC) with a 4-electrode configuration and aqueous-organic electrolyte solutions. With low (< 20 M) concentrations of electron donating decamethylferrocene in the organic phase, redox active surface functional groups on the aqueous pole of the gold mesh bipolar electrode, such as hydroxide or oxide reduction and formation, appeared at 20 mVs–1. Typically these
27
redox responses are only seen at high scan rates (200 to 1000 mVs–1) on gold working electrodes in a 3-electrode cell, being obscured by capacitive currents at lower scan rates. However, the 4-electrode CBPEC configuration diminishes such capacitive currents.
The width of the potential window experienced by the aqueous pole is far shorter than that set by the potentiostat in the 4-electrode CBPEC. This is due to the assymmetric scan rates experienced at each pole of the bipolar electrode. Due to the far smaller iR drop in the aqueous phase relative to the organic phase, the scan rate at the aqueous pole is significantly slower than that applied by the potentiostat to the 4-electrode. The potential window experienced by the aqueous pole in the 4-electrode CBPEC, in terms of its position versus the standard hydrogen electrode and dynamic range, were also heavily influenced by oxidative or reductive pre-treatment. The electrochemical responses from the surface functional groups on the aqueous pole were seen to completely disappear after oxidative pre-treatment, but remained after reductive pre-treatment. This was due to the inability of the passivating gold oxide film formed after oxidative pre-treatment to act as an electron acceptor in the aqueous compartment (and maintain electroneutrality upon the flow of electrons along the bipolar electrode). By comparison, the surface functional groups on the reductively pre-treated gold mesh electrode were more electrochemically reversible and within the potential window experienced by the aqueous pole during the 4-electrode CBPEC experiment. The oxygen reduction reaction was typically only seen at higher (> 80 M) decamethylferrocene concentrations and at positive potentials. Weakly adsorbing perchlorate anions did permit oxygen reduction to be observed electrochemically at less positive potentials. The hydrogen evolution reaction also required significant concentrations of decamethylferrocene (> 1 mM) and a highly positive extension of the potential window to be observed. The voltammetry was resistive in nature due to the iR drop in the organic phase and slow diffusion of decamethylferrocene to the organic pole of the bipolar electrode.
In a 4-electrode CBPEC, reduction of the surface of the aqueous pole was kinetically slow, being dependent on the decamethylferrocene concentration for the number of electrons shuttled to the aqueous pole and the diffusion of decamethylferrocene to the organic pole. A negative extension of the potential window was required to initiate the reduction process for an oxidatively pre-treated gold mesh. From the viewpoint of perspective applications, and future fundamental studies, this observation is key. In effect, the slow flow of electrons from the organic electron donor to the surface of the aqueous pole facilitates a very gradual evolution of the surface chemistry, from fully oxidised to fully reduced. This slow reduction of the
28
surface of the gold mesh, at relatively fast applied scan rates of 20 mVs–1, is not possible by potentistatically polarising a working gold mesh electrode in a 3-electrode cell. Thus, changes in the surface chemistry, such as the nucleation and growth of metallic nanoparticles, reduction of redox active surface functional groups, or catalytic conversion of adsorbed molecular species (such as in CO2 reduction), may be monitored spectroelectrochemically with exceptional
precision by combining the 4-electrode CBPEC with aqueous-organic electrolyte solutions and techniques such as infra-red and Raman spectroscopy.
The electrochemistry of non-metallic indium tin oxide (ITO) electrodes is devoid of any redox active surface functional groups due to oxides or hydroxides, respectively. Thus, for 4-electrode CBPEC experiments that probe the electrochemistry of redox species in solution diffusing to the aqueous or organic poles, the use of ITO is highly recommended to avoid interfering electrochemical responses from metallic redox active functional groups. Alternatively, the aqueous pole may be metallic if it is electrochemically pre-oxidised and used with either an oxidant in the oil phase, or a reductant as long as the potential window in the 4-electrode CBPEC is not scanned too negatively.
Conflicts of Interest
There are no conflicts of interest to declare.
Acknowledgments
This publication has emanated from research by M. D. S. supported by the European Research Council through a Starting Grant (agreement no. 716792) and in part by a research grant from Science Foundation Ireland (SFI) (grant number 13/SIRG/2137). A. G.-Q. acknowledges funding received from an Irish Research Council Government of Ireland Postdoctoral Fellowship Award (grant number GOIPD/2018/252). A. G.-Q. and G. H. are grateful to the Agence Nationale pour la Recherche (Grant No. ANR-14-CE14-0002-01) for the partial financial support of this work. The authors are grateful to the support of the Irish Research Council and Campus France for travel support between the French and Irish groups through their joint ULYSSES programme. The authors would like to thank Dr Pekka Peljo (Aalto University, Finland) for fruitful conversations on the intricacies of operating a four-electrode closed bipolar electrochemical cell. Last but not least thanks to D. G. H. for being the best father ever.
29
The following is the Supplementary data to this article: Fig. S1. Image of the 4-electrode closed bipolar electrochemical cell (CBPEC) used in this study. Fig. S2. CVs obtained using a 3-electrode cell with 10 mM Li2SO4 and 10 mM LiClO4 aqueous electrolytes
and a gold mesh working electrode. Fig. S3. CVs obtained with a 2 mM phosphate buffer solution and no electron donor species present in the TFT organic phase, after either electrochemical oxidative (+1.2 vs. SHE) or reductive (–0.9 V vs. SHE) pre-treatment of the gold mesh electrode acting as the aqueous pole for 100 seconds. Fig. S4. CVs obtained with a 10 mM Li2SO4 aqueous electrolyte and 20 µM DcMFc present in the TFT organic phase after
electrochemical oxidative (+1.2 V vs. SHE) or reductive (–0.9 V vs. SHE) pre-treatment of the gold mesh electrode acting as the aqueous pole for 100 seconds. Fig. S5. CVs were obtained with a 2 mM phosphate buffer solution and 10 µM DcMFc present in the TFT organic phase. Comparisons were made when the the aqueous and organic poles were either platinum, or gold mesh electrodes (both without pre-treatment). Fig. S6. CVs were obtained with a 2 mM phosphate buffer solution, degassed with N2, and maintained under anaerobic conditions, and
10 µM DcMFc present in the TFT organic phase. The aqueous pole was investigated without pre-treatment, and after reductive and oxidative electrochemical pre-treatment. Table S1. Monitoring the potential window of the oxidatively or reductively pre-treated gold mesh electrode acting as the aqueous pole as the potetial window in the 4-electrode CBPEC was scanned from –1.200 to +0.200 V.
References
[1] G. Loget, D. Zigah, L. Bouffier, N. Sojic, A. Kuhn, Bipolar electrochemistry: from materials science to motion and beyond, Acc. Chem. Res. 46 (2013) 2513–2523. doi:10.1021/ar400039k.
[2] F. Mavré, R.K. Anand, D.R. Laws, K.F. Chow, B.Y. Chang, J.A. Crooks, R.M. Crooks, Bipolar electrodes: A useful tool for concentration, separation, and detection of analytes in microelectrochemical systems, Anal. Chem. 82 (2010) 8766–8774. doi:10.1021/ac101262v.
[3] J. Duval, J.M. Kleijn, H.P. Van Leeuwen, Bipolar electrode behaviour of the aluminium surface in a lateral electric field, J. Electroanal. Chem. 505 (2001) 1–11. doi:10.1016/S0022-0728(01)00461-2.
[4] L. Koefoed, S.U. Pedersen, K. Daasbjerg, Bipolar electrochemistry—A wireless approach for electrode reactions, Curr. Opin. Electrochem. 2 (2017) 13–17.
30
doi:10.1016/j.coelec.2017.02.001.
[5] D. Plana, G. Shul, M.J. Stephenson, R.A.W. Dryfe, The voltammetric response of bipolar cells: Mechanistic investigations of electroless deposition, Electrochem. Commun. 11 (2009) 61–64. doi:10.1016/j.elecom.2008.10.034.
[6] D. Plana, F.G.E. Jones, R.A.W. Dryfe, The voltammetric response of bipolar cells: Reversible electron transfer, J. Electroanal. Chem. 646 (2010) 107–113.
doi:10.1016/j.jelechem.2010.03.020.
[7] J.T. Cox, J.P. Guerrette, B. Zhang, Steady-state voltammetry of a microelectrode in a closed bipolar cell, Anal. Chem. 84 (2012) 8797–8804. doi:10.1021/ac302219p. [8] J.P. Guerrette, S.M. Oja, B. Zhang, Coupled electrochemical reactions at bipolar
microelectrodes and nanoelectrodes, Anal. Chem. 84 (2012) 1609–1616. doi:10.1021/ac2028672.
[9] A. Gamero-Quijano, A.F. Molina-Osorio, P. Peljo, M.D. Scanlon, Closed bipolar electrochemistry in a four-electrode configuration, Phys. Chem. Chem. Phys. 21 (2019) 9627–9640. doi:10.1039/C9CP00774A.
[10] D. Ibañez, A. Heras, A. Colina, Bipolar spectroelectrochemistry, Anal. Chem. 89 (2017) 3879–3883. doi:10.1021/acs.analchem.7b00856.
[11] N. Karimian, P. Hashemi, A. Afkhami, H. Bagheri, The principles of bipolar electrochemistry and its electroanalysis applications, Curr. Opin. Electrochem. 17 (2019) 30–37. doi:10.1016/j.coelec.2019.04.015.
[12] S.E. Fosdick, K.N. Knust, K. Scida, R.M. Crooks, Bipolar electrochemistry, Angew. Chemie - Int. Ed. 52 (2013) 10438–10456. doi:10.1002/anie.201300947.
[13] L. Bouffier, D. Manojlovic, A. Kuhn, N. Sojic, Advances in bipolar
electrochemiluminescence for the detection of biorelevant molecular targets, Curr. Opin. Electrochem. 16 (2019) 28–34. doi:10.1016/j.coelec.2019.04.004.
[14] W. Xu, K. Fu, P.W. Bohn, Electrochromic sensor for multiplex detection of metabolites enabled by closed bipolar electrode coupling, ACS Sensors. 2 (2017) 1020–1026. doi:10.1021/acssensors.7b00292.
[15] H. Xing, X. Zhang, Q. Zhai, J. Li, E. Wang, Bipolar electrode based reversible fluorescence switch using Prussian Blue/Au nanoclusters nanocomposite film, Anal.