HAL Id: hal-02998642
https://hal.archives-ouvertes.fr/hal-02998642
Submitted on 10 Nov 2020HAL is a multi-disciplinary open access archive for the deposit and dissemination of sci-entific research documents, whether they are pub-lished or not. The documents may come from teaching and research institutions in France or abroad, or from public or private research centers.
L’archive ouverte pluridisciplinaire HAL, est destinée au dépôt et à la diffusion de documents scientifiques de niveau recherche, publiés ou non, émanant des établissements d’enseignement et de recherche français ou étrangers, des laboratoires publics ou privés.
have bigger brains
Adrien Meguerditchian, Damien Marie, Konstantina Margiotoudi, Muriel
Roth, Bruno Nazarian, Jean-Luc Anton, Nicolas Claidière
To cite this version:
Adrien Meguerditchian, Damien Marie, Konstantina Margiotoudi, Muriel Roth, Bruno Nazarian, et al.. Baboons (Papio anubis) living in larger social groups have bigger brains. Evolution and Human Behavior, Elsevier, 2021, 42 (1), �10.1016/j.evolhumbehav.2020.06.010�. �hal-02998642�
Baboons (Papio anubis) living in larger social groups have bigger
brains
Adrien Meguerditchian, Damien Marie, Konstantina Margiotoudi,
Muriel Roth, Bruno Nazarian, Jean-Luc Anton, Nicolas Claidière
PII:
S1090-5138(20)30079-9
DOI:
https://doi.org/10.1016/j.evolhumbehav.2020.06.010
Reference:
ENS 6339
To appear in:
Evolution and Human Behavior
Received date:
3 February 2020
Revised date:
14 May 2020
Accepted date:
16 June 2020
Please cite this article as: A. Meguerditchian, D. Marie, K. Margiotoudi, et al., Baboons
(Papio anubis) living in larger social groups have bigger brains, Evolution and Human
Behavior (2020),
https://doi.org/10.1016/j.evolhumbehav.2020.06.010
This is a PDF file of an article that has undergone enhancements after acceptance, such
as the addition of a cover page and metadata, and formatting for readability, but it is
not yet the definitive version of record. This version will undergo additional copyediting,
typesetting and review before it is published in its final form, but we are providing this
version to give early visibility of the article. Please note that, during the production
process, errors may be discovered which could affect the content, and all legal disclaimers
that apply to the journal pertain.
Baboons (Papio anubis) living in larger social groups have bigger brains
Adrien Meguerditchianabc, Damien Marieab, Konstantina Margiotoudiab, Muriel Rothd, Bruno Nazariand, Jean-Luc Antond, & Nicolas Claidière*ab
a
Laboratoire de Psychologie Cognitive, UMR7290, Aix-Marseille Univ, CNRS, 13331 Marseille, France
b Station de Primatologie, UPS846, CNRS, 13790 Rousset, France
c Brain & Language Research Institute, Institute Language, Communication and the Brain, Université
Aix-Marseille, CNRS, 13604 Aix-en-Provence, France.
d Institut des Neurosciences de la Timone, Centre IRMf, UMR7289, Université Aix-Marseille/CNRS,
13005 Marseille, France
⁎ Correspondance to : Nicolas Claidière, Laboratoire de Psychologie Cognitive, UMR7290, Université Aix-Marseille/CNRS, 13331 Marseille, France. Email: nicolas.claidiere@normalesup.org
Abstract:
The evolutionary origin of Primates’ exceptionally large brains is still highly debated. Two competing explanations have received much support: the ecological hypothesis and the social brain hypothesis (SBH). We tested the validity of the SBH in (n=82) baboons (Papio anubis) belonging to the same research centre but housed in groups with size ranging from 2 to 63 individuals. We found that baboons living in larger social groups had larger brains. This effect was driven mainly by white matter volume and to a lesser extent by grey matter volume but not by the cerebrospinal fluid. In comparison, the size of the enclosure, an ecological variable, had no such effect. In contrast to the current re-emphasis on potential ecological drivers of primate brain evolution, the present study provides renewed support for the social brain hypothesis and suggests that the social brain plastically responds to group size. Many factors may well influence brain size, yet accumulating evidence demonstrates that the complexity of social life is an important determinant of brain size in primates.
Keywords: social brain, group size, brain size, baboon
Introduction
Two evolutionary hypotheses that propose to explain the exceptionally large size of Primate’s brains have received much empirical support (Dunbar, 1998), the ecological hypothesis (EH) and the social brain hypothesis (SBH). Both hypotheses assume that energetically costly increases in relative brain size were driven by selection for higher cognitive abilities (Aiello & Wheeler, 1995; Isler & van Schaik, 2006). However, the ecological hypothesis posits that higher cognitive abilities were demanded by novel types of foraging (DeCasien, Williams, & Higham, 2017; González-Forero & Gardner, 2018; Louail, Gilissen, Prat, Garcia, & Bouret, 2019). For instance, comparisons between folivorous and frugivorous primates have shown that frugivory is associated with an increase in relative brain volume (Clutton-Brock & Harvey, 1980; DeCasien et al., 2017). In contrast, the social brain hypothesis (SBH), originating from the Machiavellian intelligence
hypothesis, proposes that the increase in brain size has been driven by the cognitive demands of primate’s complex social life (Byrne & Whiten, 1988; Dunbar, 1998; Humphrey, 1976; see Whiten, 2018 for an historical account). The SBH is supported by a positive relationship between brain size and social group size across primate species, suggesting a constraint imposed by the brain volume on the size of social groups (Dunbar, 1992, 2009; Sawaguchi & Kudo, 1990). However, most
comparative studies supporting the ecological or the social hypothesis are correlational and were done across species. Since ecology, social life and group size are tightly linked in nature, the teasing apart of the different factors is difficult (Dunbar & Shultz, 2017; Healy & Rowe, 2007).
More recently, the SBH has been tested within primate species rather than across species (Dunbar, 2012). If social life is assumed to be the driving force behind the evolution of large brains, we should expect the brain to respond to changes in the social life of individuals through
neuroplasticity. Individuals with less social partners should therefore have less voluminous brains than individuals with more social partners. In humans, studies have shown that social network size significantly correlates with grey matter density of regions constituting the social brain (for a review see Adolphs, 2009), including the amygdala and posterior superior temporal sulcus (STS) (Bickart,
Wright, Dautoff, Dickerson, & Barrett, 2011; Kanai, Bahrami, Roylance, & Rees, 2012; Kwak, Joo, Youm, & Chey, 2018; Lewis, Rezaie, Brown, Roberts, & Dunbar, 2011; Powell, Lewis, Roberts, García-Fiñana, & Dunbar, 2012). Furthermore, in rhesus macaques (Macaca mulatta), Sallet et al. (2011) have shown that social network size correlates with the grey matter densities in some regions of the social brain (n = 23) and Noonan et al. (2014) have found that individual dominance status correlates with the density in some of these areas (n = 25).
The study of non-human primates in captivity is of prime importance because it allows to experimentally test the effect of social group size on brain volume in primates while controlling for ecological factors and other correlates of brain volume or social life. Consequently, the aim of the present study was to test the intraspecific predictions of the SBH regarding the relationships
between social group size and brain size in captive olive baboons (Papio anubis) while controlling for environmental and individual variables. We tested a large sample of captive olive baboons (n=82) to determine whether group size (range: 2—63 individuals) influences brain size (range: 117-189cm3) as measured through in vivo magnetic resonance imagery (MRI) acquisitions (see methods). We used enclosure size (range: 9—304m2) as an ecological control variable because home range size has been shown to have an influence on brain structures in primates (Clutton-Brock & Harvey, 1980;
Sawaguchi, 1990) and because other ecological factors, such as diet for instance, are controlled for in captivity. Furthermore, home range and social group size are tightly linked in nature and
substantially correlated in our sample (rτ = 0.60, z = 7.82, p<0.001). Enclosure size is thus an excellent
non-social ecological control variable for our study in captivity. We also used the volume of the cerebrospinal fluid (CSF) as a control for individual differences in morphology (such as body size).
Results
In a first analysis (Figure 1), we noted that the baboons’ overall brain volume was smaller
when they were housed with a small group in a small enclosure (the "Loge" enclosures in our facility) compared to when they lived in a larger group with a large enclosure (the "Parc" enclosures;
sided t-test, t(80)=-1.71,p=0.046). This small but significant difference observed at the time of scanning could potentially be explained by an effect of group size or enclosure size (or both) on brain volume.
Figure 1: the overall brain volume of baboons housed in small “Loge” enclosures is smaller than that of baboons housed in larger “Parc” enclosures. The dots represent each baboon’s brain size with the boxplot representing the group mean +/- SEM and the whiskers the 95% CI of the mean.
In order to tease apart these two variables and to confirm the effect of mean enclosure size and/or mean group size on brain volume, we used computerised daily records (introduced in 2011) to reconstruct the detailed history of each baboon’s group composition and enclosure size during the two years preceding the IRM scan.
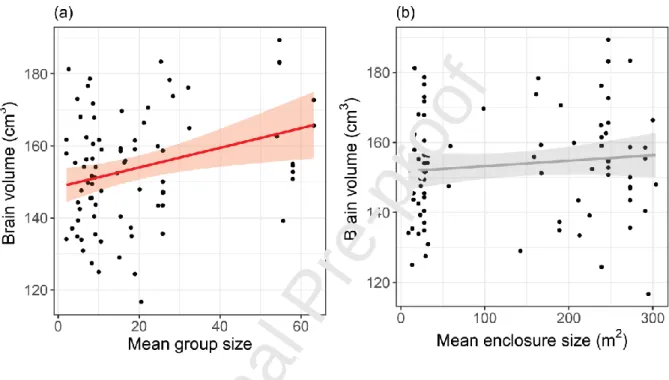
We found that brain volume displays a significant positive relationship with social group size
(Figure 2a; = 0.33, SE = 0.11, t = 2.90, p = 0.0048) but not with the non-social ecological control
(enclosure size), which shows only a small and not significant association (Figure 2b; = -0.015, SE =
0.018, t = -0.82, p = 0.41).
Figure 2: Social group size (a) but not enclosure size (b) influences brain size. Line and shaded area correspond to linear regressions with 95% CI. In red, significant association.
To test the robustness of our results we performed two follow-up analyses that showed remarkably consistent results (see ESM for further details). Firstly, we used records of yearly veterinary controls to reconstruct the group composition since 2008. This dataset is therefore sparser (because the position of the baboons is known only once in every year) but also covers a longer period (8 years) and the full history of 24 baboons. By running the same analysis as
previously, using these new records, we confirmed the presence of an effect of group size on brain volume ( = 0.28, SE = 0.12, t = 2.39, p = 0.019) as well as a lack of effect of enclosure size ( = -0.004, SE = 0.02, t = -0.22, p = 0.83). Secondly, we selected 20 individuals living in enclosures of highly variable sizes (99 to 304 m2) but with social groups homogenous in size (between 15 to 25
individuals) and a corresponding group of 18 individuals living in social groups of variable sizes (from 11 to 63 individuals) but in enclosures with similar sizes (200 to 250 m2). The results also confirmed that social group size ( = 0.38, SE = 0.16, t = 2.83, p = 0.030) but not enclosure size ( = -0.07, SE = 0.07, t = -0.10, p = 0.34) influence brain size for these sub-samples.
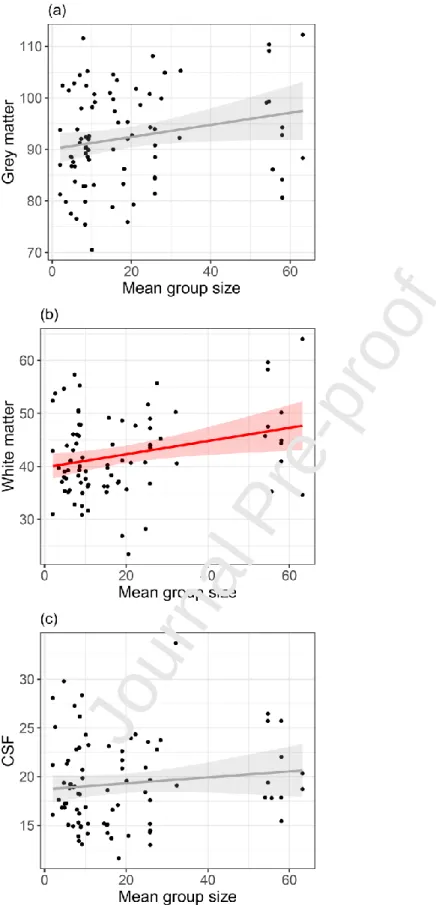
To determine whether social group size influences a specific component of brain size we tested separately its effect on the volume of white matter (WM), grey matter (GM) and
cerebrospinal fluid (CSF, used as a control). We found that social group size influenced WM volume overall (Figure 2a; = 0.14, SE = 0.045, t = 3.04, p = 0.0032) with a similar but marginally significant
tendency for GM volume (Figure 2b; = 0.098, SE = 0.055, t = 1.77, p = 0.080). As expected, social
group size did not influence CSF (Figure 2c; = 0.029, SE = 0.022, t = 1.32, p = 0.19).
Figure 3: Effect of social group size on grey matter (GM), white matter (WM), and cerebrospinal fluid (CSF, used as a control). Line and shaded area correspond to linear regression and 95% CI, respectively.
Discussion
Why are primate brains inordinately large? Two competing hypotheses (ecological and social) have both received empirical support but the correlational nature of the studies and the tight relationship between ecological and social variables in nature makes it difficult to draw definitive conclusions on the evolutionary origin of primates’ large brains (Dunbar & Shultz, 2017). To tease apart these two hypotheses we studied the effect of social group size on brain size in a large sample of captive olive baboons, while controlling for ecological factors (diet, enclosure size). The results show that brain volume and WM volume increase with social group size but not with enclosure area. Interestingly, although a similar tendency was observed for GM volume, the effect of social group size was only marginally significant. Importantly, we also included a control analysis of CSF volume and, as predicted, we did not find an effect of social group size on this variable.
Our results therefore provide novel evidence in favour of the SBH by demonstrating the effect of social group size on brain volume in a large sample of olive baboons. Importantly, this finding does not mean that other factors, such as environmental ones, should be excluded since they may also be important in nature (Dunbar & Shultz, 2017). However, our results provide clear
evidence that some social factors related to group size are critical determinants of brain size in primates. The origin of these social factors is still unclear. In humans, mentalizing abilities have been correlated both with social group size and brain size(Lewis et al., 2011; Powell et al., 2012). In non-human primates, socio-cognitive skills directly related to group size have also been documented, such as transitive reasoning (MacLean, Merritt, & Brannon, 2008), visual perspective taking (MacLean et al., 2013) or complex social representation (Seyfarth, Cheney, & Bergman, 2005). For instance, baboons have been found to be able to have a complex representation of the social structure of their groupmates, including the hierarchical classification of others according to both individual rank and kinship (Seyfarth et al., 2005). Interestingly, there is also converging evidence in birds suggesting that individuals living in larger groups develop more efficient socio-cognitive skills and have higher fitness as a consequence (Ashton, Ridley, Edwards, & Thornton, 2018).
Our findings also support the view that social group size affects brain volumes through neuroplasticity because in captivity baboons cannot freely choose to change social group depending on their social skills. In our facility, animal movements between groups were decided and reported by veterinarians and/or the behavioural manager and were related mostly to crowding. We
estimated that on average 1.5 animals changed their group per year for socially-related reasons (i.e. the social isolation of lowest ranking adult females) in a colony averaging 270 baboons (i.e. a yearly rate of 0.6%; see Methods for further details). Thus, in our study the relationship between social group size and brain volumes is most likely due to plastic brain changes in response to social factors related to group size. This neuroplasticity hypothesis is also supported by evidence showing that whole brain volume increases significantly after periods of high social interactions in elderly humans in randomized control trials (Mortimer et al., 2012). However, without further developmental data we cannot conclude on the direction of these changes ; it may be that brain size increases when individuals live in larger groups as a result of socialisation (as suggested by studies such as Joffe, 1997), and/or that it decreases for individuals living in smaller groups.
Finally, our results show that WM was the main driver of the effect of social group size on brain volume. This result is consistent with the recent emphasis on the role of WM in social cognition (see the review by Wang and Olson (2018). If social cognition places high demands on interaction between different parts of the social brain, such as the frontal lobe, temporal lobe and temporo-parietal junction, efficient connections between these functional units, in the form of large WM tacks, are to be expected. Previous studies with humans have shown for instance that
differences in WM tracks connecting the social brain can partly explain individual differences in social network size (Hampton, Unger, Von Der Heide, & Olson, 2016; Noonan, Mars, Sallet, Dunbar, & Fellows, 2018) and that the environment can induce changes in WM microstructure (Fields, 2010; Scholz, Klein, Behrens, & Johansen-Berg, 2009). Furthermore, Mars et al. (2016) have shown that white matter fibres crucial for social processing in humans are also present in macaques.
To a lesser extent, GM volume showed the same tendency than WM volumes. To assess the strength and reliability of the effect on GM volume, it would however be necessary to carry out supplementary analyses, such as a deformation-based , voxel-based, or surface-based morphometry analysis or GM quantification of regions of interest (ROI) and to compare the results to those found in other primates. This effect, if confirmed, could presumably be due to the effect of group size on key social brain regions (such as amygdala and STS; Bickart et al., 2011; Kanai et al., 2012; Kwak et al., 2018; Lewis et al., 2011; Powell et al., 2012; Sallet et al., 2011).
To conclude, our results show that monkeys living in larger social groups tend to have a larger brain. It would be interesting to study the consequences of differences in brain size on the socio-cognitive skills of individuals (such as inhibition for instance) to demonstrate a direct link between brain size and social competence. The development of automatic computerised techniques to study individual and social cognition may provide enough data in the future to perform such tests (Fagot et al. 2015). This effect shows that the social brain plastically responds to changes in social group size and social complexity. Our results therefore support the SBH more broadly: if larger social group sizes provide an evolutionary advantage, genes underlying the neuroplastic response to social life may have undergone strong positive selection over the course of primate evolution and may be excellent mechanistic candidates for the evolution of larger brains in primates.
Materials and Methods
Species and subjects
Olive baboons (Papio anubis, N=82 including 28 males, from 2 to 26 years old1.
The baboons lived in different social groups, including at least two adults and one or two adult males. Most of the baboons were born, and stayed, within their birth group. However, animal movements between groups happened before the study period for (1) subadult males when they reached sexual maturity, in order to avoid male-male conflicts or direct inbreeding, (2) weaned
1
Some information on the methods has been omitted to preserve anonimity
juveniles when enclosures had reached maximum capacity, (3) focal animals when specific
experiments required isolation from their initial groups, (4) low ranking adult females considered in danger because of the social pressure experienced in their group (i.e., social isolation, troubles to access food, high frequencies of conflicts). This latter case is the only situation in which the attribution of a baboon to a different group was based on their social behaviour. Nevertheless, to estimate the rate at which animal transfers happened for socially related reasons, we used recent records that were available from 2014 onwards. In the past 5 years, among an average colony size of 270 olive baboons, we found 9 individuals – 9 low ranking females - that were moved from one group to another for social reasons (a rate of 0.6% a year). Note that this estimate also includes transfers of baboons that stayed in groups of similar sizes (“Loge” to “Loge” or “Parc” to “Parc” transfers).
The monkeys had free access to outdoor areas connected to indoor areas. Enclosures were enriched by wooden platforms and vertical structures. Baboons were fed four times a day with monkey pellets, seed mixture, fresh vegetables and fruits. Water was available ad libitum.
MRI Image acquisition
Structural magnetic resonance images (MRI) were collected from a sample of 84 baboons (August 2013—January 2015) with a 3T imager MEDSPEC 30/80 ADVANCE (Bruker). Two individuals were removed from the study because we had only approximate date of birth. ESM Table 1
summarizes the sex, age, brain volume and enclosure size data for the sample studied.
High-resolution structural T1-weighted brain images were obtained with MPRAGE sequences (see SEM for details) when the subject was placed and maintained in ventral decubitus position. For each MRI session, subjects were immobilized by intramuscular injections of anaesthesia during transportation to the MRI facility. Anaesthesia was maintained during the MRI experiment with a drip irrigation setup under cardiovascular and respiratory monitoring. At the end of the MRI session, baboons were returned in their social group at the Station de Primatologie.
Image processing
Images were first (1) denoised using the Spatial Adaptive Nonlocal Means filter (SANLM), (2) skull stripped with the freely distributed Multi Atlas Skull Stripping software (MASS, http://www.cbica.upenn.edu/sbia/software/MASS/index.html) and (3) their intensity inhomogeneities corrected using the N4 algorithm (for an extensive description of the methods see Love et al., 2016) ; Images were then imported in BrainVISA 4.4.0 (BV) (http://brainvisa.info; Mangin et al., 2004), a sulcus-based morphometry software that allows the quantification of depth of the cortical sulci. The pipeline process of the BV Morphologist tool was used in order to successfully extract the brain volume for each subject including the GM, the WM and the CSF well as the sulci from the cortex after a series of steps (as fully described in Margiotoudi et al., 2019; see also the ESM).
Statistical analysis
We analysed separately the effect of group size and enclosure size on brain volumes using linear models (models’ details are presented in the ESM). Each model included a brain volume as dependent variable (either entire brain volume, GM, WM or CSF) and group or enclosure size, age and sex of the baboons as independent variables. Sex and age were included in models as mere nuisance variables (following previous studies; Bickart et al., 2011; Kanai et al., 2012; Kwak et al., 2018; Lewis et al., 2011; Noonan et al., 2014; Powell et al., 2012; Sallet et al., 2011).
All statistical analyses were realized on R version 3.5.1. Results were considered significant if p<0.05.
Acknowledgements
The project has received funding from the European Research Council (ERC) under the European Union's Horizon 2020 research and innovation program grant agreement No 716931 (716931 - GESTIMAGE - ERC-2016-STG, P.I. Adrien Meguerditchian), from the French “Agence
Nationale de le Recherche” (ANR-12-PDOC-0014-01, LangPrimate Project, P.I. Adrien
Meguerditchian) as well as from grants ANR-16-CONV-0002 (ILCB), ANR-11-LABX-0036 (BLRI) and ANR-11-IDEX-0001-02 (A*MIDEX).
We are very grateful to the CNRS Station de Primatologie, particularly the animal care staff and technicians, Jean-Noël Benoit, Jean-Christophe Marin, Valérie Moulin, Fidji and Richard Francioly, Laurence Boes, Célia Sarradin, Brigitte Rimbaud, Sebastien Guiol, Georges Di Grandi but also the vet Alice Bertello and the ethologues Pau Molina-Vila and Julie Gullstrand for their critical involvement in this project. We also thank Ivan Balansard, Sandrine Melot-Dusseau, Laura Desmis, Frederic Lombardo and Colette Pourpe for additional assistance.
Author contributions
Data availability
The data analysed in this article are freely available on the Open Science Foundation website, with the following DOI XXXXXXXX