Paleotectonic evolution of the Zürcher Weinland (northern
Switzerland), based on 2D and 3D seismic data
R
OBINM
ARCHANT1, Y
ANNR
INGGENBERG2, G
ÉRARDS
TAMPFLI2, P
HILIPB
IRKHÄUSER3, P
HILIPPER
OTH4& B
EATM
EIER4Key words: Zürcher Weinland, paleotectonics, Benken, 3D seismics, Permo-Carboniferous, Permian, Triassic, inversion, half-graben
ABSTRACT
A new interpretation of the Permo-Carboniferous (PC) troughs in the Zürcher Weinland region in northern Switzerland is proposed on the basis of 2D and 3D reflection seismic surveys. The presence of two WSW-ENE oriented grabens separated by a crystalline basement horst block, confirmed by the Benken borehole, is well established, though the presence of PC deposits in its surroundings remains uncertain. The interpretation of the 3D seismic data shows a transtensive tectonic regime for this period confirming the results of earlier interpretations of 2D-lines. There is no evidence for a compressive Saalian phase (around 265 Ma) as postulated for the PC trough west of Weiach. Several observed faults show signs of reactivation during a late Trias-sic inversion phase. Detailed mapping of the Mesozoic sequence reveals that further and minor reactivations along the border of the PC trough south of Benken may have influenced deposition of the younger sediments and the local structuration of the base-Tertiary unconformity. The findings of the local investigations are interpreted in the context of large-scale paleotectonic models.
ZUSAMMENFASSUNG
Anhand der Ergebnisse der 2D- und 3D- reflexionsseismischen Untersuchun-gen im Zürcher Weinland in der Nordschweiz wird eine Neuinterpretation des Permo-Karbons vorgeschlagen. Die Präsenz zweier WSW-ENE orientierter Grabenfüllungen, getrennt durch eine von der Sondierbohrung Benken bestä-tigte kristalline Hochzone, wird durch die Daten gut belegt. Vermutete weite-re Permo-Karbon-Vorkommen in der näheweite-ren Umgebung bleiben aber unsi-cher. Die Auswertung der 3D-seismischen Daten deutet auf eine transtensive Tektonik während dieser Zeit und liefert keine Hinweise auf eine kompressive Saalische Phase (etwa 265 Ma), wie sie für den Trog westlich von Weiach an-genommen wurde. Mehrere beobachtete Verwerfungen zeigen Merkmale einer Reaktivierung während einer spättriadischen Inversionsphase. Die De-tailkartierung der mesozoischen Sequenz lässt vermuten, dass spätere, gering-fügige Reaktivierungen entlang des Permo-Karbon Trograndes südlich von Benken Auswirkungen auf die Ablagerungsverhältnisse der jüngeren Sedi-mentschichten und auf die Ausbildung der Erosionsoberfläche an der Basis des Tertiärs hatten. Die Ergebnisse der lokalen Untersuchungen werden an-hand grossräumiger paläotektonischer Modelle interpretiert.
rock quality and good explorability. In 1991/92, 2D regional seismic profiles were acquired for a structural geological analy-sis of the formation over a large part of northern Switzerland. Based on these data, an area with little tectonic overprinting was mapped in the northern part of the canton of Zürich called the “Zürcher Weinland” (Naef et al. 1995). In 1997, this local investigation area was covered with a 3D seismic survey, en-abling high resolution imaging of the Mesozoic sedimentary rock sequence as well as lateral extrapolation of results from a deep borehole which was drilled in 1998/99 at Benken, in the centre of the area (Birkhäuser et al. 2001, Nagra 2001).
Introduction
The aim of the geoscientific investigation programme conduct-ed by Nagra (National Cooperative for the Disposal of Ra-dioactive Waste) in northern Switzerland is to evaluate an area potentially suitable for a repository of spent fuel, vitrified high-level and long-lived intermediate-high-level radioactive waste. To this end, several reflection seismic surveys and eight deep boreholes have been completed during the last twenty years (Diebold et al. 1991, Thury et al. 1994). In the last ten years, the focus has shifted from the crystalline basement to the sedi-mentary Opalinus Clay formation because of its supreme
host-1Musée cantonal de géologie, BFSH-2, 1015 Lausanne, Switzerland. E-mail: Robin.Marchant@unil.ch
2Institut de géologie et paléontologie, BFSH-2, 1015 Lausanne, Switzerland. E-mail: Yann.Ringgenberg@unil.ch; Gerard.Stampfli@unil.ch 3Nagra, Hardstasse 73, 5430 Wettingen, Switzerland. E-mail: philip.birkhaeuser@nagra.ch
4Proseis AG, Siewerdtstrasse 7, 8050 Zürich, Switzerland. E-mail: philippe.roth@proseis.com; beat.p.meier@proseis.com
0012-9402/05/030345-18 DOI 10.1007/s00015-005-1171-8 Birkhäuser Verlag, Basel, 2005
The present study, using the 2D and 3D seismic data from the local investigation area (Fig. 1), was undertaken in the con-text of a consulting work and a master’s degree thesis that was completed at the 3D seismic interpretation laboratory of Earth Sciences in Lausanne, using the CharismaTM
(Schlumberger-Geoquest) software. The principal aim of the project was to investigate the paleotectonics of the Permo-Carboniferous (PC) deposits and the Triassic-Liassic sequence. A further focus was the detailed mapping of the base-Tertiary unconfor-mity. Acquisition, processing and overall evaluation of the 3D survey are described in Birkhäuser et al. (2001) where some el-ements of the present study have been integrated and elabo-rated as part of a local structural model.
Location of the evaluated 2D and 3D reflection seismic surveys
Figures 1 and 2 show the geographical location of the 2D and 3D reflection seismic surveys used in this project. The 2D
sur-vey extends over some 1200 km2, covering four cantons
(Aar-gau, Schaffhausen, Thurgau and Zürich). The 3D seismic sur-vey is located in the ”Zürcher Weinland” just to the south of the city of Schaffhausen and covers an area of around 50 km2.
Geologically, the ”Zürcher Weinland” lies at the foot of the Tabular Jura mountains in the Molasse basin (Fig. 1). The un-derlying rocks dip around 4° to the SE and are not affected by major deformation. Within the 3D seismic investigation area, two main structures can be recognised from the reflection seis-mic data (Fig. 2). One is the NW-SE striking Neuhausen fault which forms the western margin of the Tertiary Bonndorf-Hegau-Bodensee graben zone. The structural interpretation reveals a fault throw of several decametres affecting the entire geological sequence from the Hercynian basement to the Qua-ternary deposits. Linked with the Neuhausen fault are a series of small scale “en échelon” faults within the E-W striking Wildensbuch flexure located some 700 m north of the Benken borehole. The second important structure is the E-W striking flexure of Rafz-Marthalen with the underlying northernmost
Fig. 1. Location and tectonic map of the studied area (after Müller et al. 2002). See Fig. 2 for seis-mic line names.
faults of the Permo-Carboniferous trough beneath Andelfin-gen.
Concerning the lithostratigraphy, Figure 3 shows the im-pedance log of the Benken borehole, together with the strati-graphic description. The Benken borehole did not encounter any PC deposits, in contrast to the boreholes of Weiach, Riniken and Kaisten which penetrated such sediments (Naef et al. 1995; Müller et al. 2002). Therefore, the question arose whether PC deposits could be expected elsewhere in the inves-tigated area. To this end, a detailed analysis of the seismic data was undertaken.
The Permo-Carboniferous
Seismic interpretation of Permo-Carboniferous deposits in Switzerland is a difficult task, as is evident from the large dif-ferences in interpretations of the same profiles published by different authors (e.g. Sprecher & Müller 1986, Laubscher 1987, Diebold et al. 1991; Gorin et al. 1993; Naef et al. 1995; Pfiffner et al. 1996; Sommaruga 1997; Erard 1999). This is mainly due to three reasons:
1. In the absence of boreholes, the origin of characteristically weak reflections below the Mesozoic is uncertain: they can
be either caused by Paleozoic sediments, shear zones and lithological contrasts within the basement, or alternatively, by seismic artefacts, such as multiples or remnants of re-flection point smearing caused by FK-filtering (a two di-mensional filter) or the migration of noise sections during data processing.
2. Where PC deposits are present, the base Mesozoic reflec-tion (BMz), which is not always well expressed, can be mis-taken for an internal PC reflection.
3. The structural interpretation is often uncertain, as faults below the Mesozoic cannot be traced along marker hori-zons on the seismic sections as is the case for the Mesozoic sedimentary layers.
2D seismic criteria for the recognition of PC deposits
Diebold et al. (1991, p. 171) discussed in extenso the recogni-tion problem of PC deposits but did not use seismic attributes, such as the reflection strength, a feature which proved to be very useful in this area. The reflection strength is also called the envelope in complex trace analysis where the seismic trace is considered to consist of a real and an imaginary part (Taner & Sheriff 1977; Taner et al. 1979). In this way, the reflection strength can be thought of as being proportional to the square
Fig. 2. Structural overview at the base Mesozoic level (modified after Birkhäuser et al. 2001), showing local structures observed on high resolu-tion 3D seismic data and the regional structures, mainly based on 2D seismic lines.
1300 1500 1600 1700 1400 1300 1400 1500 1600 1700 Inlines Crosslines Benken 91NO75 91NO61 91NO66 91NO68 91NO72 91NO79 91NO77 91NO73 91NO74 84NF65 Diessen-hofen Schaffhausen Andelfingen 280 270 690
N
M W Ne Ne Ne Ne Ne Ne 3 km Seismic line Regional structures: Local structures: Normal fault Thrust Normal fault Thrust Country border Flexure Rafz-Marthalen flexure Neuhausen fault Wildensbuch flexure M Ne Ne W Fig. 5Fig. 3. Benken borehole stratigraphy compared with geophysical data. BMm: base mittlere Malmmergel; BMz: Base Mesozoic; LMu: Lower Muschelkalk; TAnG: top Anhydritgruppe; TLe: top Lettenkohle; TLi: top Lias; TSa: top Salzlager; TSt: top Stubensandstein; TOpM: top Opalinuston with the Murchinsonae-Schichten; TMa: top Malm; UGi: Unterer Gipskeuper; WeDo: Wellendolomit. Timescale from Gradstein & Ogg (1996).
0.2 0.3 0.4 0.5 0.6 TMa TMa BMm TOp TOpM TLi TLi TSt TSt UGi UGi BMz WeDo WeDo LMu LMu TAng TAng TLe TLe TSa TSa TER TIAR Y MALM DOGGER Bathonian Portlandian Kimmeri. Oxfordian Bajocian Aalenian Hettangian Lower Muschel. Upper Muschel. Middle Muschel. LIASSIC KEUPER MUSCHELKALK BUNT. PA L EO. T wo way time (s) Lithostratigraphy & Impedance log
Horizons
Stratigraphy
Buntsandstein: green and white sandstones Orbicularis-Mergel: marls and sanstones Dolomit der Anhydritgruppe: laminated dolomites Hauptmuschelkalk: micritic limestones
Trigonodus-Dolomit: massive dolomites with oolithic layers Lettenkohle: dolomites and black clays
Gipskeuper: clays, dolomitic marls, dolomites and anhydrite Schilfsandstein: sandy clays and sandstones
Rhetian Opalinuston: silty clays, limestones, shaly marls
Murchinsonae-Schichten: oolithic limestones and silty to sandy clays Impressa-Mergel/Effiger Schichten: marls and limestones Quaderkalk/Massenkalk: biodetritic micritic limestones Plattenkalke: biodetritic micritic limestones Untere Süsswassermolasse (Lower freshwater Molasse)
Bohnerz Formation (Siderolithic): clays, iron pisoliths
Sinnemurian Pliensbach. Toarcian 248 237 234 231 229 205 180 176 159 154 65
Hercynian basement: migmatitic gneisses Mittlere Malmmergel: gray marls Formation name: description
Grenzkalke: sandy glauconious marls with iron-oolithic limestones Varians-Schichten: biodetritic marls
Parkinsoni-Württembergica-Schichten: silty to sandy marls
Subfurcaten-Schichten: fossiliferous iron-oolithic limestones Blagendi-Schichten: silty marls
Humphriesi-Schichten: fossiliferous iron-oolithic limestones
Wedelsandstein: sandstones, sandy marls, oolithic limestones Wohlgeshichtete Kalke: micritic limestones with thin marl layers
Hornbuck-Schichten: marls and limestones with sponges
Jurensis-Mergel: limestones and marls Posidonienschiefer: marls and limestones
Numismalis-Amalt.-Schichten: limestones and marls with belemnites Obtusus-Schichten: clays
Arientenkalk & Ang.-Schichten: shelly biodetritic limestones Psiloceras-Schichten: clays with sandstone lenses Rhät & Knollenmergel: clays and dolomitic marls
Stubensandstein: dolomitic breccia, sandy marls and sandstones Obere Bunte Mergel: dolomitic marls
Gansinger Dolomit: anhydrite
Carnian Norian
Obere Sulfatschichten: clays and anhydrite
Untere Sulfatschichten: clays and marls with anhydrite Saltzlager: salt, clays and anhydrite
Wellenmergel: silty marls and clays Wellendolomit: clays, dolomites and sandstones
Million years
Synthetic seismogr.
3D seismic profile west of the Benken borehole combined with the walkaway VSP profile (Birkhäuser et al. 2001, Fig. 3.3)
root of the total energy of the seismic wave at any given mo-ment. Thus, a maximum reflection strength associated with a series of events is more meaningful than merely the amplitude of the largest peak or trough of these events.
In an attempt to better differentiate between reflections originating from PC deposits and seismic artefacts, a number of criteria were established on the basis of seismic sections (Fig. 4 & 5). Other criteria will be discussed further on the basis of the 3D seismic data. Figure 4 shows the western end of the 2D seismic profile 91-NO-75 where a thick PC sequence has been completely penetrated by the Weiach borehole. Fig-ure 5 shows the situation at the Benken borehole where no PC deposits are present, although many reflections occur below the Mesozoic cover. On the basis of these two figures, the pres-ence of PC deposits can be characterised by:
– more continuous and higher frequency reflections, – many reflections which do not parallel the Mesozoic
se-quence, possibly owing to the presence of sedimentary structures such as channels or talus fans,
– some high amplitude reflections, corresponding to coal de-posits (between 1551 and 1752 m at Weiach, Fig. 4), – weak, low amplitude reflections at the base of the
Permo-Carboniferous deposits (the BPC horizon).
– and finally some strong and well-organised reflections throughout the sequence particularly visible in the reflec-tion strength displays.
The above criteria cannot be taken as absolute proof for the presence of PC sediments, but rather as indications which need to be combined with all the other available information (seis-mic grid lines, calibration wells, refraction seis(seis-mic, etc.) in order to establish whether or not PC deposits are indeed pre-sent.
3D seismic criteria for the recognition of PC deposits
East of Weiach, the PC deposits can be traced along the profile 91-NO-75 into the southern part of the 3D seismic survey. Therefore, a northern boundary of this PC trough must be pre-sent somewhere between this profile and the Benken
bore-Fig. 4. The regional 2D seismic profile 91-NO-75 at the Weiach borehole displayed in amplitude (left) and reflection strength (right). BPC: base of the Permo-Carboniferous. For location, see Fig. 1; see also legend of Fig. 3.
[ms] W [CDP] E TMa BMz BPC BMm TOp TSt UGi
hole. In order to locate this boundary, a number of different seismic attributes were generated in a sub-volume of the 3D data-set close to the BMz horizon. Figure 6 shows a selection of the extracted attribute maps.
The seismic amplitudes at 4 ms above the BMz horizon (Fig. 6a) are very different in the southern part of the survey (the triangular red area), most probably due to the onlap of basal Triassic sedimentary layers or minor fault displacements at the base of the Mesozoic. The same area also reveals high reflection strengths and strong amplitude events in the first 300 ms below the BMz horizon (Fig. 6 b & c), which could be due to sedimentary layers with high impedance contrasts, such as coals. The base Triassic isopach map (Fig. 6d) shows a thicker sequence in the same area. This may result from differential compaction of the PC deposits and/or a mild tensional reacti-vation of the PC graben during the deposition of the Buntsandstein. However the isopach of the Unterer Gipskeu-per to the top of the Salzlager interval is thinner in this area.
This is probably due to the onset of the slight Triassic inversion of the PC trough (see below) observed on some seismic sec-tions. The variance map (Fig. 6f) is less coherent in the SE area and highlights structural anomalies, such as an E-W feature that bounds the southern anomalous area to the north. This feature, referred to as the Rafz-Marthalen flexure (Fig. 2), seems to form the northern bounding fault system of a PC trough. Detailed analysis of all the 2D lines crossing the north-ern margin of this trough suggests that it corresponds to a fault zone with several segments separated by WNW-ESE trending younger faults (Diebold et al. 1991; Naef et al. 1995). The PC trough covered by the 3D seismic survey forms the eastern ex-tension of the PC trough that passes through Riniken and Weiach, referred to as the Riniken-Weiach trough or NPT (Nordschweizer Permokarbontrog) (Sprecher & Müller 1986; Diebold et al. 1991; Naef et al. 1995).
Figure 7 summarizes the various criteria which can be used to identify PC deposits. The basal Mesozoic series shows
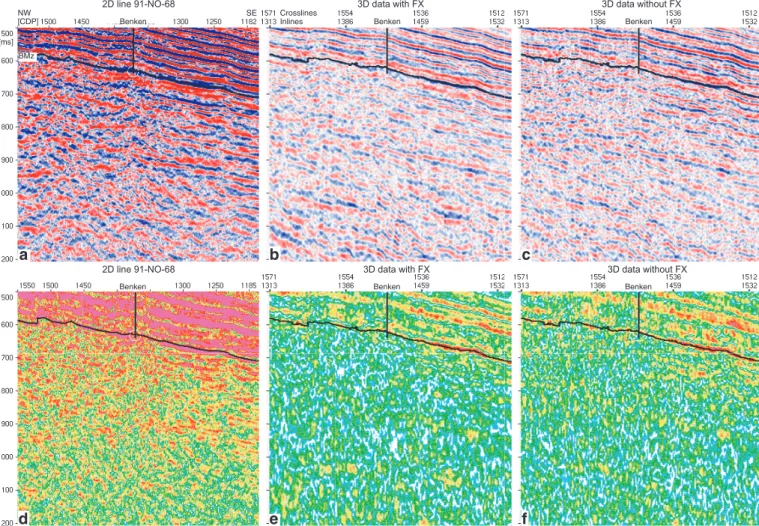
dif-Fig. 5. Comparison of seismic vintages at the Benken borehole displayed in amplitude (a–c) and reflection strength (d–f). a & d) The regional 2D seismic profile 91-NO-68. b & e) A random line from the 3D seismic survey passing along the 91-NO-68 line, processed with FX deconvolution. c & f) Same section as previous but without FX deconvolution. For location, see Fig. 2.
[ms] NW SE Inlines Crosslines [CDP] Benken Benken BMz
a
b
c
d
e
f
2D line 91-NO-68 2D line 91-NO-683D data with FX 3D data without FX
3D data with FX 3D data without FX
Benken
Benken Benken
ferential compaction above the PC trough and onlaps of both its flanks. Within the PC half-graben, which is bounded by a fault too steep to be seismically imaged, features such as chan-nels, internal unconformities, onlaps or fault truncations can be expected. However, the base of the trough does not coin-cide with a discrete reflector but is rather defined as a bound-ary between the low frequency – high amplitude discontinu-ous seismic facies, attributed to the PC series, and the essen-tially non-reflective seismic facies of the Hercynian basement. Nevertheless some high amplitude artefacts can be observed within this basement.
Structure of the Riniken-Weiach trough
As mentioned above, in the area between Weiach and Benken the Riniken-Weiach trough is bounded to the north by the Rafz-Marthalen fault zone underlying the Mesozoic sequence (in the overburden, this fault zone is expressed only as a gentle flexure, Fig. 2). To the south, the Riniken-Weiach trough is limited by the Baden-Irchel-Herdern lineament (Fig. 1) (Naef et al. 1995). At Weiach, the trough is about 8 km wide and just over 1 km deep (Diebold et al. 1991).
Figure 8 shows a profile section of the 3D seismic data, flat-tened at the Top Salzlager reflection in order to reconstruct the early Mesozoic geometry of this trough. In this display, the upper part of the PC trough is characterised by horizontal re-flections and a few structures that may be interpreted as chan-nels. The lower part of the trough shows dipping and less con-tinuous reflections. These two parts have been interpreted as
an initial rifting stage followed by a late rifting stage corre-sponding to the Untere and Obere Trogfüllung of Diebold et al. (1991), respectively.
The western PC trough at Riniken (Fig. 8) was previously interpreted (Laubscher 1986, 1987) as a graben intensively in-verted by transpressive tectonics during the Saalian phase (around 265 Ma). As shown in the inset in Figure 8, which is based on a line drawing of the 2D profiles NF-31 and 83-NF-30 near the Riniken borehole, an alterative interpretation is suggested: a half-graben with an initial syn-rift sequence, probably dominated by talus (or alluvial) fan sedimentation,
Fig. 6. Attribute maps highlighting features relat-ed to the presence of PC deposits in the southern part of the OPA-97 3D survey. a) Amplitude ex-traction 4 ms above the BMz horizon; blue: posi-tive; red: negative. b) Maximum value of the re-flection strength in a volume 300 ms below the BMz horizon; blue: low; red: high. c) Depth below the BMz horizon of the strongest amplitude in the same volume; blue: high; red: low. d) Isopach be-tween the top of the Wellendolomit and the base Mesozoic; blue: thick; red: thin. e) Isopach be-tween the Unterer Gipskeuper and the top of the Salzlager; blue: thick; red: thin. f) Variance (a function similar to coherence) along the BMz horizon; white: low; black: high.
N N N N N N
a
b
c
d
e
f
1 kmFig. 7. Schematic seismic section across a Permo-Carboniferous half-graben (in gray). Siblingen type Weiach type Benken type Transparent basement Basement with multiples Differential compaction PC reflectors & multiples Internal unconformity Channel structure Onlaps
Low frequency reflector, high reflection strengh
Fault truncation Onlaps
followed by a late-rift sequence with less active talus fans. The NPT is thus basically a half-graben and no intense transpres-sive tectonic event is needed to explain the reflector geometry. Such an interpretation fits well with recent geodynamic re-constructions (Stampfli 1996; Vavassis et al. 2000): during the Permo-Carboniferous, the slab roll-back of the western Pale-otethys induced the collapse of the Variscan orogen in south-ern Europe. This resulted in the opening of back-arc rifts in the active Eurasian margin, a situation quite similar to the Basin and Range province in America, as suggested by Diebold et al. (1991). Other authors (Ziegler et al. 2004) inter-pret this extensional phase as related to the transtensional re-activation of the Variscan orogenic fabric. In any case, the Saalian phase is thus basically an extensional tectonic phase, most probably formed in a sinistral transtensional regime (which does not exclude the possibility of some local trans-pression), and is not fundamentally a transpressive phase.
Mapping of the PC deposits
The Riniken-Weiach trough located south of the Benken bore-hole can be followed relatively easily from west to east along
the regional 2D seismic lines of 1991/92 and the 3D seismic survey (Fig. 9) on the basis of the above mentioned criteria. Although some uncertainties regarding the locations of the faults and the depth to basement remain, the presence of PC deposits in this trough can be assumed with certainty.
Just north of the 3D survey, the presence of another, small-er PC trough is indicated as it fulfils most of the critsmall-eria for PC deposits. This structure is referred to as the “Schaffhausen trough” (Fig. 9).
Outside the Riniken-Weiach and Schaffhausen troughs, the presence of PC deposits is uncertain. Figure 9 shows an isochron map of the depth to the basement for these two troughs and the presence of PC deposits beyond them, where it is suspected on the basis of 2D seismic lines. Particularly in the northern part of the 3D seismic survey some isolated high amplitude events below the Mesozoic may indicate the pres-ence of PC deposits although not all diagnostic criteria, as sum-marized in figure 7, are fulfilled.
A PC graben may be present along the 2D seismic profile 91-NO-68 between the Siblingen and Benken boreholes, that is also crossed by the 84-NF-65 profile, as suggested by the oc-currence of a thick reflective sequence below the base
Meso-Fig. 8. Profile section of the 3D seismic data with the TSa reflector flattened. The inset shows a reinterpretation of a line-drawing of the 2D pro-files 83-NF-31 and 83-NF-30 passing along the Riniken borehole. Inlines Crosslines TSt TSa BMz BPC Basement
Late rifting stage
Initial rifting stage
Channel ?
N
S
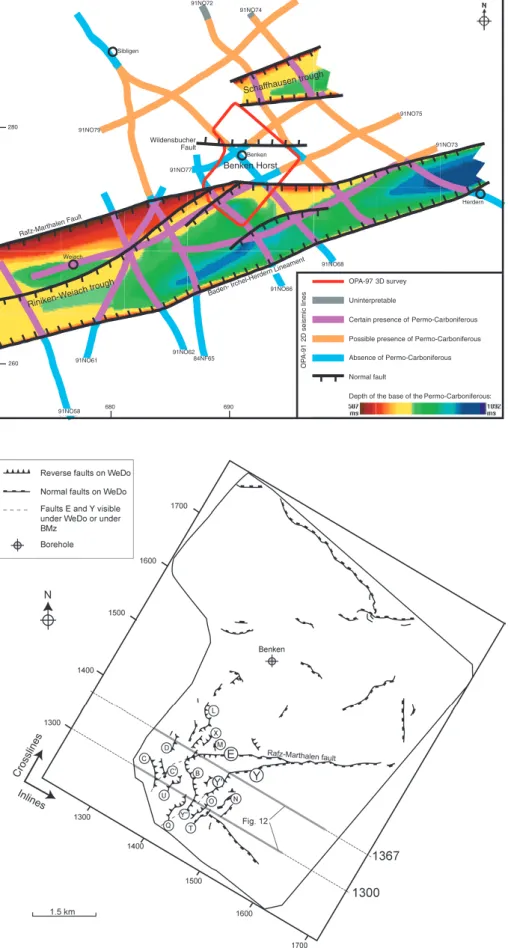
Basement Riniken 0.0 [s] 0.5 1.0 1.5 2.0 2.5 2 km Mesozoic Late rifting Initial rifting Basement Basement N SFig. 9. Isochron map of the BPC horizon where the presence of PC deposits is considered as cer-tain. Along some of the 2D seismic line segments, extending beyond the area of the established PC graben, some weak indications suggest the pos-sible presence of PC deposits.
Normal fault 280 260 680 690 Benken Horst Uninterpretable Baden-Irchel-Herdern Lineament Rafz-Marthalen Fault OPA-97 3D survey Riniken-W eiach trough Schaffhausen trough 91NO79 Weiach 91NO58 91NO61 91NO62 84NF65 91NO66 Sibligen Benken 91NO77 91NO68 91NO72 91NO74 91NO75 91NO73 Herdern Wildensbucher Fault
Certain presence of Permo-Carboniferous Possible presence of Permo-Carboniferous Absence of Permo-Carboniferous
OP
A-91
2D seismic lines
Depth of the base of the Permo-Carboniferous:
Fig. 10. Fault pattern of the seismic survey and location of the cross-lines of Fig. 12 (see also Fig. 4.23 in Birkhäuser et al. 2001).
zoic. However, the reflection strength display does not show any significant difference between the presumed graben and the Siblingen and Benken boreholes, neither of which encoun-tered PC deposits. Therefore, the presence of this graben re-mains speculative. The 2D seismic profile 91-NO-74 crosses both the Schaffhausen and the Riniken-Weiach graben with both of them fulfilling most of the PC criteria whilst the area between them does not show well-organised reflectors when viewed in reflection strength.
The Mesozoic
The interpretation of the Mesozoic sequence is based on the 3D seismic survey. The Triassic, Liassic and Dogger sequences were investigated in order to highlight paleotectonic features such as synsedimentary fault reactivation, differential subsi-dence and/or differential compaction across PC structures. For this purpose, the horizons Base Mesozoic (BMz), Wellen-dolomit (WeDo), Top Anhydritgruppe (TAnG), Unterer Gipskeuper (UGi), Top Liassic (TLi) and Top Opalinuston (TOpM) were mapped in detail, and the horizon Lower
Muschelkalk (LMu) was mapped on a few cross-lines to
pro-Fig. 11. a) Rose diagram for normal faults Y, E, T, N; b) Rose diagram for re-verse faults C, C’, D, B, X, O, L, Y’, Y’’, U.
Normal faults
Total data points: 28
Bucket size: 5 degrees
a)
Reverse faults
Total data points: 28
Bucket size: 5 degrees
b)
vide further constraints on the Triassic interval. For these hori-zons, time and attribute maps were generated. In a second step, a fault interpretation was carried out every 10 sections along inlines and cross-lines. In a third step, a detailed fault map (every 1 or 2 cross-lines) was developed for the S-W part of the 3D survey, as this area is affected by a number of small faults. Finally, vertical time thickness maps were constructed to analyse fault movements and their chronology.
Fault pattern and inversion activity
In the 3D seismic survey area, it is possible to distinguish two major types of faults, and potentially a third type: (1) normal faults, (2) normal faults that have been inverted and (3) re-verse faults. The fault pattern illustrated in Figure 10 shows two broad trends: one in E-W to NE-SW and the other in NW-SE direction. These trends are highlighted by two rose dia-grams (Fig. 11): one (a) for the normal faults and the other (b) for the inverted faults. In order to obtain a statistical represen-tation of the fault orienrepresen-tations, a strike value was read every 300 m along each fault that cuts the WeDo horizon.
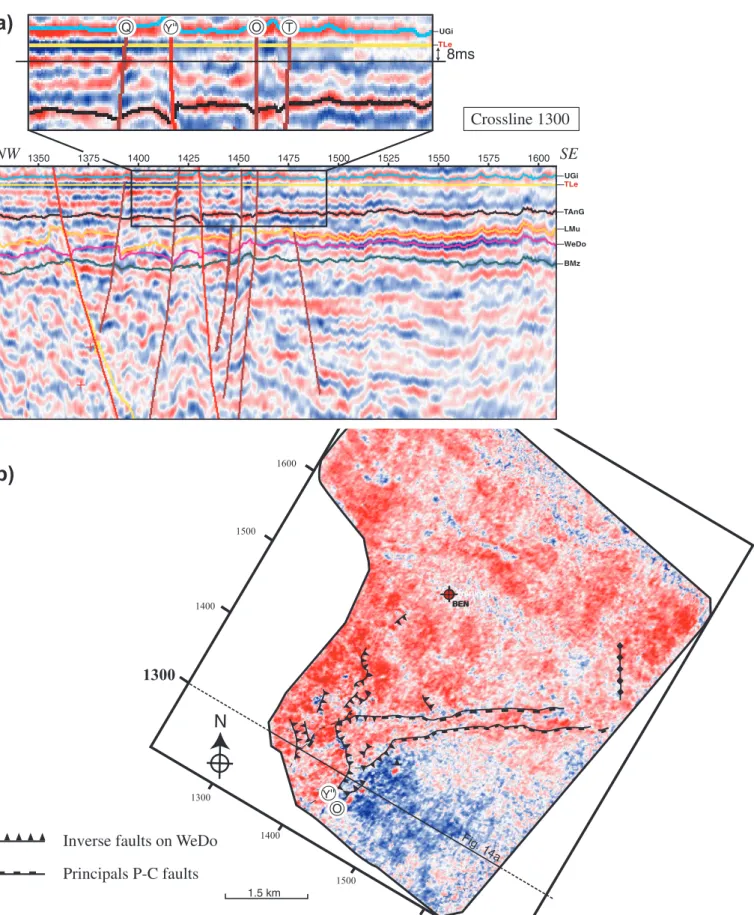
Most inverted faults are in fact normal faults that were re-activated during a tectonic inversion phase (see below). The following selected cross-sections from the 3D seismic survey show the geometry of the mapped faults along uninterpreted and interpreted cross-line sections (Fig. 12):
– Cross-line 1300: The inverted configuration of the Y” and C faults across the BMz to TSt horizons (and even to TLi) appears clearly. At greater depths, these faults seem to de-limit the Riniken-Weiach PC trough. It is thus evident that parts of these main PC faults were mildly reactivated by tectonic inversion.
– Cross-line 1367: The inverted D fault diverges from the main orientation of the PC trough whilst the Rafz-Marthalen fault E also shows evidence for inversion. It is difficult to establish whether all of the reverse faults al-ready existed as normal faults prior to the inversion phase. Nevertheless, it seems that the Y” and C faults were associated with the main faults of the PC trough. At the LMu level upon flattening of some cross-lines, it became evident that faults C and U had a normal throw prior to their inversion whereas other faults lacked such a pre-inversion normal offset. Corre-spondingly, the latter presumably developed during the inver-sion process.
The following structural and sedimentological evidence was used to establish the fault chronology:
Structural evidence: by force-flattening seismic sections at selected reflectors, it was possible to follow the fault evolution step by step and to check whether a given fault was activated during a certain time interval and, if so, to establish its sense of movement. Figure 13 shows an extensive analysis of cross-line 1300 on the base of flattening a sequence of seismic marker horizons. In Figure 13a, the horizon LMu was flattened and nearly all faults display a normal configuration. Figure 13b,
which is flattened at the UGi horizon, shows first signs of in-version movements with a small positive flower structure ap-pearing between faults Y” and O. In Figure 13c, with the TSt horizon flattened, the inversion tectonics are more intensive
but have apparently died out in Figure 13d, that is flattened at the TLi horizon, with only the fault Y” still showing slight ac-tivity. In view of the above, the inversion process was active between the middle Muschelkalk and the earliest middle
per (more or less during Ladinian to middle Carnian times) and the fault throws are in the order of a few tens of meters.
Sedimentological evidence: during the main activity of the faults, the upthrown block was partly eroded or deposition was either reduced; conversely, sedimentation increased in the footwall. This phenomenon can be observed in many places, for example along cross-line 1300 where an additional seismic loop can be seen NW of the Y” fault between the TAnG and the TLe horizons. Figure 14 shows an amplitude extraction 8 ms under the TLe horizon, which demonstrates that this seis-mic loop (appearing on the profile as a negative amplitude dis-played in red) is absent in the southern part of the survey area,
and is limited by the Y fault (including Y’ and Y’’). It is thus assumed that the rock sequence – represented by this negative seismic loop in the rest of the survey area – has been eroded in the southern part during the reverse reactivation of the Y fault system.
Base-Tertiary unconformity
As shown in the lithostratigraphy of the Benken borehole (Fig. 3), the Tertiary siderolithic Bohnerz Formation directly overlies upper Malm limestones. This erosional unconformity is well known all along the Alpine foreland basin from France
Fig. 13. Tectonic history on cross-line 1300 revealed by horizon flattening. a) LMu flattened, Anisian-Ladinian limit, 234 My; b) UGi flattened, Lower Rhetian, 219 My; c) TSt flattened, Upper Rhetian, 210 My; d) TLi flattened, Lias-Dogger limit, 180 My.
Fig. 14. a) Cross-line 1300 flattened at the TLe marker and a zoom-up (inlet) showing the change in seismic facies mainly taking place at the Y’’ fault. b) Ampli-tude extraction map of the investigation area, allowing location of the facies transition along the southernmost mapped faults.
N
13001300
1500 1600 1700 1400 1400 1500 1600 BEN BEN 1.5 kmInverse faults on WeDo
Principals P-C faults
b)
O Y'' Fig. 14a WeDo LMu TAnG BMz UGi TLe UGi TLe 1350 1375 1400 1425 1450 1475 1500 1525 1550 1575 1600Crossline 1300
NW
SE
O T Y'' Q 8msa)
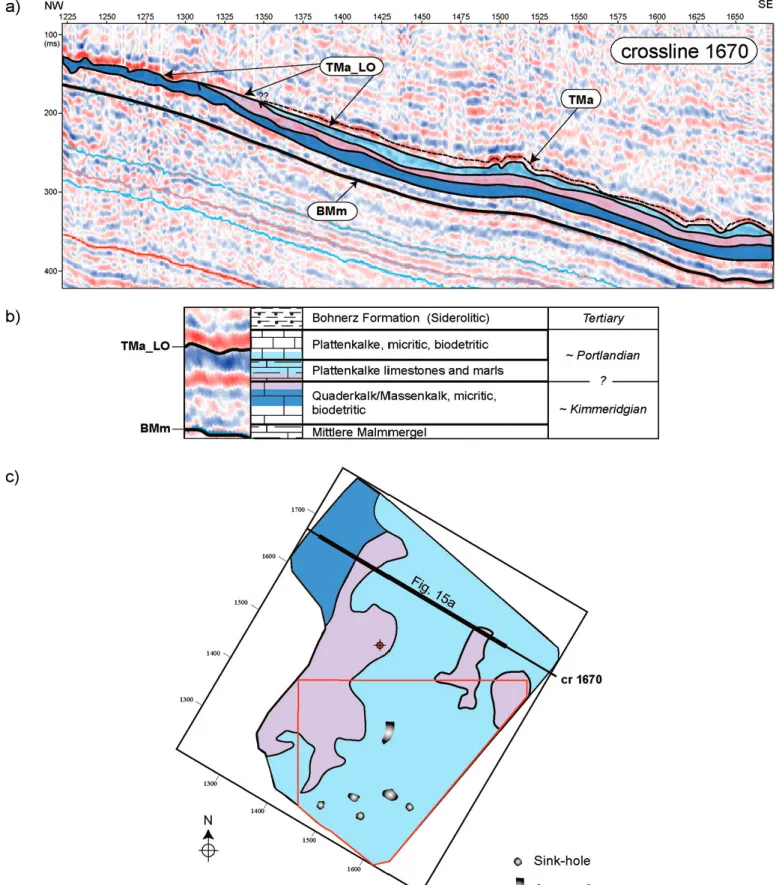
Fig. 15. a) Cross-line 1670 with the interpretation of the seismic horizons Top Malm zero (TMa_L0), Top Malm (TMa) and Base middle Malmmergel (BMm). b) Seismic and lithostratigraphic log sequence. c) Base Tertiary subcrop map of the investigation area. The red frame-line shows the extent of the vertical time thickness map displayed in Figure 16.
to Austria and is considered to be the result of the Tertiary flexural fore-bulge event (Karner & Watts 1983, Allen et al. 1986, Allen et al. 1991) or of lithospheric buckling (Ziegler et al. 2002).
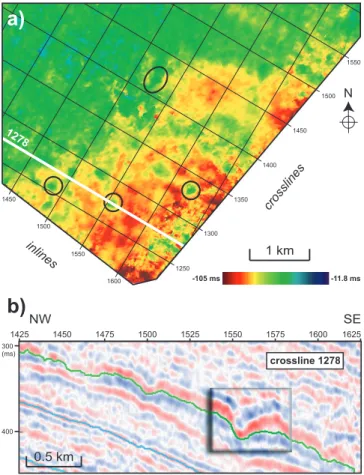
Using Nagra’s Zürcher Weinland 3D seismic survey this unconformity was mapped in an effort to highlight erosional structures, such as karst features or channels, and to develop a map of the subcropping Malm series. Apart from mapping seismic reflections, amplitude extraction and vertical time thickness maps were established.
Figure 15 shows the seismic expression of the unconformity and the pattern of subcropping Malm series. The eastern limit of the dark blue pattern is interpreted to represent a cuesta. The map also highlights observed paleokarst features and a canyon-like channel, located in the south-eastern part of the survey area. The vertical time thickness map between TMa and BMm of the southern part of the survey area (Fig. 16) shows that these karst features are nearly circular and corre-spond to sink-holes, with widths of some 100–200 m and depths of some 30–40 m. The presence of Eocene paleokarst features is not surprising and is well known in the Jura Moun-tains, the Molasse Basin and the Helvetic Alps (e.g. Von Tavel
1937; Weidman 1984; Trümpy 1980), where they are associated with siderolithic deposits.
Another interesting feature on the vertical time thickness map of Figure 16 is that the thickening of the TMa – BMm in-terval over the southern part of the survey area (displayed in yellow to red colours) is limited to the north by the Rafz-Marthalen fault (Fig. 9). This may be related either to com-paction of the sedimentary infill of the PC Riniken-Weiach graben, or to the reactivation of the northern border fault of the PC graben during the Malm.
Geodynamic evolution of the Zürcher Weinland
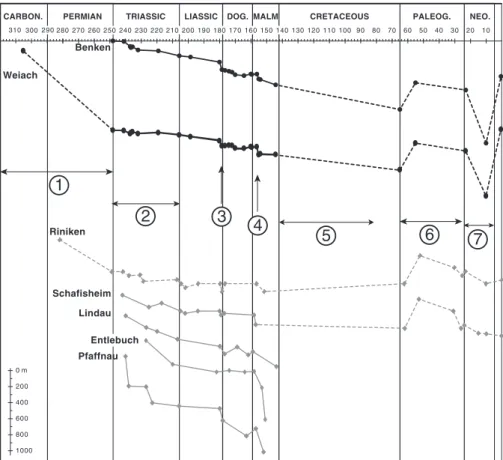
The geodynamic evolution of the Zürcher Weinland can now be refined with the aid of subsidence curves and paleotectonic mod-els. For this purpose, two subsidence curves based on the Benken and Weiach borehole data have been constructed, and paleotec-tonic reconstructions by Stampfli et al. (2003) have been used to illustrate the geodynamic situation on a larger scale.
The two subsidence curves of the Benken and Weiach boreholes are shown in Figure 17, together with others from the Molasse basin taken from Allia (1996, 2003; Riniken and Schafisheim) and Wildi et al. (1989; Lindau, Entlebuch and Pfaffnau). Seven events on these curves are highlighted and discussed here.
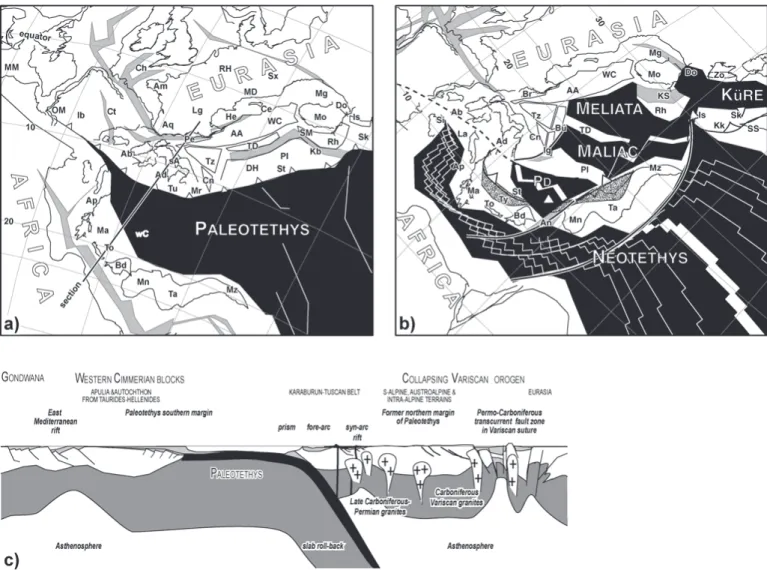
1) Permo-Carboniferous times are characterized by strong subsidence for the Weiach and Riniken curves, related to the development of the PC graben during the collapse of the Variscan cordillera. As shown in Figure 18 a & b, this collapse can be linked to the slab roll-back of the western Paleotethys. This occurred in a transtensional regime relat-ed to the dextral translation of Gondwana relative to Eura-sia (Ziegler et al. 2004).
2) Except for Pfaffnau, the Triassic reveals a low subsidence rate that could be interpreted as the thermal subsidence of the Maliac and Meliata oceans (Fig. 18b). Some curves like Weiach and Schafisheim show a slight uplift which could be related to the inversion phase that also affected the south-western corner of the Zürcher Weinland investigation area. Paleotectonic reconstruction in late Carnian times (Fig. 18b) provides some explanations for such compressional constraints, as the western end of the Paleotethys was clos-ing (Eocimmerian phase: Stampfli et al. 2002). In Europe, the Eocimmerian phase is characterised by the collision of the Adria and Apulia plates. This is seen in the geological record as an unconformity and deposition of the Tuscan Verrucano in Italy.
3) On all curves, except Riniken and Entlebuch, a sharp sub-sidence event at the beginning of the Dogger can be related with the opening of the Alpine Tethys (Stampfli et al. 1998, 2002).
4) Oxfordian times show a systematic tectonic subsidence ac-celeration interpreted as the transtensive phase of the Pyrenean rift (Stampfli 1993, Stampfli & Marchant 1997,
Fig. 16. a) Base Tertiary unconformity to BMm marker vertical time thickness map (ms). b) Cross-line section showing a well expressed karst feature (inlet).
1600 1250 1300 1350 1400 1450 1500 1550 1500 1450 crosslines inlines 1550 1278 -105 ms -11.8 ms 300 400 (ms) crossline 1278 1425 1450 1475 1500 1525 1550 1575 1600 1625
a)
b)
N 1 km 0.5 km NW SEStampfli et al.1998, 2002), that could have reactivated faults of the Liassic rifting.
5) Cretaceous times were affected by the subsidence of the Helvetic margin. In all these boreholes, Cretaceous sedi-ments are absent, but, on the basis of regional geology, they must have been deposited and then eroded during the Tertiary (Trümpy 1980, Ziegler 1988).
6) This uplift is interpreted as the result of a flexural bulge that allowed Cretaceous sediments to be eroded, resulting in a general lithospheric buckling (Ziegler et al. 2002). Some studies show that this uplift was around 500 m (Burkhard & Sommaruga 1998, Schegg & Leu 1998). 7) After the flexural bulge, the strong subsidence is due to the
north-west progression of the flexural trough and the Mo-lasse deposition.
Conclusions
The interpretation of reflection seismic data from the Zürcher Weinland area has established the presence of two sediment filled PC troughs, which trend WSW-ENE: (1) the long and deep Riniken-Weiach trough in the southern part, and (2) the smaller Schaffhausen trough in the northern part. In surround-ing areas, the presence of PC deposits can be suspected, but re-mains speculative.
These results were based on a detailed analysis of the seis-mic signature of the PC troughs. On 2D seisseis-mic lines, PC de-posits tend to show a strong reflectivity strength compared to the crystalline basement. With a 3D survey, several other seis-mic attributes help to identify the presence or absence of such a graben, in particular attribute maps highlighting differential compaction.
Based on the data available for this study, the occurrence of a strong transpressional Saalian phase (265 Ma) in the PC trough, as postulated by Laubscher (1986 & 1987) cannot be confirmed. The PC troughs were rather formed in an exten-sional regime, possiblyin a back-arc regime accompanying the collapse of the Variscan cordillera, with syn-rift deposits dur-ing a Carboniferous to Early Permian phase, and followed by a post-rift phase in the Late Permian.
The detailed fault studies, combined with thickness vari-ations, show that a slight tectonic inversion affected the 3D seismic investigation area during middle Triassic to earliest Late Triassic times, with a main event at around 230 My, the evidence of which is seen in a missing seismic loop (Fig. 14). This tectonic event reactivated Permo-Carbonifer-ous structures (inversion of normal faults) and created some new reverse faults associated with small positive flower structures. The fault throws do not exceed a few tens of meters.
Fig. 17. Compilation of subsidence curves (modi-fied from Allia 1996, Wildi et al. 1989) in the Alpine foreland using the timescale from Grad-stein & Ogg (1996). Numbers 1 to 7: events dis-cussed in text. 10 20 30 40 50 60 70 80 90 100 110 120 130 140 150 160 170 180 190 200 210 220 230 240 250 260 270 280 290 300 310
CARBON. PERMIAN TRIASSIC LIASSIC DOG. MALM CRETACEOUS PALEOG. NEO.
1
2
3
4
5
6
7
Benken Weiach Pfaffnau Lindau Riniken Schafisheim Entlebuch 0 m 200 400 600 800 1000The 3D seismic data reveal that weak reactivations of the Rafz-Marthalen fault system, underlying the Mesozoic se-quence, possibly influenced Tertiary karstic erosion in the southern part of the investigation area. Erosional features, such as sink-holes or channels are observed along the base-Tertiary unconformity.
Based on 3D seismic records acquired over an area of 50 km2, it was possible to deduct a number of interesting and new
local facts related to regional pre-Alpine and Alpine geology, showing the amazing amount of information which can be drawn from such data-sets when interpreted with powerful computer tools.
Acknowledgements
The authors thank Nagra for allowing them to use and publish seismic data and borehole information for this academic study. They are also very grateful to Nagra, to the Institute of Geology and Paleontology of the University of Lausanne and to the “Foundation du 450ème anniversaire de l’UNIL” for financial support covering the publication expenses. Schlumberger-Geoquest is thanked for providing the GeoFrame-CharismaTMsoftware used for this study. This paper benefited from the reviews of Stefan Schmid, Anna Sommaruga and Peter A. Ziegler.
Fig. 18. Paleotectonic reconstructions in the Mediterranean area (Stampfli et al. 2003). a) Sakmarian map (280 My); b) Late Carnian (220 My); c) Late Permian cross-section located in a). A star locates the studied area in a) and b). AA: Austroalpine east; Ab: Alboran; Ad: Adria; Am: Armorica; An: Antalya; Ap: Apulia s.str.; Aq: Aquitain; Bd: Beydaglari; Br: Briançonnais; Bü: Bükk, Fatric; Ce: Cetic; Ch: Channel; Cn: Carnic; Ct: Cantabria; CP: Calabria, Peloritani; Cv: Canavese; DH: Dinaro-Hellenic; Do: Dobrogea; He: Helvetic rim basin; Hk: high karst; Ib: Iberia central; Ig: Igal; Is: Istanbul; Kb: Karaburun; Kk: Karakaya; KS: Kotel-Strandja; La: Lagonegro; Lg: Ligerian; Ma: Mani; MD: Moldanubian; Mg: Magura; MM: Meseta Morocco; Mn: Menderes; Mo: Moesia; Mr: Mrzlevodice fore-arc; Mz: Munzur; OM: Ossa-Morena; PD: Pindos; Pe: Penninic; Pl: Pelagonian; Rh: Rhodope; RH: Rheno-Hercynian; sA: southern Alps; Sb: sub-Betic rim basin; Se: Sesia, Austroalpine west; Si: Sicanian basin; Sk: Sakarya; SM: Serbo-Macedonian; SS: Sanandaj-Sirjan; St: Sitia; Sx: Saxothuringian; Ta: West-Taurus; TD: Trans-Danubian range; To: Taleo Ori; Tt: Tatric; Tu: Tuscan nappes; Ty: Tyros; Tz: Apuseni, Tizia; wC: western Crete; WC: Western Carpathian; Zo: Zonguldak.
REFERENCES
ALLIA, V. 1996: Sedimentologie und Ablagerungsgeschichte des Opalinustons in der Nordschweiz. PhD thesis Univ. Basel, 185 p.
ALLEN, P.A., HOMEWOOD, P. & WILLIAMS, G. 1986: Foreland basins: An in-troduction. In: Foreland basins (Ed by P. A. ALLEN ANDP. HOMEWOOD) Internat. Assoc. Sedimentol. Spec. Publ. 8, 3–12.
ALLEN, P.A., CRAMPTON, S.L. & SINCLAIR, H. D. 1991: The inception and early evolution of the North Alpine Foreland Basin, Switzerland. Basin Research 3, 143–163.
BIRKHÄUSER, PH., ROTH, PH., MEIER, B. & NAEF, H. 2001: 3D-Seismik: Räum-liche Erkundung der mesozoischen Sedimentschichten im Zürcher Wein-land. Nagra Tech. Ber. NTB 00-03. Nagra, Wettingen, 158 p.
BURKHARD, M. & SOMMARUGA, A. 1998: Evolution of the western Swiss Mo-lasse Basin; structural relations with the Alps and the Jura Belt. In: Ceno-zoic foreland basins of Western Europe. Geol. Soc. London, Spec. Pub. 134; 279–298.
DIEBOLD, P., NAEF, H. & AMMANN, M. 1991: Zur Tektonik der zentralen Nordschweiz: Interpretation aufgrund regionaler Seismik, Oberflächen-geologie und Tiefbohrungen. Nagra Tech. Ber. NTB 90-04, Nagra, Wet-tingen, 277 p.
ERARD, P.-F. 1999: Traitement et interprétation de cinq lignes de sismique réflexion à travers le Plateau molassique et les Préalpes suisses, de Bienne à Lenk. PhD thesis, Univ. Lausanne, 109 p.
GORIN, G.E., SIGNER, C. & AMBERGER, G. 1993: Structural configuration of the western Swiss Molasse basin as defined by reflection seismic data. Eclogae geol. Helv. 86, 693–716.
GRADSTEIN, F.M. & OGG, J. 1996: A Phanerozoic time scale. Episodes 19, 3–5. KARNER, G.D. & WATTS, A. B. 1983: Gravity anomalies and flexure of the
lithosphere at mountain ranges. J. Geophys. Res. 88, 10449–10477. LAUBSCHER, H. 1986: Expertenbericht zum Projekt Gewähr: Struktur des
Grundgebirges und des Paläozoikums der Nordschweiz. Bundesamt für Energiewirtschaft, Hauptabteilung für die Sicherheit der Kernanlagen, Würenlingen.
– 1987: Die tektonische Entwicklung der Nordschweiz. Eclogae geol. Helv. 80/2, 287–303.
MÜLLER, W.H., NAEF, H. & GRAF, H.R. 2002: Geologische Entwicklung der Nordschweiz, Neotektonik und Langzeitszenarien Zürcher Weinland. Nagra Tech. Ber. NTB 99-08. Nagra, Wettingen, 237 p.
NAEF, H., BIRKÄUSER, PH. & ROTH, PH. 1995: Interpretation der Reflexions-seimik im Gebiet nördlich Lägeren – Zürcher Weinland. Nagra Tech. Ber. NTB 94-14, Nagra, Wettingen.
NAGRA2001: Sondierbohrung Benken – Untersuchungsbericht (Textband and Beilagenband). Nagra Tech. Ber. NTB 00-01. Nagra, Wettingen, 264 p. PFIFFNER, O.A., ERARD, P.-F. & STÄUBLE, M. 1996: Two cross sections
through the Swiss Molasse basin (lines E4-E6, W1, W7-W10). In: Deep structure of the Swiss Alps – Results from NRP 20 (Ed by PFIFFNER, O. A., LEHNER, P., HEITZMANN, P., MÜLLER, S. & STECK, A.). Birkhäuser AG., Basel, 64–72.
SCHEGG, R. & LEU, W. 1998: Analysis of erosion events and paleogeothermal gradients in the North Alpine Foreland Basin of Switzerland. In: Basin modelling; practice and progress (Ed by Duppenbecker, S.J. & Iliffe, J.E.). Geol. Soc. London, Spec. Pub. 141, 137–155.
SOMMARUGA, A. 1997: Geology of the central Jura and the Molasse basin: new insight into an evaporite-based foreland fold and thrust belt. Mém. Soc. Neuchâtel. Sci. Nat. 12, 176 p.
SPRECHER, C. & MÜLLER, W.H. 1986: Geolphysikalisches Untersuchungspro-gramm Nordschweiz: Reflexionsseismik 82. Nagra Tech. Ber. NTB 84-15. Nagra, Wettingen, 170 p.
STAMPFLI, G.M. 1993: Le Briançonnais, terrain exotique dans les Alpes? Eclo-gae geol. Helv. 86/1, 1–45.
– 1996: The Intra-Alpine terrain: a Paleotethyan remnant in the Alpine Variscides. Eclogae geol. Helv. 89/1, 13–42.
STAMPFLI, G.M. & MARCHANT, R.H. 1997: Geodynamic evolution of the Tethyan margins of the Western Alps. In: O.A. Pfiffner, P. Lehner, P. Heitzmann, St. Müller & A. Steck (Eds.): Deep Structures of the Swiss Alps: Results of NRP 20. Birkhäuser, Basel. 223–239.
STAMPFLI, G.M., MOSAR, J., MARQUER, D., MARCHANT, R., BAUDIN, T. & BOREL, G. 1998: Subduction and obduction processes in the Swiss Alps. Tectonophysics 296, 159–204.
STAMPFLI, G.M. & BOREL, G. 2001: Plate-tectonic reconstructions of the West-ern Tethys. In: The Paleotectonic Atlas of the Peritethyan Domain (Ed by STAMPFLI, G., BOREL, G., CAVAZZA, W., MOSAR, J. & ZIEGLER, P. A. CD Rom published by the European Geophysical Society.
STAMPFLI, G. M., BOREL, G. D., MARCHANT, R. & MOSAR, J. 2002. Western Alps geological constraints on western Tethyan reconstructions. In: Re-construction of the evolution of the Alpine-Himalayan Orogen (Ed by ROSENBAUM, G. ANDLISTER. G. S.). J. Virtual Explorer 7, 75 – 104. STAMPFLI, G.M,, VAVASSIS, I., DE BONO, A., ROSSELET, F., MATTI, B. &
BELLINI, M. 2003: Remnants of the Paleotethys oceanic suture-zone in the western Tethyan area. In: Stratigraphic and structural evolution on the Late Carboniferous to Triassic continental and marine successions in Tus-cany (Italy): regional reports and general correlation (Ed. by CASSINIS, G. & DECANDIA, F.A.). Boll. Soc. Geol. Italiana, Volume speciale 2, 1–24. TANER, M.T. & SHERIFF, R.E. 1977: Application of amplitude, frequency and
other attributes to stratigraphic and hydocarbon determination. In: Seis-mic stratigraphy (Ed by PAYTON, C.E.). Amer. Ass. Petrol. Geol. Mem. 26, 310–327.
TANER, M.T., KOEHLER, F. & SHERIFF, R.E. 1979: Complex trace analysis. Geophysics 44, 1041–1063.
THURY, M., GAUTSCHI, A. MAZUREK, M. MUELLER, W.H., NAEF, H. PEARSON, F.J., VOMVORIS, S. & WILSON, W. 1994: Geology and hydrogeology of the Crystalline basement of northern Switzerland. Nagra Tech. Ber. NTB 93-01. Nagra, Wettingen.
TRÜMPY, R. 1980: Geology of Switzerland, a guide book. Part A: an outline of the Geology of Switzerland. Wepf, Basel, 104 p.
VAVASSIS, I., DEBONO, A., STAMPFLI, G.M., GIORGIS, D., VALLOTON, A. & AMELIN, Y. 2000: U-Pb and Ar-Ar geochronological data from the Pelag-onian basement in Evia (Greece): geodynamic implications for the evolu-tion of Paleotethys. Schweiz. Min. Petr. Mitt. 80, 21–43.
VONTAVEL, H. 1937: Stratigraphie der Balmhorngruppe mit Einschluss des Gemmipass (Berner Oberland). Mitt. Natf. Ges. Bern 1936, 43–120. WEIDMANN, M. 1984: Paléokarst éocène dans l’Autochtone chablaisien (VS et
VD). Bull. Murithienne 102, 119–127.
WETZEL, A. & ALLIA, V., 2003: Der Opalinuston in der Nordschweiz: Litholo-gie und Ablagerungsgeschichte. Eclogae geol. Helv. 96, 451–469. WILDI, W., FUNK, H., LOUP, B., AMATO, E. & HUGGENBERGER, P. 1989:
Meso-zoic subsidence history of the European marginal shelves of the alpine Tethys (Helvetic realm, Swiss Plateau, and Jura). Eclogae geol. Helv. 82/3, 819–840.
ZIEGLER, P.A., 1988. Evolution of the Arctic-North Atlantic and the Western Tethys. Am. Assoc. Petrol. Geol. Mem. 43. 198 p.
ZIEGLER, PA., BERTOTTI, G., CLOETINGH, S. 2002: Dynamic processes control-ling foreland development – the role of mechanical (de)coupcontrol-ling of oro-genic wedges and forelands. In: Continental Collision and the Tectono-sedimentary Evolution of Forelands (Ed. by BERTOTTI, G., SCHULMANN, K, & CLOETINGIH, S.A.P.L.). European Geoscience Union, Stephan Mueller Spec. Pub. Series, 1, 29–91.
ZIEGLER, P.A., SCHUMACHER, M.E., DÈZES, P., VANWEESJ.-D. & CLOET -INGH, S. 2004: Post-varican evolution of the lithosphere in the Rhine Graben area: constraints from subsidence modelling. In: WILSON, M., NEUMANN, E.-R., DAVIES, G.R., TIMMERMAN, M.J., HEEREMANS, M. & LARSEN, B.T. (Eds): Permo-Carboniferous magmatism and rifting in Eu-rope. Geol. Soc. London spec. publ. 223, 289–317.
Manuscript received October 26, 2004 Revision accepted March 8, 2005