HAL Id: hal-00676238
https://hal.archives-ouvertes.fr/hal-00676238
Submitted on 5 Mar 2012
HAL is a multi-disciplinary open access
archive for the deposit and dissemination of
sci-entific research documents, whether they are
pub-lished or not. The documents may come from
teaching and research institutions in France or
abroad, or from public or private research centers.
L’archive ouverte pluridisciplinaire HAL, est
destinée au dépôt et à la diffusion de documents
scientifiques de niveau recherche, publiés ou non,
émanant des établissements d’enseignement et de
recherche français ou étrangers, des laboratoires
publics ou privés.
Wiring design based on Global Energy Requirement
criteria: a first step towards an eco-designed DC
distribution voltage
Cédric Jaouen, Bernard Multon, Franck Barruel
To cite this version:
Cédric Jaouen, Bernard Multon, Franck Barruel. Wiring design based on Global Energy Requirement
criteria: a first step towards an eco-designed DC distribution voltage. IREED 2011, Mar 2011, LILLE,
France. 7p. �hal-00676238�
Wiring design based on Global Energy Requirement criteria: a
first step towards optimization of DC distribution voltage
International Conference on Renewable Energy and Eco-Design in Electrical Engineering
Lille, 23-24 march 2011
Cédric JAOUEN†‡, Bernard MULTON‡ and Franck BARRUEL†
† Laboratoire des Systèmes Solaires, Institut National de l’Energie Solaire (CEA-INES) 50, avenue du Lac Léman, 73377 Le Bourget du Lac, France
‡ SATIE, ENS Cachan Bretagne, CNRS, UEB, av. Robert. Schuman F-35170 Bruz, France Tel: +33(0)4 79 44 46 89 – Fax: +33(0)4 79 68 80 49 – e-mail: cedric.jaouen@cea.fr
Topics: Eco-design
1. Introduction
Nowadays, the global energy context leads to a need for the development of distributed Renewable Energy Sources (RES). Since most of them produce direct current while electricity flows in alternative current in the network, the energy produced by RES has to be converted. As modern electrical loads and storage systems can be potentially fed with direct current, the DC distribution scheme need to be evaluated. Then, we need to determine its specification (topology, voltage level, protection device…). Some papers have already shown the reduction of conduction losses induced by a DC distribution [1], others presented some distribution schemes [2] or efficiency analysis [3]-[4] for different voltage levels in a given case study. This paper proposes the first steps of a method for the optimization of the voltage level for a DC distribution scheme according to environmental issues, and focuses on the wire eco sizing. In a first part, we will present our global approach, i.e. the constituent which will be taken into account and the criteria which has been selected before focusing on the wiring design. In a second time, we will present the models and the case studies which have been considered to design wires. And finally we will present our results, comparing our approach with the recommendation made by French standards in our case studies and carrying out a sensitivity study about our working hypothesis.
2. Sizing optimization methodology based
on the primary energy environmental
impact
2.1. The Global Energy Requirement (GER) criteria
Searching global criteria in order to evaluate the DC distribution scheme pertinence, we choose to consider environmental impacts on the whole life cycle. The environmental impact evaluation for a system is normalized by the International Standards Organization according to the standards ISO14040. This analysis is known as Life Cycle Assessment (LCA). The LCA is based on the analysis of many environmental impacts, like greenhouse gases emissions, water consumption, energy consumption,
etc. Assessment is made for all life cycle steps presented in Fig. 1.
Whereas a full-scale Life Cycle Assessment (LCA) is focused on the different methods for balancing the different impacts, we chose to focus only on the Global Energy Requirement (GER). The GER is defined as the total primary energy consumed by the system along its life cycle, i.e. the losses during its use phase, and the energetic cost related to the other steps of its life cycle.
Fig. 1: Life cycle steps of a device [5]
2.2. General optimization synopsis
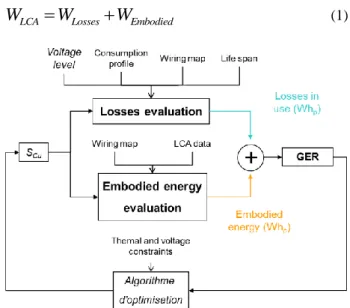
In the DC distribution network, we take electronic converters, which compose the device power supply, wirings and protection devices into account. Then, we have to evaluate the GER of all these elements at a fixed voltage level; on the basis of this criterion we optimize the voltage level of the global distribution network. But still, changing the voltage level will induce a change in constituent sizing. The GER criterion will then once again be used at a local scale to optimize each element of the distribution. As shown in Fig. 2, the global optimization process of voltage level contains local optimization loops for each component. Local optimizations can be treated independently. In this paper we present the local optimization for wiring only.
Fig. 2 : Optimization process synopsis: Focus on wiring design
3. Wiring optimization : Models and
methods
3.1. Optimization process
As we have already explained, the GER is composed by losses during uses WLosses and the
embodied energy WEmbodied. The energy consumed
during the product use is directly link with its life duration. This duration could be chosen according to the ageing of the device or according to the replacement of the device by a better one whereas it is still usable. The first approach needs to understand the ageing phenomena which are responsible for device wear and tear. The second one could be based on statistic approach and linked to our consumption ways or to standard evolution. Since wire replacement is currently due to building renovation, we have considered a 20 years life span. As presented Fig. 3, which represents the wiring optimization synopsis, the wiring losses are also related to the wiring map via the wiring resistance, to the consumption profile and to the voltage level which fixes the current flowing into the wiring. The embodied energy is linked to the wiring map too, which fixes the wiring length, and to the LCA data, extracted from LCA assessment.
Since, an increase of conductor section induces an increase of the wiring embodied energy and a decrease of its losses and vice versa, we choose the conductor section as the optimization parameter. For each section which will be tested by the algorithm, the losses and the embodied energy will be evaluated in order to find the better one for a given voltage level. Now, we will present the models used to evaluate the GER and the constraints apply to the optimization.
3.2. GER evaluation
For this study we have considered a wire made of copper for the conducting material and PVC for the insulating material. We will explain our assumptions made to evaluate the GER WLCA which is then
expressed by the following expression:
LCA Losses Embodied
W
W
W
(1)Fig. 3 : Wiring optimization synopsis
Loss and thermal model
The loss model is simply based on Joule losses. However, we have taken resistivity variation according to thermal effect into account. We considered a resistance variation of +0.4%/°C and a uniform copper temperature. Then, for each profile power point, the wire temperature is evaluated according to a steady state thermal model and the scheme presented in Fig. 4.
l Cu
PJ copper air copper isu
Rconv/rad cond RFig. 4 : Geometric and thermal wire parameters Thermal resistances evaluation is based on a convection and radiation heat transfer coefficient of 7W/K/m² associated with a conduction heat transfer coefficient of 0.17 W/K/m for the PVC insulator [6]. Then, the losses WLosses are expressed by the
following expression:
1
loadLosses copper load
elec life span dc
P
W
R
P
dt
U
(2)Where ηelec represents the conversion efficiency to
transform primary energy (Fuel, Nuclear …) into electrical energy. In fact, the embodied energy is currently expressed in primary energy, and then losses shall be expressed in the same units. For our study we consider an efficiency of 0.28 related to the French energy mix [7].
Embodied energy evaluation
The embodied energy is defined as the primary energy that was used in the work to make any product, bring it to market, and dispose of it. Due to few available LCA data we have considered only the extraction of raw materials and the wire manufacturing without the PVC extrusion around the conductor.
Our evaluation is based on two data:
The primary energy which is necessary to manufacture 1 meter of 1mm² wire including raw material extraction and production effort: WCuWire= 12.5 kWhp/kg 0
The primary energy which is necessary to produce 1 kg of PVC: WPVC= 16.5 kWhp/kg
[9]
However, we need to find a model of the PVC section according to the copper one. This model is based on standard [10] which defines the insulating thickness for 450/750V rated voltage wire related to the conductor section. Fig. 5 present the data extracted from standard and the model taken into account for our study.
Fig. 5 : Insulator section versus Conductor section according to [10]
Then for a given conductor section ACu, the
insulator section APVC will be evaluated and
multiplied by the cable length LCable related to the
wiring map. Finally, the embodied energy WEmbodied
will be estimated by the following expressions:
Cu Cu Cu Cable PVC PVC PVC Cu Cable Embodied Cu CuWire PVC PVCM
A
L
M
A
A
L
W
M
W
M
W
(3) 3.3. Optimization constraints TemperatureThe temperature constraint is related to material degradation. According to [11], the maximum PVC temperature to perform a wire life span of 30 years is 70°C. The maximum PVC temperature is presented at the interface between insulator and conductor. Then, we have chosen to exclude all conductor section which induces a copper temperature beyond 70°C.
Voltage losses
Standard [12] give some recommendations about maximum voltage losses related to appliances: 3% for lighting appliances and 5% for the others. Our voltage constraints are based on these rules.
3.4. Case studies
We chose to consider two appliances in the commercial and residential building power range.
Wiring between a feeder and an electrical vehicle
We propose to consider a 1 meter line dedicated to the charging of an electric vehicle battery. The maximum power charge is 3.3 kW. The electric vehicle is assumed to have a 20 km/day use, which is approximately the French median commuting distance [13], and a 160 Wh/km energy consumption (based on manufacturer information). The load profile is based on measures realized at INES on a Peugeot 106 electric vehicle and shown Fig. 6. This profile is composed of a first phase which really brings the required energy, and a second phase for the battery equalization.
Fig. 6 : Daily electrical vehicle charging profile for a 20 km day trip with a 160Wh/km consumption. The simulated profile is defined on this one-day time basis profile repeated five days a week and 48 weeks a year over twenty years corresponding to a commuting use. Then, the total energy flowing in the cable is approximately 18 MWh.
Lighting circuit
Fig. 7 : Geometric lighting circuit parameters We propose to consider a lighting circuit composed of four 20 W compact fluorescent lamps. The circuit and its dimensions are presented Fig. 7. For each bulb, we assume the same daily load profile, shown in Fig. 8, for all the days of the simulation. This profile is a typical one for a small flat made of a bedroom, a bathroom, a lounge and a kitchen. The simulated
profile is defined on this one-day time basis profile repeated each day and each month over 20 years. Then, the total energy flowing in the circuit is approximately 1 MWh. Compared with the first application, this case study allows to consider the constraints due to the consumption simultaneity on a same part of the distribution scheme. All the lighting circuit parts will have the same section.
Fig. 8 : Daily power profile
4. Results
4.1. Optimization at given voltage level
First look at Fig. 9 which represents the GER, the embodied energy and the losses in use versus conductor section at 230 VDC for the charging electric vehicle case study. We remark the existence of a unique minimum. For a conductor section smaller than the optimum one, the losses are preponderant compared with the embodied energy, then the GER curve looks like a current “losses versus conductor section” curve and is in inverse proportion to the conductor section. However, for bigger conductor section, the embodied energy becomes preponderant then the GER curve becomes directly proportional to conductor section. We could also remark that the GER shape is really smooth around the optimal section, i.e. we could choose a smaller conductor section without an important GER variation in order to reduce the quantity of materials. The quantity of materials could be an additional criterion to take into account for completing this study. In this case, we should solve a multi objective optimization as it is proposed in [14] for a single-phase induction motor.
Fig. 9 : GER, embodied energy and losses versus conductor section at 230VDC for the charging electric vehicle case study: 1 and 2 meters cable
length
Now, compare the two GER curves. We can point out that the optimum conductor section is the same independently of cable length. Moreover, it’s important to notice that this study realized for DC distribution scheme is viable for AC distribution scheme with a power factor equal to one, and could be easily extended to different power factors.
4.2. Comparison between optimized wiring and standard wiring
We now propose to compare the GER-optimized conductor section with the standard ones given in [12] for a 230V voltage level.
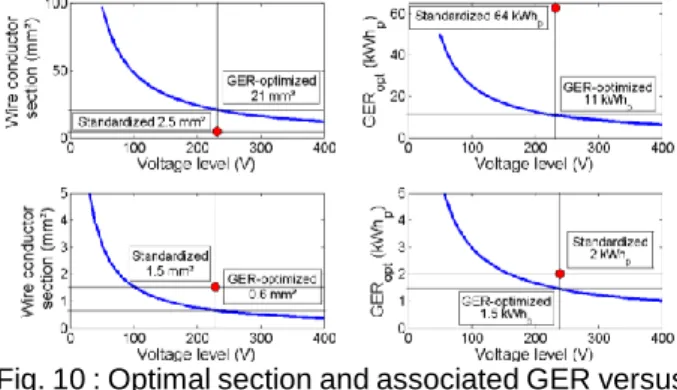
For the electric vehicle charging appliance, the standardized section is 2.5 mm² because the maximum power level is smaller than 3.6 kW. We also evaluate the GER of a 1 meter 2.5 mm² conductor section wire subject to the electric vehicle case study. According to the optimization process the optimal conductor section is 21mm² with a GER of 11 kWhp whereas the 2.5 mm² standardized
section GER is of 64 kWhp. Since the standardized
conductor section is smaller than the optimized one, the loss weight is then bigger than the embodied energy one in the GER. In other words, this wiring is under-sized according to the GER criteria. We are aware that 21 mm² represent a very important conductor section according to current standards. However, we don’t take the whole life cycle, and into account then, the optimal section could be smaller if all the steps were included. In all cases, we could set a conductor section bigger than 2.5 mm² usual standards for supplying electrical vehicle (for instance 6 mm² like oven dedicated wiring) to improve the wiring GER without spending too much raw materials.
For the lighting circuit appliance, the standardized section is 1.5 mm². We also evaluate the GER of a 1.5 mm² conductor section circuit subject to the lightning case study. According to the optimization process the optimal conductor section is 0.6 mm² with a GER of 1.5 kWhp whereas the 1.5 mm²
standardized section GER is of 2 kWhp. Since the
standardized conductor section is bigger than the optimized one, the loss weight is then smaller than the embodied energy one in the GER. In other words, this wiring is over sizing according to the GER criteria. The standard [10] is based on lighting circuit made with incandescent bulbs, whereas they are replaced by more energy efficient bulbs (considered in this study). Our study shows that the lighting circuit conductor section could also be reduced in the future.
Fig. 10 shows the evolution of the optimal conductor section and the associated GER, for each case study, with the voltage level. It points out that bigger the voltage level is, smaller the GER is. Then, from the wiring point of view, the high voltage DC distribution scheme is greater according to the GER criteria. However, higher the voltage level is, more
important the protection devices are. More studies need to be performed to affirm this trend.
Fig. 10 : Optimal section and associated GER versus voltage level: electric vehicle case study (top) and
lighting case study (bottom)
4.3. Sensitivity study
As we have presented sooner, the life span, the LCA data and the consumption profile could be different from one study to another. Consequently, we also realize a sensitivity study for these parameters.
Life span sensitivity
The life span assumption has been chosen according to an estimation of a building renovation every 20 years. However we do not have any study to confirm this assumption. In a first time, we look at the influence of the life span estimation on the optimal section for the supplying of an electric car. We plot the graph presenting the optimal conductor section versus voltage level for a +/-20% life span variation around 20 years (Fig. 11).
Fig. 11: Effect of life span estimation on optimal conductor section: charging electric vehicle case
study
First, we can remark that the effect of life span is independent from the voltage level. Then, a life span increase induces an increase of optimal conductor section. In fact, a life span increase corresponds to a loss increase due to a bigger energy transfer; the section can also be bigger to reduce these losses. In the Fig. 11 case study, a +-20% life span variation produces a +-10% optimal conductor section. But, as we remark on Fig. 9, the GER variation is very smooth around the optimal conductor section, which explains why this potential error is not so important.
Now, look at the impact of an error of wiring life span estimation, on the GER. We also determine the optimal section for a 20 years life span and evaluate the GER for this wire used during other life span in a 230V distribution scheme (blue curve). Fig. 12 presents the results of this study. In this case study, an error of +/-20% on the life span induces a GER variation of +-10%. However, by comparing the GER obtained in the real life span with the real life span optimized one, we can conclude that the difference between the two GER is minimal for a +/-20% life span estimation error. In other word, the variability of life span around the average value doesn’t induce significant change on the optimal wiring area.
Fig. 12 : Consequence of a bad estimation of life span on the GER (blue curve) and comparison with
the optimized one (red curve) for the charging electric car case study.
LCA data sensitivity
As we explain sooner, all the life cycle steps are not taken into account. This may change the optimal conductor sector. Moreover, LCA data depend on local and technological conditions. Then we compare the different optimal conductor sections according to a +/-20% variation of WCuWire in the
charging electrical vehicle case study (Fig. 13).
Fig. 13 : Impact of the copper embodied energy on the optimal conductor section for the charging
electric car case study.
Like in the life span sensitivity study, the impact is independent of the voltage level; however, in this case, the GER variation is opposed to the copper embodied energy one. In fact, the wiring embodied energy is directly linked to the copper embodied energy. Then, the wire section should be reduced to reach the optimum. In this case study, the optimal
conductor variation due to copper embodied variation is similar to the variation due the life span variation: a +/- 20% variation induces a +/- 10% GER variation.
Consumption profile sensitivity
In this part, we will quantify the impact of the simultaneity in the lighting case study and the impact of the maximum power level on the optimal conductor section for supplying an electric vehicle.
The impact of simultaneity will be assessed comparing two lighting case study: one with the Fig. 8 power profile and the other with the Fig. 14 one-day base power profile at 230 Vdc. These profiles are built concentrating the consumption at the beginning of the day.
Fig. 14 : Simultaneous lighting power profile According to the optimization process, the optimal conductor section for the Fig. 14 day profile is 0.65 mm² with a GER of 1.65 kWhp whereas the former
study concluded to an optimal conductor section of 0.6 mm² with a GER of 1.5 kWhp. This study points
out that the consumption repartition may play a role in the determination of the optimal conductor section. In fact, the consumption superposition inside several circuit parts increases losses and consequently the optimal conductor section too. But this effect is independent of the designer will.
Fig. 15 :3.3kW and 2.2kW charging 20 km commuting electric vehicle power profile Now look at the effect of maximum power level in the charging electric vehicle case study. We will then compare two charging profile needed to bring the energy for a 20 km commuting at 230 Vdc: one with a 3.3 kW maximum power level and another with a 2.2kW one, as shown Fig. 15
According to the optimization process the optimal conductor section for the 2.2kW charging profile is 17 mm² with a GER of 9 kWhp whereas the former
study resulted to a 21 mm² optimal conductor section with a GER of 11 kWhp. This study points out that the
maximum power level effect is the same that the effect of simultaneity; however, the designer can have an influence on the desired power level.
Sensitivity study conclusion
In this chapter, we have shown the complexity to give quantitative results after an eco-design study due to multiple uncertainties. The first one is due to LCA data variation depending on manufacturing location and process but it could be evaluated. Others are due to consumer behavior (life span and simultaneity parameters) and are difficult to assess. However, they may be not always significant. Finally, the designer could choose this specification in order to reduce the distribution scheme impact for a given energetic need according the power level point of view.
5. Conclusion
In this paper, we have proposed an approach based on the LCA to evaluate about the pertinence of the DC distribution scheme. Our method introduces the eco-sizing of DC distribution scheme’s constituents according to the GER criteria. This paper has focused on the wiring eco-design for two appliances: a lighting circuit and a wiring for charging electric vehicle. After presenting our model to assess losses and embedded energy, we have shown the existence of a unique minimum at a given voltage level and the fact that bigger the voltage level is, smaller the GER is, (i.e. a minimum doesn’t exist according to voltage level). Then, we have compared the GER of an optimized wire with the standardized wire one. We concluded about the need to increase the conductor section in the charging electric vehicle case study and the need to decrease the conductor section in the lighting circuit case study. Finally, we have made a sensitivity study to evaluate the effect of the profile property (simultaneity and maximum power level) and the effect of the uncertainties related to LCA data and life span estimation. It is important to notice that, due to these uncertainties, an eco-design study can nowadays only give trends for wiring design but the smooth variation around the optimal conductor section allows accepting some tolerance about our hypothesis. Moreover, this study could be completed by taking the non-renewable resources consumption into account in a multi-objective optimization.
Appendix
Tableau 1: Definition of constant
Symbol Quantity Value
ρCu Copper density 8960 kg/m3
References
[1] A. Sannino, G. Postaglione, H.J. Bollen, Feasability of a DC network for commercial facilities, IEEE Transactions on Industry applications, vol. 39, Oct. 2003.
[2] V. Azbe, R. Mihalic, Distributed generation from renewable sources in an isolated DC network, Renewable Energy, vol. 31, Nov. 2006.
[3] M. Sechilariu, AC vs DC: Hybrid distribution scheme for building with renewable energy production (In French), EF 2007, Toulouse: 2007.
[4] C. Jaouen, B.Multon, F. Barruel, Investigation of DC distribution by measuring and modeling power supply devices for buildings with PV production, EVER’10, Monaco, 2010.
[5] A. Helias et al “Life Cycle Approaches: The road from analysis to practice”, UNEP-SETAC Life Cycle Initiative, 2005.
[6] CSTB, RT 2005, appendix 2/5 Materials : Useful thermal characteristics (In French), 2005 [7] Software Bilan Produit 2008, ADEME,
http://www.ademe.fr/internet/bilan_produit/login. asp, accessed September 2009
[8] L. Tikana., Sievers H., Klassert A., Life cycle assessment of copper product, European Copper Institute, 2005
[9] R. Hischier, “Life cycle inventories of packaging & graphical papers, part 2: Plastics”, Ecoinvent report n°11, Dec. 2007
[10] Standard ”NF C 32-201”, PVC insulated wires and cables for a 450/750V rated voltage (In French), 1998, Last updated 2009
[11] D. Serre, Low voltage installations: wiring design and implementation (In French), “Techniques de l’ingénieur”, Ref. D 5 046, feb. 2007
[12] Standards “NF C 15 100”, Low voltage installations (In French), 2002, Last updated 2010
[13] B. Baccaïni, F. Sémécurbe, G. Thomas, “Commuting amplification due to suburbanization”, INSEE Premiere, N° 1129 - MARS 2007
[14] V. Debusschere, B. Multon, H. Ben Ahmed, P.E. Cavarec, « Life cycle design of a single-phase induction motor », Electric Power Applications IET, Vol. 4 n°5, may 2010, pp.348 - 356.
![Fig. 1: Life cycle steps of a device [5]](https://thumb-eu.123doks.com/thumbv2/123doknet/12880804.370017/2.892.476.791.578.843/fig-life-cycle-steps-device.webp)