HAL Id: hal-02945686
https://hal.archives-ouvertes.fr/hal-02945686
Submitted on 22 Sep 2020HAL is a multi-disciplinary open access
archive for the deposit and dissemination of sci-entific research documents, whether they are pub-lished or not. The documents may come from teaching and research institutions in France or abroad, or from public or private research centers.
L’archive ouverte pluridisciplinaire HAL, est destinée au dépôt et à la diffusion de documents scientifiques de niveau recherche, publiés ou non, émanant des établissements d’enseignement et de recherche français ou étrangers, des laboratoires publics ou privés.
A 2D Shallow water model with depth-dependant
porosity applied to the Severn River
Vita Ayoub, Carole Delenne, Patrick Matgen, Pascal Finaud-Guyot, Renaud
Hostache
To cite this version:
Vita Ayoub, Carole Delenne, Patrick Matgen, Pascal Finaud-Guyot, Renaud Hostache. A 2D Shallow water model with depth-dependant porosity applied to the Severn River. River Flow 2020 - 10th Conference on Fluvial Hydraulics, Jul 2020, Delft / Virtual, Netherlands. �hal-02945686�
A 2D Shallow water model with depth-dependant porosity applied
to the Severn River
Vita AYOUB
Luxembourg Institute of Science and Technology, Environmental Research and Innovation Department, Esch-sur-Alzette, Luxembourg
HydroSciences Montpellier, Universit´e de Montpellier, CNRS, IRD, Montpellier, France
Institut national de recherche en sciences et technologies du num´erique, Lemon, Montpellier, France Carole DELENNE
HydroSciences Montpellier, Universit´e de Montpellier, CNRS, IRD, Montpellier, France
Institut national de recherche en sciences et technologies du num´erique, Lemon, Montpellier, France Patrick MATGEN
Luxembourg Institute of Science and Technology, Environmental Research and Innovation Department, Esch-sur-Alzette, Luxembourg
Pascal FINAUD-GUYOT
HydroSciences Montpellier, Universit´e de Montpellier, CNRS, IRD, Montpellier, France
Institut national de recherche en sciences et technologies du num´erique, Lemon, Montpellier, France Renaud HOSTACHE
Luxembourg Institute of Science and Technology, Environmental Research and Innovation Department, Esch-sur-Alzette, Luxembourg
ABSTRACT: In hydrodynamic modelling, the mesh resolution has a strong impact on run time and result accuracy. Coarser meshes allow faster simulations but often at the cost of accuracy. Conversely, finer meshes offer a better description of complex geometries but require much longer computational time that makes their use at a large scale challenging. In this context, we aim to assess the potential of a two-dimensional shallow water model with depth-dependent porosity (SW2D-DDP) for flood simulations at a large scale. This modelling approach relies on nesting a sub-grid mesh containing high-resolution topographic and bathymetric data within each computa-tional cell via a so-called depth-dependant storage porosity. It enables therefore faster simulations on rather coarse grids while preserving small-scale topography information. The July 2007 flood event in the Severn River basin (UK) is used as a test case. The model is evaluated using both gauge and spatial data.
Keywords: large scale flood model, shallow water equations, depth-dependent porosity, high-resolution data, fast simulations.
1 INTRODUCTION
Floods are among the most devastating natural hazards. With global change, floods are expected to become more frequent and severe. Thus for improved flood management systems, there is a crucial need for understanding and assessing flood hazards at a large scale. While accurate simulations of discharge and water levels are key in the decision making process in flood prone areas (Hostache, Chini, Giustarini, Neal, Kavetski, Wood, Corato, Pelich, & Matgen, 2018), the hydrological and hydraulic modelling of rivers and floodplains at high spatial resolution remains challenging (Hartnett & Nash, 2017).
The modelling tools at hand are of varying complexity and commonly require a large num-ber of input parameters. Moreover, data availability can be an issue, as many areas in the world remain poorly monitored. Generating high-resolution flood hazard maps at large scale requires an accurate delineation of flood extents (Giustarini, Chini, Hostache, Pappenberger, & Matgen, 2015) and often entails a good compromise between model complexity and its computation time. Establishing channel-floodplain connections, as a prerequisite for accurately outlining flooded areas, is rather demanding. Thus far, progress in large-scale flood modelling was mainly achieved by shifting from large-scale approaches to detailed-reach scale hydraulic models. Reported model complexity ranges from coupled 1-D/floodplain storage models (de Paiva, Buarque, Collischonn, Bonnet, Frappart, Calmant, & Bulhoes Mendes, 2013), 1D-channel/simplified 2D floodplain models (Paz, Collischonn, Tucci, & Padovani, 2011), to 2D models with sub-grid representa-tion of minor channels (Schumann, Neal, Voisin, Andreadis, Pappenberger, Phanthuwongpakdee, Hall, & Bates, 2013). In these studies, the spatial resolution of the model grid is too coarse to capture floodplain processes accurately (250-1000 m) – eventually impeding the delineation of flood extents at high resolution. While 2D models relying on the calculation of velocity distribu-tions in floodplains have the potential to achieve this high level of resolution, the inherent large computation times may be constraining. As a potential solution to large computation times, the sub-grid computing approach has gained interest in the past years. The Lisflood-FP raster-based hydraulic model was introduced by (Bates & De Roo, 2000), where channel flow is represented in 1D and floodplain flow in 2D. (Neal, Schumann, & Bates, 2012) used this model and implemented a sub-grid channel routing scheme, which helped saving computation time, but also resulted in local errors as finer topography information was smoothed out.
Porosity-based models rely on the upscaling of the traditional shallow water equations using porosity concepts. Porosity models have evolved over the past twenty years. (Defina, D’alpaos, & Matticchio, 1994) introduced the shallow water model with isotropic porosity. The formulation for partially wet/dry areas over irregular domains was later improved by (Defina, 2000)(Defina, 2000) and (Casulli, 2015). In the single porosity version model (Guinot & Soares-Fraz˜ao, 2006) a differential formulation was derived using a finite volume scheme, which was further validated by (Soares-Fraz˜ao, Lhomme, Guinot, & Zech, 2008). Later, (Sanders, Schubert, & Gallegos, 2008) shifted the focus from isotropic to anisotropic by proposing the Integral Porosity model, where areal porosity was distinguished from volumetric porosity. This model was frequently used in urban zones (Schubert & Sanders, 2012). This approach was further extended by introducing a Dual Integral Porosity model (Guinot, Sanders, & Schubert, 2017). (Kim, Sanders, Famiglietti, & Guinot, 2015) investigated the porosity-based model errors and showed that they are lower for models with anisotropic rather than isotropic approach. (Guinot, 2012) merged the isotropic and anisotropic models and introduced a multiple porosity approach where the flow region is divided into sub-regions, each having its own single porosity. The Depth-Dependant Porosity (DDP) (Guinot, Delenne, Rousseau, & Boutron, 2018) model uses the DIP approach with depthvariable porosity fields. In this study we use the SW2DDDP (Shallow Water 2Dimensionnal -Depth Dependant Porosity) approach, as proposed by (Guinot et al., 2018). Our overall objective is to assess whether porosity can be used within a grid cell using SW2D-DDP, as this would arguably pave the way for flood modelling at large scale. In section 2 we describe the study area and available data. Next, we introduce materials and methods in section 3. In section 4 we present and discuss our preliminary results, and conclude on our findings in section 5.
2 STUDY AREA AND AVAILABLE DATA
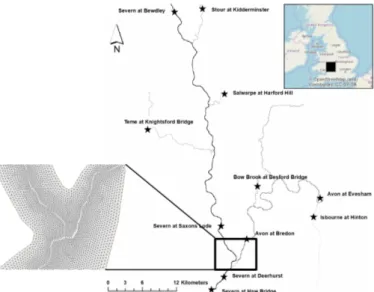
The study area is a part of the Severn and Avon catchments located in United Kingdom and covers an area of around 30×50 kilometers. It includes the confluence of the Severn and Avon rivers. The model domain and river network are shown in Figure 1.
2.1 Gauging stations network and hydrometric data
In the area of interest, the main river is the Severn and there are six main tributaries: Stour, Salwarpe, Teme, Bow Brook, Evesham and Isbourne on which seven hydrometric stations provide streamflows and water levels time series at 15-min intervals (Figure 1). A gauging station lies at
Figure 1.: Study site: Severn river, UK. Stars correspond to the gauging stations. Lower left: zoom on the mesh at the Severn-Avon confluence.
the downstream boundary of the domain (Haw Bridge), and three additionnal ones are located within the area of interest along the Severn and Avon rivers: Saxons Lode, Deerhurst and Bredon. 2.2 Flood event, observation and topographic data sets
Considered as one of the most severe for the past two decades, the July 2007 flood event is used as a test case. This event is of particular interest as a high resolution aerial photography was acquired at the flood peak, on July 24, 2007. Topographic data is provided by a LiDAR Digital Terrain Model (DTM), rescaled on a 10m grid.
3 MATERIALS AND METHODS
The porosity based model SW2D-DDP uses as inputs: i) the computational mesh of the area of interest, ii) topographic data, iii) initial and boundary conditions and iv) parameters (e.g: fric-tion coefficient). The model simulates, among other variables, water depths, and flow velocity. As usual, model outputs can be exported as maps at given time steps or as time series at given locations.
3.1 Delineating river banks
Delineating river banks is a necessary step before designing the mesh as riverbed location is needed. To do so, an automatic algorithm has been developed in order to retrieve maximum elevation points (e.g. dikes) from the DTM along 200m-long cross-sections of the river network (Figure 2). These two points delineate the river bed, and connecting them automatically along the river course allows creating the right and left banks. This ensures the river usually flowing in the riverbed to burst its banks only when the aforementioned maximum elevation is reached.
3.2 Deriving cell porosity from topography
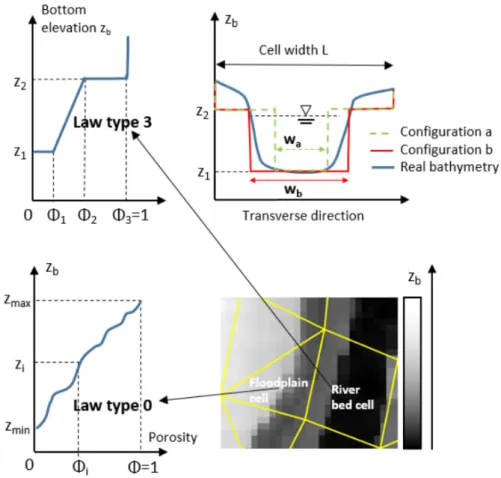
Topographic data of relatively high resolution is a required input of the model. In our test case, high resolution topography information is taken into account via porosity laws. An algorithm has been developed for the automatic computation of porosity, following conditions described further on. The SW2D-DDP model relies on separate cell (storage) and interface (connective) porosities. In this study, two different porosity laws (Guinot et al., 2018) are used:
• porosity law type 0 is used in the floodplain (Figure 3 left): the distribution of ground elevations within each cell is first estimated using the DTM. From this, N ”equidistant” values are taken to define the porosity-elevation function (φ = i/n, zi), i = 1 . . . n.
Figure 2.: A schematic view of river banks delineation. Left: A river cross-section with its bottom elevation points, Right: A top view of river cross-sections in a digital terrain model.
• porosity law type 3 is used in the riverbed according to a simplified rectangular riverbed shape assumption (Figure 3 right).
Figure 3.: Porosity laws. Upper left: porosity law type 3. Upper right: a practical application of law type 3 for configuration (a) with φ1 = φ2 = wa/L = 0.3 and (b) with
φ1= φ2 = wb/L = 0.6; φ3=1. Lower left: porosity law type 0. Lower right: A top view of cells
showing topography variation.
For each interface, type 3 is used inside the riverbed (between two cells of type 3); type 0 in the floodplain (between two cells of type 0) and on river banks (between a riverbed and a floodplain cells). Due to numerical constraints, the interface porosity has to be smaller than the cell porosity
for any water depth (Guinot et al., 2018). To ensure that the aforementioned condition is respected, the interface porosity values are computed as the minimum porosity values of two adjacent cells. Figure 3 (right) represents the application of law type 3. The riverbed shape being unknown, an equivalent rectangular geometry is assumed by setting φ2 = φ1. φ3 is equal to unity, indicating
the cell being totally wet when z reaches the maximal bottom elevation. The riverbed bottom elevation z1 is derived from punctual bathymetric measurements. The z2 value is given from the
DTM as the bank elevation (see section 3.1).Two different test case scenarios will be tested in this study where in configuration a: φ1=φ2=0.3 and in configuration b: φ1=φ2=0.6.
3.3 Domain discretization
The unstructured computational mesh is designed using SMS (Surface water modeling) Aquaveo c software. Riverbanks previously delineated are used to constrain the main channel flow where quadrangular elements are drawn. Floodplains are discretized with 300 m -spaced triangular ele-ments (see Figure 1). The total number of eleele-ments in the mesh is around 26000. While the designed mesh is relatively coarse, the topographic data is represented on a finer sub-grid scale (spatial resolution of 10 m) via the porosity laws.
3.4 Model Parameters and initial and boundary conditions The boundary conditions of the model are defined as follows:
• Upstream boundary conditions: two hydrograms of the rivers Severn at Bewdley and Avon at Evesham.
• Downstream boundary condition: a limnigram recorded at the Haw Bridge station.
The other tributary inflows are not taken into account in this test case. The initial condition is a constant water surface elevation over the entire domain. As first approximation, an uniform Strickler coefficient of 50 m1/3s−1has been attributed for the entire zone. Two configurations are carried out for the riverbed porosity: (a) φ1= φ2= 0.3 and (b) φ1= φ2= 0.6 (see Figure 3).
4 RESULTS AND DISCUSSION
4.1 Assessment of simulated water level time series
Continuous time series of gauged water levels recorded at three internal stations are available for this assessment. To compare simulation and observation, we use the following metrics: the root mean square error (RMSE) and the Nash-Sutcliffe efficiency (NSE). The NSE represents the percentage of the observed water level variance explained by the model. It is equal to 1 if the observed and simulated limnigrams fit perfectly and the larger the difference, the lower the NSE. Table 1. Performance metrics for evaluating water levels downstream for the two configurations.
Saxons Lode Deerhurst Bredon
RMSE (a) 0.854 0.261 0.886
RMSE (b) 0.987 0.419 0.824
NSE (a) 0.333 0.945 0.473
NSE (b) -0.554 0.806 0.025
Table 1 shows that RMSE and NSE scores at Deerhurst station are better than scores at Saxons Lode and Bredon stations. Moreover, we observe a noticeable change of the scores at each station when porosity value is changed (test b). This means change in porosity affects the model perfor-mance. Nevertheless, at Deerhurst station the model results are less sensitive to porosity due to the backwater effect of the downstream boundary condition. Furthermore, global scores observed at Saxons Lode are lower than scores at Bredon. This is probably due to the fact that we ignore three tributary inflows in the Severn river (among which Teme would be the most important, while at the Avon river only two inflows of smaller tributaries are missing).
Table 2. Performance metrics computed through the comparison between simulated and observed flood extent maps (tests a and b). CSI: Critical Success Index.
Configuration test (a) (φ1= 0.3) Configuration test (b) (φ1= 0.6)
CSI 0.63 0.62
Kappa 0.692 0.688
Accuracy 0.878 0.883
4.2 Assessment of simulated flood extent
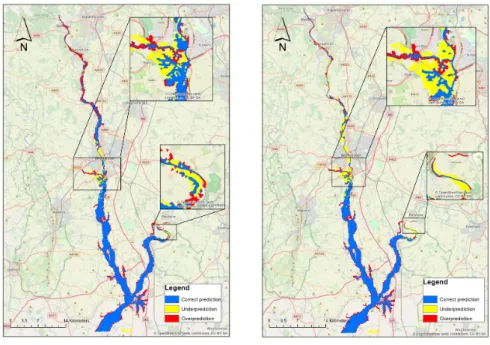
In order to further assess the model performance, the predicted flood extent maps are compared to a flood extent map derived from aerial photography. The performance coefficients used for this evaluation are the Critical Success Index (CSI) (Schaefer, 1990), the Cohen’s kappa index (Brennan & Prediger, 1981) and the overall accuracy. All of of them are computed using the con-fusion matrix, composed of four values defined as follows: 1) number of pixels correctly predicted as flooded (true positives labeled as correct prediction in Figure 4), 2) number of pixels associated with overprediction of flood extent, i.e non flooded in the validation but predicted as flooded in the simulated map (false positives), 3) number of pixels associated with underprediction, i.e pre-dicted as non flooded but observed in the validation map (false negatives), and 4) number of pixels correctly predicted as nonflooded as in the validation map (true negatives). All of these metrics quantify goodness of fit; they attain their highest value of 1 when the predictions provide a perfect fit to the observations.
The simulated flood map in Figure 4 shows in general a rather good agreement with the flood extent map derived from the aerial photography. It also shows that most of the overprediction (i.e., red pixels) occurs in the upstream part of the Severn river whereas most of the underprediction (i.e., yellow pixels) occurs along the upstream part of River Avon as well as at the confluence with the Teme tributary (i.e. framed in the first contingency map). As expected, configuration test b, with a larger porosity illustrates increased underestimation (i.e. yellow pixels) in the aforemen-tioned zones (see table 2). This might be linked to the fact that the river channel gets wider with higher porosity and overbank flow occurs at higher streamflow. This negative effect comes with a decrease of overprediction. This indicates that the use of a uniform porosity value for the entire river network in the area of interest is too simplistic. In order to improve predictions, the porosity might have to be parameterized spatially.
Figure 4.: Contingency maps for configuration tests a and b. Left: test a with φ1= φ2=0.3. Right:
5 CONCLUSION
Performance metrics regarding water levels assessment at gauging stations reveals that the clos-est we get to the boundary condition downstreamn, the less the model performance is sensitive to porosity change (as observed at Deerhurst). However, at other locations (Saxons Lode and Bredon), the porosity parameter can be more influential on the model’s behaviour. Moreover, flood extent maps derived from water depth maps generated by the model, have shown a rather good agreement with an aerial photography extracted-flood map. Observing underestimations and overestimations at different locations of the contingengy maps suggests the porosity should be parameterized spatially in order to improve predictions. But before jumping into conclusions, it would be interesting to estimate model uncertainties coming from boundary conditions and friction coefficient. Additional tests will be carried out to take into account all main tributary inflows as boundary conditions. Moreover, our plan is to further investigate the influence of the Strickler coefficient on the numerical predictions. Calibration of porosity using observation will also be carried out. Overall, the study shows the use of SW2D-DDP holds a good potential for flood modelling at a large scale. Preliminary results evaluation of the large scale proposed mod-elling approach, associated with a sub-grid topographical information, seems to hold promising results with rather satisfying performance levels at a lower computational effort. Further on, the best representative law type for riverbed cross-sections will be investigated on the Alzette river in Luxembourg, for which bathymetric data is available.
ACKNOWLEDGMENTS
This study was done in the framework of the CASCADE project “Combining eArth obServation with a large scale model Cascade for Assessing flood hazarD at high spatial rEsolution” funded by the National Research Fund (FNR) of Luxembourg (Grant Number: C17/SR/11682050).
REFERENCES
Bates, P. D. & A. De Roo (2000). A simple raster-based model for flood inundation simulation. Journal of hydrology 236(1-2), 54–77.
Brennan, R. L. & D. J. Prediger (1981). Coefficient kappa: Some uses, misuses, and alternatives. Educational and psychological measurement 41(3), 687–699.
Casulli, V. (2015). A conservative semi-implicit method for coupled surface–subsurface flows in regional scale. International Journal for Numerical Methods in Fluids 79(4), 199–214. de Paiva, R. C. D., D. C. Buarque, W. Collischonn, M.-P. Bonnet, F. Frappart, S. Calmant, &
C. A. Bulhoes Mendes (2013). Large-scale hydrologic and hydrodynamic modeling of the amazon river basin. Water Resources Research 49(3), 1226–1243.
Defina, A. (2000). Two-dimensional shallow flow equations for partially dry areas. Water Resources Research 36(11), 3251–3264.
Defina, A., L. D’alpaos, & B. Matticchio (1994). A new set of equations for very shallow water and partially dry areas suitable to 2d numerical models. In Modelling of flood propagation over initially dry areas, pp. 72–81. ASCE.
Giustarini, L., M. Chini, R. Hostache, F. Pappenberger, & P. Matgen (2015). Flood hazard map-ping combining hydrodynamic modeling and multi annual remote sensing data. 7(10), 14200–14226.
Guinot, V. (2012). Multiple porosity shallow water models for macroscopic modelling of urban floods. Advances in Water Resources 37, 40–72.
Guinot, V., C. Delenne, A. Rousseau, & O. Boutron (2018). Flux closures and source term models for shallow water models with depth-dependent integral porosity. Advances in Water Resources 109, 133–157.
Guinot, V., B. F. Sanders, & J. E. Schubert (2017). Dual integral porosity shallow water model for urban flood modelling. Advances in water resources 103, 16–31.
Guinot, V. & S. Soares-Fraz˜ao (2006). Flux and source term discretization in two-dimensional shallow water models with porosity on unstructured grids. International Journal for Numerical Methods in Fluids 50(3), 309–345.
Hartnett, M. & S. Nash (2017). High-resolution flood modeling of urban areas using msn flood. Water Science and Engineering 10(3), 175–183.
Hostache, R., M. Chini, L. Giustarini, J. Neal, D. Kavetski, M. Wood, G. Corato, R.-M. Pelich, & P. Matgen (2018). Near-real-time assimilation of sar-derived flood maps for improving flood forecasts. Water Resources Research 54(8), 5516–5535.
Kim, B., B. F. Sanders, J. S. Famiglietti, & V. Guinot (2015). Urban flood modeling with porous shallow-water equations: A case study of model errors in the presence of anisotropic porosity. Journal of Hydrology 523, 680–692.
Neal, J., G. Schumann, & P. Bates (2012). A subgrid channel model for simulating river hydraulics and floodplain inundation over large and data sparse areas. Water Resources Research 48(11).
Paz, A. R. d., W. Collischonn, C. E. Tucci, & C. R. Padovani (2011). Large-scale modelling of channel flow and floodplain inundation dynamics and its application to the pantanal (brazil). Hydrological processes 25(9), 1498–1516.
Sanders, B. F., J. E. Schubert, & H. A. Gallegos (2008). Integral formulation of shallow-water equations with anisotropic porosity for urban flood modeling. Journal of hydrology 362(1-2), 19–38.
Schaefer, J. T. (1990). The critical success index as an indicator of warning skill. Weather and forecasting 5(4), 570–575.
Schubert, J. E. & B. F. Sanders (2012). Building treatments for urban flood inundation models and implications for predictive skill and modeling efficiency. Advances in Water Resources 41, 49–64.
Schumann, G.-P., J. C. Neal, N. Voisin, K. M. Andreadis, F. Pappenberger, N. Phanthuwong-pakdee, A. C. Hall, & P. D. Bates (2013). A first large-scale flood inundation forecasting model. Water Resources Research 49(10), 6248–6257.
Soares-Fraz˜ao, S., J. Lhomme, V. Guinot, & Y. Zech (2008). Two-dimensional shallow-water model with porosity for urban flood modelling. Journal of Hydraulic Research 46(1), 45– 64.