DEPTOR modulates activation responses in CD4+ T cells
and enhances immunoregulation following transplantation
The MIT Faculty has made this article openly available.
Please share
how this access benefits you. Your story matters.
Citation
Wedel, Johannes et al. "DEPTOR modulates activation responses
in CD4+ T cells and enhances immunoregulation following
transplantation." American journal of transplantation 19 (2018):
77-88 © 2018 The Author(s)
As Published
10.1111/ajt.14995
Publisher
Wiley
Version
Author's final manuscript
Citable link
https://hdl.handle.net/1721.1/124694
Terms of Use
Creative Commons Attribution-Noncommercial-Share Alike
DEPTOR MODULATES ACTIVATION RESPONSES IN CD4
+T
CELLS AND ENHANCES IMMUNOREGULATION FOLLOWING
TRANSPLANTATION
Johannes Wedel1,2,3, Sarah Bruneau1,2,3, Kaifeng Liu1,2,3, Sek Won Kong3,4, Peter T. Sage5,6, David M. Sabatini7,8,9, Mathieu Laplante10, and David M. Briscoe1,2,3,*
1Transplant Research Program, Boston Children’s Hospital, Boston, MA 02115, USA.
2Division of Nephrology, Department of Medicine, Boston Children’s Hospital, Boston, MA 02115,
USA.
3Department of Pediatrics, Harvard Medical School, Boston, MA 02115, USA.
4Computational Health Informatics Program, Boston Children’s Hospital, Boston, MA 02115,
USA.
5Department of Microbiology and Immunobiology, Harvard Medical School, Boston, MA 02115,
USA.
6Evergrande Center for Immunologic Diseases, Harvard Medical School, Boston, MA 02115,
USA.
7Whitehead Institute for Biomedical Research, Cambridge, MA 02142, USA.
8Department of Biology, Massachusetts Institute of Technology, Cambridge, MA 02142, USA. 9Howard Hughes Medical Institute, Cambridge, MA 02142, USA.
10Centre de researche de l’Institut Universitaire de Cardiologie et de Pulmonologie de Quebec,
Universite Lavel, Faculte de Medecine, Quebec, QC, Canada.
Abstract
DEPTOR is an evolutionarily conserved cell-intrinsic binding partner of mTOR that functions as a negative regulator of signaling responses. In this study, we show that DEPTOR is expressed within CD4+ T cells, and we observed that its relative level of expression modulates differentiation as well as glucose utilization within CD4+ T effectors in vitro. Using knockin mice, we also find that induced expression of DEPTOR within CD4+ T regulatory cells stabilizes Foxp3 expression, shifts metabolism towards oxidative phosphorylation and increases survival and suppressive function. In
*Corresponding author: David M. Briscoe, M.D., [email protected].
Disclosure
The authors of this manuscript have conflicts of interest to disclose as described by the American Journal of Transplantation. Potential conflicts of interest are reviewed and managed by the Office of General Counsel at Boston Children’s Hospital. D.M.B. has received grant support and serves as a consultant to Compass Therapeutics, Cambridge MA. The other authors have no conflicts of interest to disclose.
HHS Public Access
Author manuscript
Am J Transplant
. Author manuscript; available in PMC 2020 January 01.Published in final edited form as:
Am J Transplant. 2019 January ; 19(1): 77–88. doi:10.1111/ajt.14995.
A
uthor Man
uscr
ipt
A
uthor Man
uscr
ipt
A
uthor Man
uscr
ipt
A
uthor Man
uscr
ipt
vivo, fully MHC mismatched cardiac allograft survival is significantly prolonged in knockin recipients and sustained recipient expression of DEPTOR in combination with costimulatory blockade induces long-term graft survival. Furthermore, we show that the induced expression of DEPTOR in CD4+ T effectors fails to inhibit acute allograft rejection. Rather, prolonged survival is dominantly mediated via induced expression and function of DEPTOR within recipient CD4+ T regulatory cells. These collective findings identify DEPTOR as a novel protein that functions in CD4+ T cells to augment immunoregulation in vitro and in vivo.
1 Introduction
Alloimmunity is characterized by the expansion and differentiation of CD4+ T cells into effector (Teff) and/or memory subsets in response to donor alloantigen.1 However, the simultaneous expansion of alloantigen-responsive CD4+Foxp3+ T regulatory cells (Tregs) controls effector immunity, and recent findings indicate that relative Treg activity may inhibit the progression of allograft rejection.2,3 Indeed, enhancing signals and events that promote CD4+ Treg expansion, function and/or subset stability has emerged as a key area for future therapeutic development.4,5 Thus, insights into mechanisms of CD4+Foxp3+ Treg cell function are of great significance in the field of transplantation.
Multiple studies indicate that the mechanistic target of rapamycin (mTOR) kinase functions in CD4+ T cell activation responses, protein translation and cellular metabolism to augment proliferation, differentiation and survival of Teff subsets.6–10 Importantly, mTOR signaling activity negatively regulates Foxp3 expression in CD4+ T cells11 and inhibits Treg cell differentiation, metabolism and function.6,9 Indeed, the inhibition and/or control of mTOR activity is currently established to result in the expansion and enhanced function of CD4+ Treg cells.11,12 mTOR is a serine/threonine kinase that serves as a critical sensor of cellular energy status13,14 and as an intermediary in diverse intracellular signaling responses.
6–9,15–19 It forms two distinct multiprotein complexes called mTORC120 and mTORC2,21
characterized by the association between mTOR and the scaffold proteins raptor and rictor respectively. In general, mTORC1 controls cell growth in part via the phosphorylation of S6K122 and 4E-BP1,20 key regulators of protein synthesis, whereas mTORC2 modulates activation and cell survival by the phosphorylation of the Akt21 and SGK23 kinases.
mTORC1 and mTORC2 regulate glycolytic as well as oxidative metabolism24,25 in as much as the intensity of the signaling response is thought to be associated with increased aerobic glycolysis and fatty acid synthesis.26 In contrast, low mTOR activity favors mitochondrial β-oxidation of free fatty acids and the inhibition of glucose utilization.26 Nevertheless, despite its importance in CD4+ T cell biology and its potential to regulate metabolism, little is known about the regulation of mTOR itself. However, there is increasing evidence that negative modulatory cell-intrinsic proteins are of biological significance in CD4+ T cell homeostasis.7,8,18,19
DEPTOR (Dishevelled, EGL-10, Pleckstrin [DEP]-domain containing mTOR interacting protein, also called DEPDC6; reviewed in 27) is an evolutionary conserved mTOR-binding partner that was originally described to modulate mTOR signaling in multiple myeloma cells.28 We previously identified a potent function for DEPTOR within vascular endothelial
A
uthor Man
uscr
ipt
A
uthor Man
uscr
ipt
A
uthor Man
uscr
ipt
A
uthor Man
uscr
ipt
cells,29 and it has been found to function in several other normal cell types including adipose tissue, myocytes and hepatocytes.30–32 DEPTOR is rapidly phosphorylated and targeted for ubiquitination and degradation following cellular activation,33 suggesting that it may function to sustain cellular quiescence and/or to regulate mTORC1/C2 interactions. In this study, we find that DEPTOR is expressed by CD4+ T cells and that its level of expression is reduced upon cellular activation. In addition, we find that sustained expression of CD4+ T cell DEPTOR influences Teff cell differentiation in vitro, but it has minimal effects on effector immunity in vivo. In contrast, we find that DEPTOR stabilizes Foxp3 expression, enhances Treg function and immunoregulation in vitro and in vivo. Furthermore, we find that induced expression of DEPTOR within CD4+ T cells, and specifically within Tregs, is sufficient to prolong allograft survival. Collectively, these studies identify DEPTOR as a key intracellular regulatory component of the CD4+ T cell activation response.
2 Materials and Methods
2.1 Mice
Male 6–8 week old C57BL/6 (H-2b), BALB/c (H-2d), C3H, B6.C-H-2bm12 and Ptprca transgenic (CD45.1) mice were purchased from the Jackson Laboratory (Bar Harbor, ME), and C57BL/6 Rag2−/−IL2Rγ−/− (ΔRag) double knock-out mice were purchased from Taconic (Germantown, NY). The rtTA TetOn DEPTOR mouse (DEP, on the C57BL/6 background) was generated in the laboratory of Dr. David M. Sabatini.30 DEP mice were fed with dox chow (200 mg dox/kg; Bio-Serv, Flemington, NJ) to induce DEPTOR in vivo. All protocols using mice were approved by the Institutional Animal Care and Use Committee at Boston Children’s Hospital, and comply with the NIH Guide for the Care and Use of Laboratory Animals.
2.2 Isolation and culture of CD4+ T cell subsets
CD4+ T cells were isolated from splenocytes using the EasySep mouse CD4+, naive CD4+ (CD25-CD44-CD45R-CD49b-TCRγ/δ-) and CD4+CD25+ T Cell Isolation Kits (Stemcell Technologies, Vancouver, Canada) according the manufacturer’s instructions. Cell culture and experiments were performed using established and standardized protocols34 and as outlined in the Supplemental Material. As indicated, CD4+ T cells were isolated from WT C57BL/6 mice as a control for analyses performed using DEP and iDEP mice.
2.3 TSDR methylation analysis
FACS-sorted cells were pelleted, frozen and processed for pyrosequencing by EpigenDx (Hopkinton, MA). Briefly, genomic DNA was isolated and bisulfite-modified. All 14 CpG islands within the promoter and intron 1 of the Foxp3 gene were amplified by PCR and pyrosequenced. Sequences were aligned to a reference mouse genome database and the percent converted (demethylated) cytosine to uracil/thymidine for each CpG site was determined.
A
uthor Man
uscr
ipt
A
uthor Man
uscr
ipt
A
uthor Man
uscr
ipt
A
uthor Man
uscr
ipt
2.4 Cardiac and skin transplantation
Heterotopic intraabdominal cardiac transplantation was performed as described by Corry et al.35 Following transplantation, graft survival was monitored by palpation of the heartbeat. Tail skin grafts were transplanted onto the thoracic wall as described36 and were secured with an adhesive bandage for the initial 5–6 days. Graft survival was monitored by daily inspection, and rejection was defined as >90% of the skin having evidence of necrosis, was crusted or had lifted. Recipients receiving dox chow were pretreated for at least one week prior to transplantation. In experiments where Treg cells were depleted peri-transplant via the injection of anti-CD25 (BioXcell, West Lebanon, NH, clone PC-61.5.3, 250 µg/i.p. on days −5, −2 and +2), efficacy of depletion was evaluated by flow cytometry. Recipients treated with anti-CD154 (CD40L; clone MR-1, BioXcell, West Lebanon, NH) received 200 µg/i.p. on days 0 and 2 post-transplantation.
2.5 Adoptive transfer studies
In general, adoptive transfer of Teff or Treg cells into ΔRag recipients of fully MHC mismatched BALB/c hearts was performed by tail vein injection (3×10⁶ CD4+ T cells/ animal) on day 2 post-transplantation. The function of DEPTOR in Tregs and/or Teffs was evaluated using congenic CD4+CD45.1+ T cells which were mixed in a 1:1 ratio with CD4+CD45.2+ DEP/iDEP T cells. Following adoptive transfer, the relative expansion of CD45.1/CD45.2 cells (from recipient splenocytes) was assessed by flow cytometry. Foxp3 stability was investigated following the adoptive transfer of CD4+CD25high T cells into ΔRag mice; the frequency of CD3+CD4+Foxp3+ cells within splenocytes was assessed after 3 and 5 weeks by flow cytometry.
2.6 Statistics
Statistical analyses were performed using the One-sample t-test, two-tailed Student’s t-test, One-way or Two-way ANOVA as indicated with previous testing of equality of variances. The Mann-Whitney test or Kruskal-Wallis test were used if variances were significantly different. P-values of less than 0.05 were considered significant. Statistical analysis of RNA-seq data used a more stringent adjusted P-value of <0.005 to identify genes that were considered differentially expressed. Heatmaps were generated using the heatmap.2 function in the gplots package (version 3.0.1) using the R Statistical Computing Environment (version 3.3.2).
3 Results
3.1 Expression of DEPTOR by CD4+ T cells
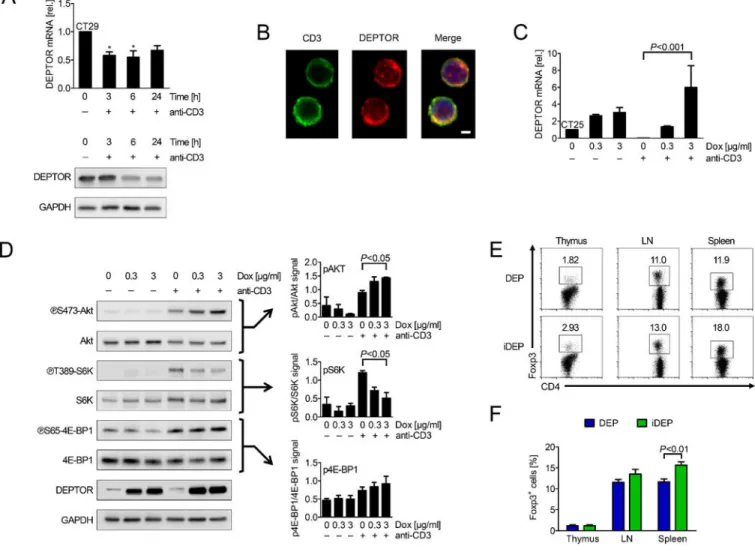
In initial studies, we observed that DEPTOR is expressed at high levels in unactivated wild type (WT) CD4+ T cells, and that its level of expression decreases at both mRNA and protein levels upon mitogen-activation (Figure 1A). We also found that DEPTOR is readily visualized by immunofluorescence and confocal microscopy both within unactivated CD4+ T cells (Figure 1B) as well as in sorted populations of both Foxp3+ Treg and CD4+ Teff subsets (data not shown). To determine the function of DEPTOR within each subset, we used doxycycline-inducible DEPTOR transgenic knockin mice30 (called DEP mice) in
A
uthor Man
uscr
ipt
A
uthor Man
uscr
ipt
A
uthor Man
uscr
ipt
A
uthor Man
uscr
ipt
which DEPTOR is inducible in multiple cell types. CD4+ T cells were isolated from DEP mice and their response to doxycycline (dox, 0–3 µg/ml) was evaluated in cell culture. We found that dox treatment consistently resulted in an increase in DEPTOR mRNA and protein levels (which we call iDEP cells), and increased expression of DEPTOR was sustained following activation (Figure 1C–D). In contrast, treatment of WT CD4+ T cells with dox failed to alter intrinsic DEPTOR expression patterns (Supplemental Figure 1A). By Western blot analysis (Figure 1D), we found reduced levels of pS6K(T389) and induced levels of pAkt(S473) in activated iDEP CD4+ T cells vs. DEP CD4+ T cells, suggesting that DEPTOR is functional to modulate mTORC1 and induce associated negative feedback loops, as previous reported.28,29 These collective findings indicate that DEPTOR is expressed by CD4+ T cells and that it functions to modulate mTORC1/mTORC2 interplay. We next fed DEP mice with dox chow (Supplemental Figure 1A) and performed a time-dependent analysis of the resultant CD4+ T cell phenotype. All mice remained
physiologically normal, and the relative numbers of CD3+, CD4+, CD8+ T cells, as well as naive and memory CD4+ subsets were similar to the numbers in DEP and WT mice (Supplemental Figure 1B). However, 6 to 12 weeks following dox treatment, we found a consistent increase in the number of CD4+Foxp3+ cells within the spleen of iDEP vs. DEP or WT mice (Figure 1E–F). These observations are suggestive that cell intrinsic DEPTOR may function in CD4+ T cells to regulate the expansion and/or survival of Tregs in vivo.
3.2 Levels of DEPTOR are of functional consequence in the differentiation of CD4+ Teff cells
mTORC1/C2 kinase activity is potent to regulate T helper cell (Th) differentiation and proliferation.9,10 To next test whether DEPTOR modulates Teff activity, naive CD4+ T cells from DEP mice were cultured with mitogen in Teff polarizing conditions and Th
differentiation was evaluated by qPCR and by ELISPOT (Figure 2A). While iDEP Th2 and Th17 cells produce lower amounts of IL-4 and IL-17 respectively vs. control DEP cells, induced DEPTOR in Th1 cells fails to inhibit, and rather increases IFN-γ production (Figure 2A). This latter finding is suggestive that DEPTOR may regulate mTOR-independent mechanisms of IFN-γ responsiveness in differentiated cells,37 for example STAT signaling as we reported in endothelial cells.29 However, by Western blot analysis, we failed to detect any appreciable effect of DEPTOR on cytokine-inducible STAT activity in CD4+ cells (Supplemental Figure 2).
To further examine if DEPTOR modulates Teff cell responses, DEP CD4+ T cells were activated with anti-CD3 alone in the absence or presence of dox (3 µg/ml), and phenotypic activation markers (CD25 and CD69), the expansion of memory subpopulations and cytokine production were evaluated. Overall, the phenotype of iDEP CD4+ Teff cells was unchanged from that observed in DEP cells following activation (Figure 2B and
Supplemental Figure 3A). Also, mitogen-induced proliferation of naive CD4+ T cells was not different among DEP and iDEP CD4+ T cells as assessed by CFSE dilution (Figure 2C) and 3H-thymidine incorporation (Supplemental Figure 3B), and there was no demonstrable effect of DEPTOR on IL-4, IL-17 and IFN-γ production (Supplemental Figure 3C) or activation-induced cell death as assessed by analysis of cleaved caspase-3 or Annexin V and
A
uthor Man
uscr
ipt
A
uthor Man
uscr
ipt
A
uthor Man
uscr
ipt
A
uthor Man
uscr
ipt
PI staining (Supplemental Figure 3D–E). Nevertheless, induced DEPTOR levels in iDEP CD4+ T cells was associated with an inhibition of glycolytic metabolism, as assessed by uptake of the fluorescent D-glucose analog 2-NBDG (Figure 2D). Thus, the marked reduction in intracellular DEPTOR levels observed following mitogen-dependent activation (Figure 1A) supports glycolytic metabolism, which enhances CD4+ Teff differentiation and function.38,39
3.3 DEPTOR modulates CD4+Foxp3+ Treg cell activity
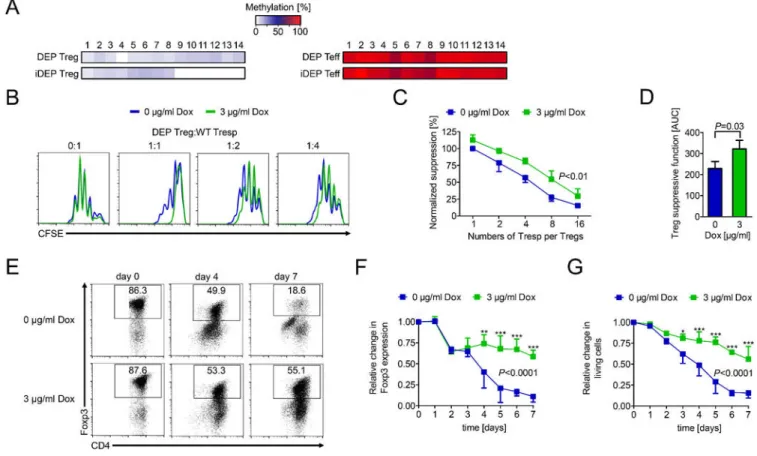
To identify the function of DEPTOR in CD4+ Tregs, we examined its effects on the epigenetic regulation of Foxp3 transcriptional activity. We performed pyrosequencing of CpG motifs within the Treg-specific demethylated region (TSDR) of the Foxp3 locus and found significant demethylation of CpG regions 9–14 within iDEP CD4+Foxp3+ Tregs vs. DEP Tregs (Figure 3A). This finding is suggestive that induced DEPTOR may enhance the stability of Foxp3 expression and CD4+ Treg immunomodulatory activity. We next cultured naive CD4+ T cells from DEP mice in rapamycin-free iTreg-inducing conditions in the absence or presence of dox (3 µg/ml; Supplemental Figure 4). These in vitro-generated Tregs (which we call ‘iTregs’) were evaluated in parallel with Tregs isolated from the spleens of mice (called simply ‘Tregs’). Consistently, iDEP iTregs were found to be more efficient than DEP iTregs in the suppression of responder proliferation (P<0.01; Figure 3B– D). Furthermore, we observed that cell survival was significantly higher, and Foxp3 expression persisted in iDEP iTregs following reactivation (Figure 3E–G).
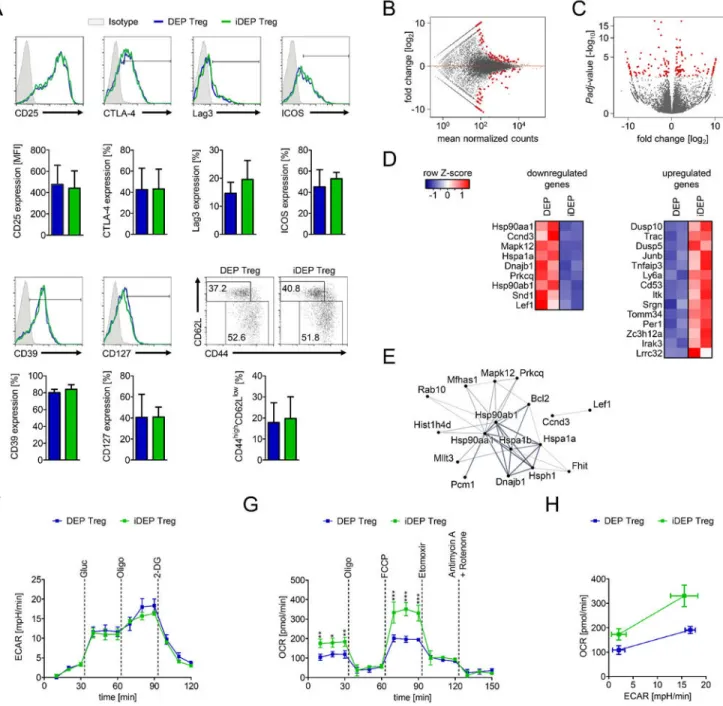
To examine the molecular mechanisms underlying the increased suppressive function of iDEP Tregs, we evaluated the expression of known immunoregulatory molecules including CD25, CTLA4, Lag3, ICOS and CD39 (Figure 4A), chemokine and other cell surface receptors (Supplemental Figure 5A) as well as effector/memory phenotypes by flow cytometry on iDEP vs. DEP Foxp3+ Treg cells. As illustrated in Figure 4A and Supplemental Figure 5A, we failed to observe any phenotypic differences by flow cytometry. However, by whole transcriptome RNA-sequencing (RNA-seq) we identified significant differences in the expression of 163 genes (adjusted P-value of <0.005; Figure 4B–E and Supplemental Data File 1). Gene ontology analysis (Supplemental Figure 5B) demonstrated that differentially expressed genes participate in PI-3K/Akt, MAPK and
NF-κB signaling. Furthermore, analysis of RNA-seq profiles suggested that induced DEPTOR
expression inhibits the production and response to proinflammatory cytokines as well as molecular networks associated with antigen presentation in Tregs. Also the expression of DEPTOR was found to be associated with an increased number of genes associated with oxidative phoshorylation vs. genes associated with glycolytic metabolism (Supplemental Figure 5C–D). These latter findings indicate that the biological effects of DEPTOR in CD4+ Tregs are likely associated with the modulation of intracellular signaling and/or shifts in cellular metabolism.
To confirm the effects of cell intrinsic DEPTOR on the modulation of cell metabolism, CD4+CD25+ Tregs were isolated from DEP and iDEP mice, stimulated with anti-CD3/anti-CD28 and IL-2 for 24 hours, and glycolysis and mitochondrial oxidative phosphorylation were evaluated by extracellular flux technology (Figure 4F–H). As illustrated in Figure 4F,
A
uthor Man
uscr
ipt
A
uthor Man
uscr
ipt
A
uthor Man
uscr
ipt
A
uthor Man
uscr
ipt
there was no difference in glycolytic activity (as assessed by the extracellular acidification rate, ECAR) in iDEP vs. DEP Tregs. In contrast, iDEP Tregs were found to have a significantly higher (P<0.05) basal oxygen consumption rate (OCR), and blockade of mitochondrial respiration with oligomycin decreased the OCR to levels observed in DEP Tregs (Figure 4G). Furthermore, the OCR was higher (P<0.001) in iDEP Tregs following addition of carbonyl cyanide-4-trifluoromethoxy phenylhydrazone (FCCP; Figure 4G), and was reduced following the addition of etomoxir (to inhibit mitochondrial fatty acid β-oxidation). These findings indicate that DEPTOR is potent to shift metabolism in Tregs towards oxidative phosphorylation (Figure 4H) and suggest that higher levels of cell intrinsic DEPTOR may increase Treg stability and function by enhancing mitochondrial β-oxidation.
3.4 Sustained expression of DEPTOR in CD4+ T cells inhibits allograft rejection via the augmentation of Treg function in vivo
We next evaluated the function of CD4+ T cell DEPTOR in vivo using either WT C57BL/6 mice or DEP transgenics as recipients of fully MHC mismatched BALB/c heterotopic heart transplants. Groups of mice were fed with either control or dox chow for at least one week pre-transplant and at all times post-transplantation. As illustrated in Figure 5A, we found that dox treatment of WT recipients had no effect on graft survival; all grafts failed by day 7 post-transplantation. In contrast, dox treatment of DEP recipients (to sustain the iDEP phenotype post-transplantation) resulted in a striking prolongation of graft survival with a median survival time (MST) of 35 days vs. 7 days in control chow treated DEP recipients (P<0.05). At the time of graft rejection, we found that DEPTOR expression was induced in iDEP recipients (data not shown). Nevertheless, there were fewer infiltrates and a most notable reduction in CD3+ T cells within allografts harvested from iDEP vs. DEP recipients on day 6 post-transplantation (Figure 5B). In addition, there was a trend for increased numbers of CD4+Foxp3+ Tregs and an overall decrease in the Teff/Treg ratio in iDEP vs. DEP recipients (Figure 5C–D), although this reduction was not as striking as the effect of DEPTOR on graft survival. Furthermore, induced expression of DEPTOR in iDEP recipients did not inhibit T cell priming as assessed by IFN-γ production following reactivation of recipient CD4+ T cells with donor antigen presenting cells (Figure 5E). Also, donor-specific IgM production was slightly reduced while donor-specific IgG antibody titers were not affected following induced expression of recipient DEPTOR (Figure 5F).
To determine the function of DEPTOR within the CD4+ T cell compartment, BALB/c hearts were transplanted into C57BL/6 Rag2−/−IL2Rγ−/− (ΔRag) recipients that were fed either control or dox chow. Subsequently, DEP or iDEP CD4+ T cells were adoptively transferred into recipients on day 2 post-transplantation. As illustrated in Figure 6A, we found that induced expression of DEPTOR within the transferred CD4+ T cells prolongs allograft survival. To next dissect the select function of DEPTOR in recipient CD4+ Teff and Treg subsets, we used a congenic approach where the relative function of DEPTOR in Tregs vs. Teff cells was evaluated in vivo. Congenic CD45.1+ WT CD4+ T cells and CD45.2+ DEP CD4+ T cells (in a ratio of 1:1) were adoptively transferred into recipients on day 2 post-transplantation and the relative expansion of each subset was assessed by flow cytometry (Figure 6B and C). We found that the ratio of CD45.2+/CD45.1+ cells remained unchanged over a 10-day period, suggesting that DEPTOR primarily functions via the augmentation of
A
uthor Man
uscr
ipt
A
uthor Man
uscr
ipt
A
uthor Man
uscr
ipt
A
uthor Man
uscr
ipt
CD4+ Treg activity (i.e. limiting the expansion of alloreactive WT CD45.1+ cells). To further investigate DEPTOR function in CD4+ Teffs in vivo, we adoptively transferred either DEP/ iDEP CD4+CD25- Teffs alone, or a combination of DEP/iDEP CD4+CD25- Teffs with WT CD4+CD25high Treg cells, into ΔRag recipients of BALB/c heart transplants and graft survival was monitored (Figure 6D). As illustrated, sustained DEPTOR expression in iDEP CD4+CD25- Teff cells had a minimal effect on the prolongation of allograft survival vs. DEP Teffs. We also evaluated the survival of B6.C-H-2bm12 skin allografts transplanted onto DEP/iDEP recipients where rejection is dependent on Teff activity. As illustrated in Supplemental Figure 6A, we found that survival was not different in DEP vs. iDEP recipients. Collectively, these findings suggest that induced expression of DEPTOR in Teff cells has minimal biological effects on their expansion and activity, and fails to impact allograft rejection in vivo.
To further identify the in vivo function of induced DEPTOR within Tregs, DEP
CD4+CD25high cells were transferred in combination with WT CD4+CD25- Teffs into ΔRag recipients of fully MHC mismatched BALB/c heart transplants (Figure 6E). While
cotransfer resulted in early graft failure in recipients fed control chow (MST of 13 days), dox-treatment of recipients again resulted in prolonged graft survival (MST 27 days, P<0.01). We also transferred CD4+CD25high DEP or iDEP Tregs into ΔRag mice fed either control or dox chow respectively, and we assessed the persistence of Foxp3+ cells by sequential flow cytometric analysis. Similar numbers of CD3+CD4+Foxp3+ Tregs were recovered from spleens after 3 weeks, but significantly more iDEP Tregs were recovered after 5 weeks (Figure 6F) and Foxp3 expression was sustained in these surviving iDEP Tregs (Figure 6G).
In a final series of experiments, we treated DEP and iDEP recipients of fully MHC
mismatched BALB/c allografts with anti-CD154 (CD40L) on days 0 and 2. This treatment is well established to inhibit Teff expansion,40 and we postulated that induced expression of DEPTOR will support long-term graft survival. We found that anti-CD40L prolonged graft survival in DEP recipients fed control chow (vs. untreated recipients), but all grafts were rejected by day 30 post-transplantation. In contrast, long-term graft survival was most notable in dox-treated iDEP recipient mice that received anti-CD40L (Figure 6H; all >100 days, P<0.0001). We evaluated tolerance induction in these recipients by transplanting skin grafts from either donor (BALB/c; H-2d) or third party (C3H; H-2k) in combination with recipient isografts (C57BL/6; H-2b) onto day 60 long-term survivors. While all isografts were accepted, both donor and third party skins were rejected (Supplemental Figure 6B). Furthermore, we observed that the long term surviving cardiac allografts were rejected within 2 days of the donor skin graft rejection (data not shown). Collectively, these data suggest that induced expression of recipient DEPTOR fails to inhibit alloimmune Teff activity, and that rejection is dependent of the relative ability of iDEP Tregs to inhibit the clonal size and/or relative expansion of alloreactive Teff subpopulations.
We also treated iDEP recipient mice with anti-CD25 on days −5, −2 and +2 pre/post-transplantation to reduce the number of recipient circulating CD4+Foxp3+ T cells (Figure 6I–J). In this physiological model, we observed that peri-transplant reduction of the Treg frequency with anti-CD25 completely abolished the graft prolonging effect of induced
A
uthor Man
uscr
ipt
A
uthor Man
uscr
ipt
A
uthor Man
uscr
ipt
A
uthor Man
uscr
ipt
recipient DEPTOR (Figure 6I, P<0.05), while having no effect on graft survival in control recipients fed control chow. These collective findings indicate that intracellular DEPTOR functions to promote immunoregulation in vivo, and its biological effects in Tregs have significant implications for graft survival following transplantation.
4 Discussion
In these studies, we show that endogenous DEPTOR regulates Teff and Treg activity in vitro and in vivo, and we find that its relative level of expression is associated with shifts in cellular metabolism. Notably, we find that sustained DEPTOR expression stabilizes CD4+ Tregs by inducing oxidative metabolism and Foxp3 promoter activity in vitro, and enhances Treg function in vivo. Sustained CD4+ T cell DEPTOR expression is associated with prolonged graft survival and enhanced immunoregulation following transplantation. In this manner, our findings identify an essential role for DEPTOR in CD4+ T cell homeostasis and indicate that it may be critical to augment Treg activity and stability.
Since DEPTOR regulates both mTORC1 and mTORC2 in CD4+ T cells, we had anticipated that sustained expression would inhibit Teff cell activation and differentiation, as described using rapamycin as well as genetic approaches that target mTORC1 activity.9,10,37 Indeed, its effect to modulate Th2 and Th17 effector differentiation is consistent with these reports. However, our findings that increased DEPTOR expression fails to inhibit Th1
differentiation/activity or the activation of naive CD4+ T cells with anti-CD3 suggests that its biology is more complex. The modulation of mTORC1 alone in CD4+ T cells may have no detectable effect37 or it may reduce10 Th1 activity. It has been proposed that DEPTOR is of minimal consequence once mTOR activity is high,30,32 and thus it is not surprising that it has minimal effects to inhibit IFN-γ production. It is however possible that its modulatory effects on cytokine production may only occur under conditions where mTORC1 activity is restrained.30,32 In this manner, DEPTOR may modulate Th1 responses in CD4+ T cells under conditions where mTOR activity is in resolution and/or at low levels (e.g. following rapamycin treatment). Nevertheless, selective overexpression of DEPTOR in Teff
populations had a minimal effect on the alloimmune response in vivo. Thus, it is not surprising that graft survival is unchanged following transplantation when the expression of DEPTOR is regulated selectively within Teff cells.
The biological effects of DEPTOR resemble those observed following partial inhibition of mTORC1 activity by rapamycin.16 Moreover, since DEPTOR is induced following mTORC1 inhibition,27,28 its effects seen in this report may be reflective of its primary role to augment CD4+ Treg activity. Alternatively, DEPTOR may function via interactions with other molecules and/or signaling pathways independent of mTOR. Indeed, DEPTOR regulates STAT129 or MAPK41,42 signaling, indicating that its expression is associated with a general modulation of pro-inflammatory responses. However, we did not observe any significant effect of DEPTOR on STAT or MAPK activity in CD4+ T cells. Since DEPTOR is reduced in expression upon mitogen-activation, we interpret our collective findings to indicate that it does not function in the course of an active pro-inflammatory response or under conditions where mTOR activity is high. Once re-expressed during inflammation resolution, we propose that DEPTOR shifts metabolism within the CD4+ T cell population
A
uthor Man
uscr
ipt
A
uthor Man
uscr
ipt
A
uthor Man
uscr
ipt
A
uthor Man
uscr
ipt
that in turn supports a return to basal homeostasis. In this manner, the primary function of DEPTOR in CD4+ T cells is to realign multiple regulatory signaling networks in the course of inflammation resolution that ultimately enhance Treg activity, survival and lineage stability.
DEPTOR also targets mTORC2 signaling,28 which has been linked to Treg lineage stability through epigenetic changes within the TSDR of the Foxp3 promoter.6,7,19 Consistent with this interaction, induced expression of DEPTOR is associated with a reduction in the methylation status of the TSDR, which also explains its potent biological effects on Treg activity. Increased transcriptional Foxp3 activity through epigenetic changes can itself shift cellular metabolism towards oxidative phosphorylation43,44 that influences Teff and Treg responses.45,46
Overall, there are multiple mechanisms whereby cell intrinsic DEPTOR interfaces with immunity to ultimately promote CD4+ Treg function and immunoregulation in vitro and in vivo. In this report, we show that its biology within the CD4+ T cell is of great significance to prolong allograft survival following transplantation. However, DEPTOR is likely of functional importance in other immune cell types, including for example, B cells, antigen presenting and stromal cells, and where sustained expression may also inhibit pro-inflammation/rejection and/or promote an immunoregulatory phenotype. Although an analysis of its expression and function in other immune cells is beyond the scope of this report, they will likely become the subject of additional studies in the future.
The translational implications of these findings are that pharmacologics that target activation-induced degradation of DEPTOR (for example, MLN492433,47,48) may serve as pro-tolerogenic agents post-transplantation. Recent strategies to augment transplant tolerance using novel therapeutics,49 cellular therapy50 and/or the development of bone marrow chimerism51 are limited by the instability of Tregs and their potential to
dedifferentiate into effectors that cause rejection. Our findings in this report indicate that pharmacological augmentation of intracellular DEPTOR has the potential to stabilize Tregs, thereby enhancing the long-term efficacy of new immunomodulatory therapeutics following solid organ transplantation.
In summary, we identify DEPTOR as a cell intrinsic modulator of CD4+ T cell activation, and we show that its expression shapes metabolic programming to enhance
immunoregulatory function. Our findings have novel mechanistic implications in the control of alloimmunity and provide insight into the regulation of CD4+ Treg cell function that has broad biological significance in vivo.
Supplementary Material
Refer to Web version on PubMed Central for supplementary material.
Acknowledgments
The authors thank Megan Cooper, Evelyn Flynn, Kayla MacLeod, Nora Kochupurakkal, Moufida Ben Nasr and Gulcin Demirci (all Boston Children’s Hospital, Boston, MA) for technical support. We also acknowledge Arlene Sharpe (Evergrande Center for Immunological Diseases, Harvard Medical School) for support in the performance
A
uthor Man
uscr
ipt
A
uthor Man
uscr
ipt
A
uthor Man
uscr
ipt
A
uthor Man
uscr
ipt
of RNA-seq and Terry Strom (Beth Israel Deaconess Medical Center, Boston, MA) for scientific discussions. This work was supported by the NIH grants R21AI114223 and R01AI136503, an Advancing Research in
Transplantation Science Investigator Initiated Grant from Pfizer Inc. and by the Casey Lee Ball Foundation to D.M.B. J.W. was supported by a fellowship grant from the German Research Foundation (DFG) and by a travel grant from the Medical Faculty Mannheim, Heidelberg University, Germany.
Abbreviations
ΔRag C57BL/6 Rag2−/−IL2Rγ−/−
2-NBDG 2-N-7-nitrobenz-2-oxa-1,3-diazol-4-yl-amino-2-deoxyglucose
DEP rtTA TetOn DEPTOR mouse
DEPTOR Dishevelled, EGL-10, Pleckstrin -domain containing mTOR interacting protein
ECAR extracellular acidification rate
FCCP carbonyl cyanide-4-trifluoromethoxy phenylhydrazone
MST median survival time
mTOR mechanistic target of rapamycin
OCR oxygen consumption rate
RNA seq RNA-sequencing
Teff effector T cells
Th T helper cell
Treg T regulatory cell
TSDR Treg-specific demethylated region
WT wild type
References
1. Nankivell BJ, Alexander SI. Rejection of the kidney allograft. N Engl J Med 2010;363(15):1451– 1462. [PubMed: 20925547]
2. Nadig SN, Wieckiewicz J, Wu DC et al. In vivo prevention of transplant arteriosclerosis by ex vivo-expanded human regulatory T cells. Nat Med 2010;16(7):809–813. [PubMed: 20473306]
3. Tang Q, Bluestone JA. Regulatory T-cell therapy in transplantation: moving to the clinic. Cold Spring Harb Perspect Med 2013;3(11).
4. Joffre O, Santolaria T, Calise D et al. Prevention of acute and chronic allograft rejection with CD4+CD25+Foxp3+ regulatory T lymphocytes. Nat Med 2008;14(1):88–92. [PubMed: 18066074] 5. Li XC, Turka LA. An update on regulatory T cells in transplant tolerance and rejection. Nat Rev
Nephrol 2010;6(10):577–583. [PubMed: 20683480]
6. Zeng H, Yang K, Cloer C et al. mTORC1 couples immune signals and metabolic programming to establish T(reg)-cell function. Nature 2013;499(7459):485–490. [PubMed: 23812589]
7. Huynh A, DuPage M, Priyadharshini B et al. Control of PI(3) kinase in Treg cells maintains homeostasis and lineage stability. Nat Immunol 2015;16(2):188–196. [PubMed: 25559257]
A
uthor Man
uscr
ipt
A
uthor Man
uscr
ipt
A
uthor Man
uscr
ipt
A
uthor Man
uscr
ipt
8. Yang K, Neale G, Green DR et al. The tumor suppressor Tsc1 enforces quiescence of naive T cells to promote immune homeostasis and function. Nat Immunol 2011;12(9):888–897. [PubMed: 21765414]
9. Delgoffe GM, Kole TP, Zheng Y et al. The mTOR kinase differentially regulates effector and regulatory T cell lineage commitment. Immunity 2009;30(6):832–844. [PubMed: 19538929] 10. Delgoffe GM, Pollizzi KN, Waickman AT et al. The kinase mTOR regulates the differentiation of
helper T cells through the selective activation of signaling by mTORC1 and mTORC2. Nat Immunol 2011;12(4):295–303. [PubMed: 21358638]
11. Sauer S, Bruno L, Hertweck A et al. T cell receptor signaling controls Foxp3 expression via PI3K, Akt, and mTOR. Proc Natl Acad Sci U S A 2008;105(22):7797–7802. [PubMed: 18509048] 12. Zeiser R, Leveson-Gower DB, Zambricki EA et al. Differential impact of mammalian target of
rapamycin inhibition on CD4+CD25+Foxp3+ regulatory T cells compared with conventional CD4+ T cells. Blood 2008;111(1):453–462. [PubMed: 17967941]
13. Barbet NC, Schneider U, Helliwell SB et al. TOR controls translation initiation and early G1 progression in yeast. Mol Biol Cell 1996;7(1):25–42. [PubMed: 8741837]
14. Hara K, Yonezawa K, Weng QP et al. Amino acid sufficiency and mTOR regulate p70 S6 kinase and eIF-4E BP1 through a common effector mechanism. J Biol Chem 1998;273(23):14484–14494. [PubMed: 9603962]
15. Tan H, Yang K, Li Y et al. Integrative Proteomics and Phosphoproteomics Profiling Reveals Dynamic Signaling Networks and Bioenergetics Pathways Underlying T Cell Activation. Immunity 2017;46(3):488–503. [PubMed: 28285833]
16. Kang SA, Pacold ME, Cervantes CL et al. mTORC1 phosphorylation sites encode their sensitivity to starvation and rapamycin. Science 2013;341(6144):1236566.
17. Procaccini C, De Rosa V, Galgani M et al. An oscillatory switch in mTOR kinase activity sets regulatory T cell responsiveness. Immunity 2010;33(6):929–941. [PubMed: 21145759]
18. Park Y, Jin HS, Lopez J et al. TSC1 regulates the balance between effector and regulatory T cells. J Clin Invest 2013;123(12):5165–5178. [PubMed: 24270422]
19. Shrestha S, Yang K, Guy C et al. Treg cells require the phosphatase PTEN to restrain TH1 and TFH cell responses. Nat Immunol 2015;16(2):178–187. [PubMed: 25559258]
20. Hara K, Maruki Y, Long X et al. Raptor, a binding partner of target of rapamycin (TOR), mediates TOR action. Cell 2002;110(2):177–189. [PubMed: 12150926]
21. Sarbassov DD, Guertin DA, Ali SM et al. Phosphorylation and regulation of Akt/PKB by the rictor-mTOR complex. Science 2005;307(5712):1098–1101. [PubMed: 15718470]
22. Holz MK, Blenis J. Identification of S6 kinase 1 as a novel mammalian target of rapamycin (mTOR)-phosphorylating kinase. J Biol Chem 2005;280(28):26089–26093. [PubMed: 15905173] 23. Hong F, Larrea MD, Doughty C et al. mTOR-raptor binds and activates SGK1 to regulate p27
phosphorylation. Mol Cell 2008;30(6):701–711. [PubMed: 18570873]
24. Cunningham JT, Rodgers JT, Arlow DH et al. mTOR controls mitochondrial oxidative function through a YY1-PGC-1alpha transcriptional complex. Nature 2007;450(7170):736–740. [PubMed: 18046414]
25. Meng ZX, Li S, Wang L et al. Baf60c drives glycolytic metabolism in the muscle and improves systemic glucose homeostasis through Deptor-mediated Akt activation. Nat Med 2013;19(5):640– 645. [PubMed: 23563706]
26. Duvel K, Yecies JL, Menon S et al. Activation of a metabolic gene regulatory network downstream of mTOR complex 1. Mol Cell 2010;39(2):171–183. [PubMed: 20670887]
27. Caron A, Briscoe DM, Richard D et al. DEPTOR at the nexus of cancer, metabolism and immunity. Physiol Rev 2018;in press.
28. Peterson TR, Laplante M, Thoreen CC et al. DEPTOR is an mTOR inhibitor frequently overexpressed in multiple myeloma cells and required for their survival. Cell 2009;137(5):873– 886. [PubMed: 19446321]
29. Bruneau S, Nakayama H, Woda CB et al. DEPTOR regulates vascular endothelial cell activation and proinflammatory and angiogenic responses. Blood 2013;122(10):1833–1842. [PubMed: 23881914]
A
uthor Man
uscr
ipt
A
uthor Man
uscr
ipt
A
uthor Man
uscr
ipt
A
uthor Man
uscr
ipt
30. Laplante M, Horvat S, Festuccia WT et al. DEPTOR cell-autonomously promotes adipogenesis, and its expression is associated with obesity. Cell Metab 2012;16(2):202–212. [PubMed: 22883231]
31. Gonzalez-Teran B, Lopez JA, Rodriguez E et al. p38gamma and delta promote heart hypertrophy by targeting the mTOR-inhibitory protein DEPTOR for degradation. Nat Commun 2016;7:10477. [PubMed: 26795633]
32. Caron A, Mouchiroud M, Gautier N et al. Loss of hepatic DEPTOR alters the metabolic transition to fasting. Mol Metab 2017;6(5):447–458. [PubMed: 28462079]
33. Duan S, Skaar JR, Kuchay S et al. mTOR generates an auto-amplification loop by triggering the betaTrCP- and CK1alpha-dependent degradation of DEPTOR. Mol Cell 2011;44(2):317–324. [PubMed: 22017877]
34. Coligan JE, Bierer BE, Margulies DH et al. Current Protocols in Immunology 2017.
35. Corry RJ, Winn HJ, Russell PS. Primarily vascularized allografts of hearts in mice. The role of H-2D, H-2K, and non-H-2 antigens in rejection. Transplantation 1973;16(4):343–350. [PubMed: 4583148]
36. Bailey DW, Usama B. A rapid method of grafting skin on tails of mice. Transplant Bull 1960;7:424–425. [PubMed: 13795836]
37. Kurebayashi Y, Nagai S, Ikejiri A et al. PI3K-Akt-mTORC1-S6K1/2 axis controls Th17 differentiation by regulating Gfi1 expression and nuclear translocation of RORgamma. Cell Rep 2012;1(4):360–373. [PubMed: 22832227]
38. Chang CH, Curtis JD, Maggi LB, Jr. et al. Posttranscriptional control of T cell effector function by aerobic glycolysis. Cell 2013;153(6):1239–1251. [PubMed: 23746840]
39. Peng M, Yin N, Chhangawala S et al. Aerobic glycolysis promotes T helper 1 cell differentiation through an epigenetic mechanism. Science 2016;354(6311):481–484. [PubMed: 27708054] 40. Taylor PA, Noelle RJ, Blazar BR. CD4(+)CD25(+) immune regulatory cells are required for
induction of tolerance to alloantigen via costimulatory blockade. J Exp Med 2001;193(11):1311– 1318. [PubMed: 11390438]
41. Gao D, Inuzuka H, Tan MK et al. mTOR drives its own activation via SCF(betaTrCP)-dependent degradation of the mTOR inhibitor DEPTOR. Mol Cell 2011;44(2):290–303. [PubMed: 22017875]
42. Zhao Y, Xiong X, Sun Y. DEPTOR, an mTOR Inhibitor, Is a Physiological Substrate of
SCF(betaTrCP) E3 Ubiquitin Ligase and Regulates Survival and Autophagy. Mol Cell 2011;44(2): 304–316. [PubMed: 22017876]
43. Howie D, Cobbold SP, Adams E et al. Foxp3 drives oxidative phosphorylation and protection from lipotoxicity. JCI Insight 2017;2(3):e89160. [PubMed: 28194435]
44. Angelin A, Gil-de-Gomez L, Dahiya S et al. Foxp3 Reprograms T Cell Metabolism to Function in Low-Glucose, High-Lactate Environments. Cell Metab 2017.
45. Lee CF, Lo YC, Cheng CH et al. Preventing Allograft Rejection by Targeting Immune Metabolism. Cell Rep 2015;13(4):760–770. [PubMed: 26489460]
46. Beier UH, Angelin A, Akimova T et al. Essential role of mitochondrial energy metabolism in Foxp3(+) T-regulatory cell function and allograft survival. FASEB J 2015;29(6):2315–2326. [PubMed: 25681462]
47. Sarantopoulos J, Shapiro GI, Cohen RB et al. Phase I Study of the Investigational NEDD8-Activating Enzyme Inhibitor Pevonedistat (TAK-924/MLN4924) in Patients with Advanced Solid Tumors. Clin Cancer Res 2016;22(4):847–857. [PubMed: 26423795]
48. Shah JJ, Jakubowiak AJ, O’Connor OA et al. Phase I Study of the Novel Investigational NEDD8-Activating Enzyme Inhibitor Pevonedistat (MLN4924) in Patients with Relapsed/Refractory Multiple Myeloma or Lymphoma. Clin Cancer Res 2015;22(1):34–43. [PubMed: 26561559] 49. Page EK, Dar WA, Knechtle SJ. Tolerogenic therapies in transplantation. Front Immunol
2012;3:198. [PubMed: 22826708]
50. Guinan EC, Cole GA, Wylie WH et al. Ex Vivo Costimulatory Blockade to Generate Regulatory T Cells From Patients Awaiting Kidney Transplantation. Am J Transplant 2016;16(7):2187–2195. [PubMed: 26790369]
A
uthor Man
uscr
ipt
A
uthor Man
uscr
ipt
A
uthor Man
uscr
ipt
A
uthor Man
uscr
ipt
51. Kawai T, Cosimi AB, Spitzer TR et al. HLA-mismatched renal transplantation without maintenance immunosuppression. N Engl J Med 2008;358(4):353–361. [PubMed: 18216355]
A
uthor Man
uscr
ipt
A
uthor Man
uscr
ipt
A
uthor Man
uscr
ipt
A
uthor Man
uscr
ipt
Figure 1. DEPTOR is expressed and is functional in CD4+ T cells.
(A) WT CD4+ T cells were activated with anti-CD3 (1 μg/ml) for 3–24 hours in vitro. DEPTOR mRNA (upper panel) and protein (lower panel) expression was evaluated by qPCR and Western blot analysis, respectively. Bars represent mean ± SD of 3 independent
experiments (Kruskal-Wallis test; *P<0.05). (B) DEPTOR (red) and CD3 (green) were visualized in unactivated CD4+ T cells by immunofluorescence staining and imaging by confocal microscopy (scale bar represents 2 μm). Representative of 3 independent experiments. (C) mRNA expression of DEPTOR in CD4+ T cells isolated from DEPTOR knockin mice (DEP cells) following dox treatment. Bars represent the mean ± SD of 3 independent experiments (Kruskal-Wallis test). (D) DEP CD4+ T cells were isolated and pretreated with dox, and subsequently activated with anti-CD3 (1 μg/ml) for 6 hours; Left: Representative Western blot analysis; Right: Densitometric analysis of 4 independent blots (One-way ANOVA). (E and F) The frequency of CD4+Foxp3+ Tregs from DEP/iDEP mice receiving control or dox chow for 12 weeks was evaluated by flow cytometry. (E)
Representative dotplots and (F) bar graphs (mean ± SD, Student’s t-test) of findings in n=8 animals/group.
A
uthor Man
uscr
ipt
A
uthor Man
uscr
ipt
A
uthor Man
uscr
ipt
A
uthor Man
uscr
ipt
Figure 2. CD4+ DEPTOR modulates T effector differentiation and glucose metabolism.
(A) Naïve DEP CD4+ T cells were cultured in Th1 (IFN-γ), Th2 (IL-4) or Th17 (IL-17A) polarizing conditions in the absence or presence of dox (3 μg/ml). Differentiation was assessed by ELISPOT (upper panels) and by qPCR (lower panels). Bars represent the mean number of spots ± SD of 3 independent experiments (Upper Panel: Student’s t-test; Lower Panel: One-sample t-test). (B and C) DEP CD4+ T cells were pretreated with dox (3 μg/ml) and subsequently activated with anti-CD3 alone or in combination with anti-CD28 (both at 1 μg/ml) for 3 days. (B) The expression of CD25 and CD69 were evaluated by flow cytometry. Bar graphs illustrate the mean expression ± SD of 3 independent experiments (One-way ANOVA; P=n.s.). (C) The proliferation of DEP/iDEP CD4+ T cells was assessed by CFSE dilution and expansion indices were calculated (n=3, Student’s t-test; P=n.s.). The grey histograms represent unstimulated DEP cells. (D) DEP CD4+ T cells were pretreated with dox (3 μg/ml) and with anti-CD3 and anti-CD28 (both at 1 μg/ml) for 24 hours.
Subsequently, glucose uptake was evaluated by 2-NBDG flow cytometry. Statistics was performed on a mean of 3 independent experiments (Bar graphs, One-way ANOVA).
A
uthor Man
uscr
ipt
A
uthor Man
uscr
ipt
A
uthor Man
uscr
ipt
A
uthor Man
uscr
ipt
Figure 3. DEPTOR augments Treg stability and function in vitro.
(A) CD4+Foxp3- Teffs and CD4+Foxp3+ Tregs were isolated from DEP/iDEP mice and methylation of the TSDR was assessed by bisulfite-conversion and pyrosequencing. Heat maps represent the methylation of 14 CpG islands. One of 2 experiments with similar results is depicted. (B–D) DEP and iDEP Treg function was assessed in suppression assays using CFSE-labeled naive CD4+ cells as responders (Tresp) with increasing ratios of DEP/iDEP iTregs. Tresp proliferation was assessed by CFSE-dilution using flow cytometry. (B) Representative histograms of 3 independent experiments. (C) Expansion indices normalized for Treg suppressive capacity ± SD (Two-way ANOVA). (D) The area-under-the-curve (AUC) of normalized suppression for each experiment. Statistics were performed using the mean AUC ± SD (Student’s t-test). (E–G) Foxp3 expression was evaluated for up to 7 days following the activation of DEP/iDEP iTregs with anti-CD3 and anti-CD28 (both at 1 μg/ml) in the absence or presence of dox (3 μg/ml). (E) Representative dotplots and (F) statistical analysis showing the relative change in Foxp3 expression within CD4+ T cell cultures ± SD over a 7 day period. (G) Bars represent the percentage of living cells ± SD (Two-way ANOVA; 0 μg/ml vs. 3 μg/ml dox: *P<0.05, **P<0.01, ***P<0.001; n=3).
A
uthor Man
uscr
ipt
A
uthor Man
uscr
ipt
A
uthor Man
uscr
ipt
A
uthor Man
uscr
ipt
Figure 4. Induced expression of DEPTOR in Tregs increases oxidative phosphorylation through mitochondrial β-oxidation.
(A) The effector/memory phenotype of CD4+Foxp3+ Tregs from DEP/iDEP mice; Upper Panels: Representative histograms and dotplots; Lower Panels: Mean fluorescence intensity (MFI)/positivity ± SD in 7 animals per group (Student’s t-test; P=n.s.). (B) Bland-Altman plot, and (C) Volcano plot of RNA-seq transcriptomes comparing iDEP vs. DEP
CD4+CD25high Tregs. Differentially expressed genes (adjusted P<0.005) are highlighted in red. (D) Heatmaps of selected genes that were either downregulated (left) or upregulated (right) following induced expression of DEPTOR in iDEP Tregs. (E) Functional protein-protein interaction network analysis of significant downregulated genes. (F–H) Metabolic
A
uthor Man
uscr
ipt
A
uthor Man
uscr
ipt
A
uthor Man
uscr
ipt
A
uthor Man
uscr
ipt
capacity of DEP and iDEP CD4+CD25high Tregs as assessed by extracellular flux technology. (F) Glycolysis was evaluated by measuring the extracellular acidification rate (ECAR) following the sequential addition of glucose (Gluc), oligomycin (Oligo) and 2-deoxy glucose (2-DG). (G) Oxidative phosphorylation was evaluated by measuring the oxygen consumption rate (OCR) following the sequential addition of oligomycin (Oligo), carbonyl cyanide-4-trifluoromethoxy-phenylhydrazone (FCCP), etomoxir, and antimycin A and rotenone into cultures. (H) The metabolic phenotype as a ratio of glycolytic and oxidative activity at baseline and in maximal stressed cells (FCCP and oligomycin). One representative of 2 independent experiments is depicted (mean ECAR/OCR ± SD of triplicate conditions, Two-way ANOVA *P<0.05, **P<0.01, ***P<0.0001).
A
uthor Man
uscr
ipt
A
uthor Man
uscr
ipt
A
uthor Man
uscr
ipt
A
uthor Man
uscr
ipt
Figure 5. Sustained expression of DEPTOR within CD4+ T cells prolongs cardiac allograft survival.
(A) Graft survival following the transplantation of fully MHC mismatched BALB/c hearts into DEP/iDEP recipient mice. Wild type C57BL/6 mice (WT) served as controls. (B) Representative images of allograft histology on day 6 post-transplantation (bars represent 100 μm). (C and D) DEP/iDEP recipient splenocytes were isolated on day 6 post-transplantation and the relative expansion of naive/memory Teffs and Foxp3+ Tregs was evaluated by flow cytometry. (C) Representative dotplots and (D) bar graphs of CD44 and CD62L expression on Teffs and Foxp3+ Tregs gated within the CD4+ cell population (n=4 animals/group); Left Panel: mean ± SD, Student’s t-test; Right Panel: mean ratio of CD44highCD62Llow Teffs to Foxp3+ Tregs ± SD, Student’s t-test. (E) CD4+ T cells were isolated on day 6 post-transplantation, co-cultured with irradiated BALB/c splenocytes and IFN-γ production was evaluated by ELISPOT. Bars represent the mean spots/well ± SD in 4 animals (n=2 animals/group per experiment, performed twice in triplicate; Student’s ttest). (F) Serum from DEP/iDEP recipients on day 6 post-transplantation was evaluated for the production of donor-specific antibody production using flow cytometry. Bar graphs represent the mean antibody titer ± SD (n=4 animals/group; Student’s t-test).
A
uthor Man
uscr
ipt
A
uthor Man
uscr
ipt
A
uthor Man
uscr
ipt
A
uthor Man
uscr
ipt
Figure 6. DEPTOR enhances immunoregulation to prolong allograft survival.
(A) Kaplan-Meier graft survival curves following the adoptive transfer of DEP/iDEP CD4+ T cells into ΔRag recipients of BALB/c hearts on day 2 post-transplantation. (B and C) Congenic CD4+CD45.1+ T cells (C57BL/6) in a 1:1 ratio with CD4+CD45.2+ DEP/iDEP T cells were adoptively transferred into ΔRag recipients of BALB/c hearts on day 2 post-transplantation. The ratio of CD45.2+/CD45.1+ CD3+CD4+ T cells was assessed by flow cytometry on day 10 post-transfer. (B) Representative dotplots and (C) bar graphs illustrating the mean CD45.1+/CD45.2+ ratio ± SD of 4 animals/group (Student’s t-test; P=n.s.). (D) Kaplan-Meier graft survival curves following the adoptive transfer of DEP/ iDEP CD4+CD25- Teffs alone or in combination with WT CD4+CD25high Tregs (in a 1:4 ratio) into ΔRag recipients of BALB/c hearts on day 2 post-transplantation. (E) Kaplan-Meier graft survival curves following the adoptive transfer of DEP/iDEP CD4+CD25high Tregs and WT CD4+CD25- Teffs (in a 1:4 ratio) into ΔRag recipients of BALB/c hearts on
A
uthor Man
uscr
ipt
A
uthor Man
uscr
ipt
A
uthor Man
uscr
ipt
A
uthor Man
uscr
ipt
day 2 post-transplantation. (F and G) DEP/iDEP CD4+CD25high Tregs were transferred into ΔRag mice, and (F) the mean number of CD3+CD4+Foxp3+ cells per spleen ± SD was evaluated by flow cytometry at 3 and 5 weeks post-transfer (n=3, One-way ANOVA). (G) Representative histograms of Foxp3 expression within transferred cells. (H) Kaplan-Meier graft survival curves following the transplantation of fully MHC mismatched BALB/c allografts into DEP/iDEP recipient mice treated with anti-CD154 (CD40L) on days 0 and 2 post-transplantation. (I) Kaplan-Meier graft survival curves of controls and iDEP recipient mice following anti-CD25 treatment peritransplantation. (J) Dotplots of splenic Foxp3+ cells following treatment of recipients with anti-CD25. In (AJ), recipients received either control or dox chow.