HAL Id: hal-00787969
https://hal.archives-ouvertes.fr/hal-00787969
Submitted on 13 Feb 2013
HAL is a multi-disciplinary open access
archive for the deposit and dissemination of
sci-entific research documents, whether they are
pub-lished or not. The documents may come from
teaching and research institutions in France or
abroad, or from public or private research centers.
L’archive ouverte pluridisciplinaire HAL, est
destinée au dépôt et à la diffusion de documents
scientifiques de niveau recherche, publiés ou non,
émanant des établissements d’enseignement et de
recherche français ou étrangers, des laboratoires
publics ou privés.
Analysis of membrane fouling during cross-flow
microfiltration of wine
Youssef El Rayess, Claire Albasi, Patrice Bacchin, Patricia Taillandier,
Martine Mietton-Peuchot, Audrey Devatine
To cite this version:
Youssef El Rayess, Claire Albasi, Patrice Bacchin, Patricia Taillandier, Martine Mietton-Peuchot, et
al.. Analysis of membrane fouling during cross-flow microfiltration of wine. Innovative Food Science
and Emerging Technologies, Elsevier, 2012, vol. 16, pp. 398-408. �10.1016/j.ifset.2012.09.002�.
�hal-00787969�
To link to this article
: DOI:10.1016/j.ifset.2012.09.002
URL :
http://dx.doi.org/10.1016/j.ifset.2012.09.002
This is an author-deposited version published in:
http://oatao.univ-toulouse.fr/
Eprints ID: 8285
To cite this version:
El Rayess, Youssef and Albasi, Claire and Bacchin, Patrice and Taillandier,
Patricia and Mietton-Peuchot, Martine and Devatine, Audrey Analysis of
membrane fouling during cross-flow microfiltration of wine. (2012) Innovative
Food Science and Emerging Technologies, vol. 16 pp. 398-408. ISSN
1466-8564
O
pen
A
rchive
T
oulouse
A
rchive
O
uverte (
OATAO
)
OATAO is an open access repository that collects the work of Toulouse researchers
and makes it freely available over the web where possible.
Any correspondence concerning this service should be sent to the repository
administrator:
staff-oatao@listes.diff.inp-toulouse.fr
!
Analysis of membrane fouling during cross-flow microfiltration of wine
Youssef El Rayess
a,b,⁎
, Claire Albasi
a,b, Patrice Bacchin
c,d, Patricia Taillandier
a,b,
Martine Mietton-Peuchot
e,f, Audrey Devatine
e,faUniversité de Toulouse, INPT, UPS, Laboratoire de Génie Chimique, 4 Allée Emile Monso, F-31432 Toulouse, France
bCNRS, Laboratoire de Génie Chimique, F-31432 Toulouse, France
cUniversité de Toulouse, INPT, UPS, Laboratoire de Génie Chimique, 118 Route de Narbonne, F-31062 Toulouse, France
dCNRS, Laboratoire de Génie Chimique, F-31062 Toulouse cedex 09, France
eUniversité de Bordeaux, ISVV, EA 4577, Unité de recherche OENOLOGIE, 33882 Villenave d'Ornon, France
fINRA, ISVV, USC 1219 OENOLOGIE, 33882 Villenave d'Ornon, France
a b s t r a c t
Keywords: Cross-flow microfiltration Fouling Wine Tannins Pectins MannoproteinsThe aim of this study was to investigate the individual impact on wine molecules as tannins, pectins and mannoproteins on multichannel ceramic membrane fouling during wine cross-flow microfiltration. The char-acterization of fouling mechanisms involved in the previous filtrations was realized by using the classical fouling models and the analysis of the total resistance curves. It was shown that the obtained initial fluxes are dependant of the nature of the studied molecules and their concentration. According to their increasing effect on permeate flux decline, the studied wine components could be ranked as: mannoproteins b tannins b pectins. During the filtration of wine added with tannins, it was found that the filtrations were governed by the cake layer formation mechanism. The presence of pectins caused the formation of gel-type layer which is found to be compressible under high pressures. For wines added with mannoprotein filtrations, it was shown that there is a threshold concentration above which a plateau value of permeate flux is obtained.
Industrial relevance: The cross-flow microfiltration applied to wine filtration has become a legitimate alterna-tive to conventional filtration processes. However, membrane fouling which affects the operating costs and the plant maintenance, limits the widespread application of this technique. To avoid or reduce membrane fouling, it is extremely important to identify the fouling elements and the mechanisms that govern the pro-cess. A better understanding of the mechanisms whereby fouling is formed during wine microfiltration may lead to be in position to control fouling or reduce it, to improve cleaning procedures and to adapt the process to the product to be filtered.
The results presented in this paper concern the investigation and the understanding of fouling mechanisms by wine colloids (tannins, pectins and mannoproteins). We found that wine colloids had a strong impact on membrane fouling. Independently of their concentrations found in wine, they can be ranked according to their increasing effect on permeate flux as: mannoproteins b tannins b pectins. Such result provides impor-tant information and a better vision on the methods which can be used to limit membrane fouling for exam-ple the use of pectinolytic enzymes before filtration in order to hydrolyze pectin chains or precipitation of unstable tannins by finning the wine with bentonite. By elucidating fouling mechanisms such as cake layer and gel type layer, we can adapt the hydrodynamic process to control membrane fouling.
1. Introduction
Clarifying wines using membrane filtration has begun to set up in oenology sector since the mid‐1980s (Poirier, Bennasar, Tarodo de la Fuente, Gillot, and Garcera, 1984). Compared to the conventional clarification processes such as centrifugation, filtration on sheets, di-atomaceous earth filtration, etc., cross-flow microfiltration can bring
the following benefits such as the combination of clarification, mi-crobiological stabilization and sterile filtration in one single continu-ous highly automated operation; and the elimination of the use of diatomaceous earth, thereby, reducing production costs and the problem of waste disposal leading to an improvement in work safety and production (El Rayess, Albasi, Bacchin, Taillandier, Raynal, et al., 2011).
Unfortunately, as in most other applications, the main problem in practical application of cross-flow microfiltration in wine industry is membrane fouling. It manifests by the reduction of permeate flux with time, caused by the wine components. This has caused difficul-ties in obtaining a competitive and economical productivity. ⁎ Corresponding author at: Université de Toulouse, INPT, UPS, Laboratoire de Génie
Chimique, 4 Allée Emile Monso, F-31432 Toulouse, France. Tel.: +33 534323900.
E-mail address:youssef.elrayess@ensiacet.fr(Y. El Rayess).
When filtering a biological fluid as wine and considering its complexity, membrane fouling can be attributed to three different mechanisms: i) concentration polarization and subsequent cake layer formation, ii) adsorption of solutes onto the membrane surface and pore walls, and iii) blockage of pores (Vernhet and Moutounet, 2002; El Rayess, Albasi, Bacchin, Taillandier, Mietton-Peuchot, et al., 2011a). Membrane fouling could also be divided according to its loca-tion relative to the membrane structure:
• Internal fouling is caused by the adsorption and deposition of small particles and macromolecules within the internal structure of the pores;
• External fouling is caused by the deposition of large macromolecules and particles on the top of membrane surface.
Research works concerning wine cross-flow microfiltration highlighted that wine macromolecules such as polyphenols, polysac-charides and proteins as well as wine particles as yeast, bacteria and cell debris are responsible of membrane fouling (Belleville, Brillouet, Tarodo de la Fuente, and Moutounet, 1992; Boissier, Lutin, Moutounet, and Vernhet, 2008; Salazar, de Bruijn, Seminario, Guell, and Lopez, 2007; Vernhet and Moutounet, 2002). Many researchers have demonstrated the negative effect of wine polysaccharides and polyphenols on the permeation flux especially by adsorption of these molecules on membrane materials (Belleville et al., 1992; Ulbricht, Ansorge, Danielzik, Konig, and Schuster, 2009; Vernhet and Moutounet, 2002). A recent study (Ulbricht et al., 2009) had provided evidence that different membrane materials exhibit various levels of adsorption of typical foulants in wine such as polysaccharides and polyphenols. Adsorption of these components is less on hydrophobic membrane than on hydrophilic membrane.
There have been numerous attempts to reduce membrane fouling by mechanical (back-flushing, back-pulsing and cross-flushing) and chemical cleaning. These steps are time consuming and add up me-chanical and chemical stresses to the filtration devices resulting in a loss of capacity and efficiency of the equipment. Also, a main difficulty of wine cross-flow microfiltration is the non-reproducibility of pilot performances. The complexity of wine composition plays a major role and depends on the variability of the grapes and technological operations during the wine elaboration. The molecules/molecules and molecules/membrane interactions make the situation more com-plicated. To avoid or reduce membrane fouling, it is extremely impor-tant to identify the fouling elements and the mechanisms that govern the process. A better understanding of the mechanisms whereby foul-ing is formed durfoul-ing wine microfiltration may lead to be in position to control fouling or reduce it, to improve cleaning procedures and to adapt the process to the product to be filtered.
Nowadays, substances like polysaccharides, polyphenols and large particles are identified to be involved in the fouling process. However, studies to evaluate the contribution of each class of components pres-ent in the wine and the respective involved mechanisms in membrane fouling are still lacking. So, the aim of the present work was to inves-tigate the relative impact of polyphenols (especially tannins) and polysaccharides (pectins and mannoproteins) on multichannel ce-ramic membrane fouling during a red wine cross-flow microfiltration and to identify the fouling mechanisms.
2. Theory
In this section, the clogging phenomena (adsorption, particle cap-ture, deposit formation and biofilms) leading to the deposition of fouling material in/on the membranes are distinguished from the mechanisms limiting the transfer of material which they induce. The filtrations of complex solutions are characterized by the coexis-tence of different mechanisms whose relative contributions depend on the nature of the filter media, operating conditions and fluid char-acteristics. However, modeling the fouling phenomena allows the
representation of fairly simple mechanisms to assist in the thinking of further practices. In fact, modeling is quite accurate to what is ob-served with microscopy techniques. The classical filtration models in microfiltration were originally developed byHermans and Bredee (1936)and reviewed byHermia (1982). Their use has the advantage of a non‐ambiguous interpretation of often complicated fouling phe-nomena. These fouling phenomena limit the filtration of a complex solution like wine which contains molecular and colloidal fractions with large particle size distribution.
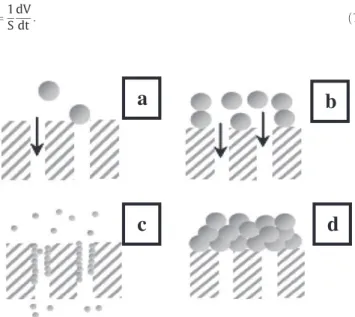
According to these models, four mechanisms are identified to reduce flow rate through the membrane (Fig. 1) (Bowen, Calvo & Hernandez, 1995; Hermia, 1982):
(a) Sealing the pore of the membrane (complete blocking, n = 2): according to this model, each particle, bigger than the pore di-ameter, is retained at the surface of the membrane and completely blocks the entrance of the pores. Moreover, the particles never settle on other particles which have been previ-ously blocked by a pore.
(b) Partial blocking of pores (intermediate blocking, n =1): this model considers that the inner pore walls are covered gradually and uniformly by molecules smaller than the pore size. This de-creases the pore volume proportionally to the filtered volume. Therefore, the cross-section of the pores decreases over time. (c) Internal pore blocking (standard blocking, n =3/2): as well as the
complete blocking model, this model assumes that the molecules block the entrance of the pores. But, it considers also that mole-cules can settle on the others previously retained by the mem-brane. This means that not all molecules approaching the surface of the membrane block a pore entrance.
(d) Formation of a deposit on the membrane surface (cake formation, n = 0): according to this model, a deposit or cake is formed on the membrane surface by the retained molecules which are con-sidered bigger than the pore diameter. Cake thickness increases over time due to the stacking of molecules on the membrane surface.
These models have been developed for dead-end filtration with membranes having identical circular pores (identical pore diameter and length). The parameters considered by these models have a phys-ical meaning and contribute to the comprehension of the mecha-nisms of membrane fouling. The four models are based on the laws only valid for constant pressure filtration and can be described by a common mathematical Eq.(1):
J ¼1 S dV dt: ð1Þ
a
b
d
c
The representation of this equation in logarithmic scale gives di-rectly the value of the obtained slope (n). The exponent n (blocking index) characterizes the filtration mechanism while k (resistance co-efficient) allows the evaluation of the characteristic parameters of the retained model.
All these models and their characteristic and linearized equations are summarized inTable 1.
In the literature, experimental data for the flux decline have been often analyzed using the linearized forms. In most cases, the model which best fits with the experimental data is claimed to depict the fouling phenomena. However, filtration of the complex media is known to be the place of the coexistence of different fouling mecha-nisms. For that, the use of the common Eq.(1)offers the possibility to represent the four models of blocking in a single log–log plot where the log(dt/dV) represents the hydraulic resistance and log(d2t/dV2
) the variation of the resistance with the filtered volume (Grenier, Meireles, Aimar, and Carvin, 2008). This approach was used because several authors (Nandi, Das, Uppaluri, and Purkait, 2009) have shown that the behavior of microfiltration membranes with regard to fouling phenomena cannot be described by a single blocking model all along the filtration. This plotting will help us to de-termine the coexistence of mechanisms during the investigation of the impact of wine molecules.
3. Materials and methods 3.1. Red wine
The red wine used in the present study was elaborated in 2008 at the cooperative cellar of Rabastens (France) with Duras, Fer Servadou and Syrah grape varieties.
In the cellar, the filtration was performed in a cross-flow microfiltration pilot plant using organic membranes with a pore size of 0.2 μm. When received, the wine is analyzed and maintained at 4 °C until experiments, in order to reach tartrate stabilization and to prevent microorganisms' development. Before using the wine for fil-tration experiments, a preliminary filfil-tration is performed using the experimental pilot and membrane described inSection 3.4in order to eliminate the potential potassium tartrate crystals and precipitates. This final step allows obtaining the filtered wine (FW). The character-istics of the filtered wine are the following: 12% as alcohol content, 3.6 as pH, 0.6 g/l as sugars (glucose + fructose), 0.1 g/l as malic acid and 0.1 NTU as turbidity.
3.2. Chemicals
Tannins (Biotan®), used as a model of wine tannins, were purchased from Laffort (Bordeaux, France). These tannins are proanthocyanidic
tannins extracted from grape skin with instantaneous dissolving (mean degree of polymerization DPm≈ 5.5). Pectins from citrus fruit were used as a model for grape polysaccharides. They were purchased from Sigma-Aldrich (Lyon, France). Mannoproteins (Mannostab®) were purchased from Laffort (Bordeaux, France) and used as a model of yeast polysaccharides. The concentrations of added molecules are chosen according to those found in wine and identified in the literature (Flanzy, 1998; Ribéreau-Gayon, Glories, Maujean, and Dubourdieu, 2006).
3.3. Wine analysis
For wine component quantification, spectrophotometric analyses were carried out on an Agilent 8453 UV/VIS spectrophotometer. Total polyphenols in wine were estimated by the total polyphenol index (TPI) using the absorption at 280 nm and under 1 cm optical path. Color intensity (IC) is the sum of optical densities at 420 nm, 520 nm and 620 nm under 1 mm optical path. Total polysaccharides were determined using the modified Usseglio-Tomasset method based on the precipitation of the polysaccharides with ethanol (Usseglio-Tomasset, 1976). Total anthocyanins were determined according to the Ribéreau-Gayon method using the sodium bisulphite (Ribéreau-Gayon et al., 2006). Total tannins were also determined according to the Ribéreau-Gayon method by transforming the proanthocyanidins into anthocyanidins (Ribéreau-Gayon et al., 2006). Tannins were also analyzed using the method of thioacidolysis as described byPreys, Souquet, Meudec, Morel-Salmi, and Cheynier (2004). The measurements were performed with a UHPLC (DIONEX, Ultimate 3000 RSLC) and the used column was a Kinetex® PFP (Phenomenex). pH, alcohol content, malic acid, glucose and fructose concentration were determined on the wine by FTIR spectroscopy (Fourier Transform Infra-Red spectroscopy). Mannoproteins were termined using the total polysaccharide method. Wine viscosity is de-termined with a controlled-stress rheometer (AR-2000 ex). Turbidity measurements (NTU) were performed with a Eutech TN-100 turbi-dimeter (Eutech Instruments, Singapore).
3.4. Experimental apparatus
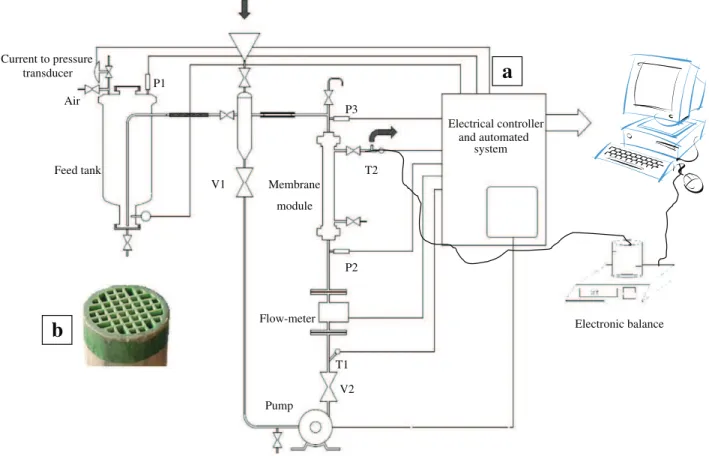
The filtrations were performed with a wine filtration pilot system (Fig. 2a) designed especially for this study and built by “PERA” Company (Florensac, France). A detailed account of the experimental setup was presented elsewhere (El Rayess, Albasi, Bacchin, Taillandier, Mietton-Peuchot, et al., 2011a).
The microfiltration module contains a multi-channel (44) ceramic membrane (BK-Kompact, Novasep, France) shown inFig. 2b with aver-age pore diameter of 0.2 μm. The total active membrane surface was 0.118 m2, with an external diameter of 25 mm. The membrane
consti-tuted of ZrO2/TiO2layers lying on monolithic TiO2–Al2O3support layer.
After each experiment, a 6 step procedure of chemical cleaning is adopted to regenerate the membrane. This procedure was presented in another work (El Rayess, Albasi, Bacchin, Taillandier, Mietton-Peuchot, et al., 2011a). It should be mentioned that the same mem-brane was used throughout all the experiments presented in this paper. The initial permeability of the used membrane is 1050 l/ h.m2.bar (3 × 10⁻⁴m/s.bar). The membrane permeability is checked
with osmotic water after chemical cleaning and must be equal or above 900 l/h.m2.bar (2.5 × 10⁻⁴m/s.bar) (at 20–22 °C). If this
per-meability is not reached, cleaning using several chemicals is then performed to regenerate the membrane and to reach the desired ref-erence permeability of the membrane.
3.5. Microfiltration experiment procedure
Cross-flow microfiltration experiments were realized in order to in-vestigate the respective impact of tannins, pectins and mannoproteins Table 1
The blocking models and their schematic representation.
Model Characteristic equation Linearized form k Complete blocking (n = 2) d2t dV2¼ kc:dVdt ! "2 ln J = ln J0− Kct Kc=KAJ0 Standard blocking (n = 3/2) d2t dV2¼ Ki:dVdt ! "3=2 1 J1=2¼J1=21 0 þ Kst Ks¼ 2KB A0AJ 1=2 0 Intermediate blocking (n = 1) d2t dV2¼ Ks:dVdt ! "1 1 J¼J10þ Kit Ki=KA Cake filtration (n = 0) d2t dV2¼ Kg:dVdt ! "0 1 J2¼J12 0þ Kgt Kg¼ 2 KDRg J0Rm
J0: initial permeate flux (m/s), J: permeate flux (m/s), A0: initial membrane surface
(m2), A: membrane surface blocked at time t (m2), R
m: membrane hydraulic
resistance (m−1), R
g: hydraulic resistance due to the cake formation (m−1), KA:
blocked surface of the membrane per unit of filtered volume that flows through the
membrane (m−1), K
B: cross section blocked surface per unit of total volume that
flows through the membrane (m−1), K
D: cake surface per unit of total volume which
on membrane fouling. The experiments were duplicated in order to check the repeatability of the obtained results. All experiments are re-peatable (±5%) under the same conditions of concentration, trans-membrane pressure, temperature and initial permeability of the membrane. To identify the fouling mechanisms, dead-end filtrations were carried out on the same membrane and in the same pilot as depicted inFig. 2.
3.5.1. Cross-flow filtrations
The experiments consisted of constant TMP microfiltration runs. Each solution is filtered under two different pressures: 0.5 and 1 × 10⁵Pa. The impact of the different added molecules was studied
for two chosen concentrations.Fig. 3summarizes all conducted ex-periments and the imposed conditions.
All experiments were carried out with 10 l of the defined suspen-sion. This volume was chosen in order to keep the volumetric reduc-tion ratio (VRR) lower than 1.6. The solureduc-tion to be filtered is placed in the feed tank and the circulation loop in order to expel the air from the loop. The flow velocity is fixed at 2 m/s which is conventionally used in wine filtration (without damaging the wine), corresponding to the Reynolds number equal to 2306 and 12.1 Pa as wall shear stress. According toRené and Lalande (1991), the value of the Reyn-olds number corresponds to laminar flow regime.
Results of cross-flow filtrations will be presented as permeate flux function of filtered volume and total resistance function of filtered volume. Permeate flux (J) is calculated by Eq.(2).
J ¼1 S
dV
dt ð2Þ
Total resistance (R) is expressed by the following expression: R ¼ΔP
J:μ: ð3Þ
Where V is the filtered volume (m3), t is the time (s), S is the
membrane surface (m2), ΔP is the transmembrane pressure (Pa)
and μ is the wine viscosity (Pa.s). 3.5.2. Dead-end filtrations
To run in dead-end mode with this pilot, the pump was stopped and the valves V1and V2were closed. The circulation of the wine in
the pilot is only provided by the pressurized air. Experiments were performed with 10 l of solution. The tested solutions and transmem-brane pressures in dead-end mode are summarized inFig. 4.
Results of dead-end filtrations will be firstly presented using the linearized forms detailed inTable 1. Then, they will be presented using the common mathematical equation.
4. Results and discussion 4.1. Effect of added tannins
4.1.1. Impact on cross-flow filtration performances
Fig. 5shows the experimental data for the permeate flux as a function of filtered volume for filtered wines (FW) added with dif-ferent concentrations of tannins (1.25 g/l and 2.5 g/l) filtered at 2 different transmembrane pressures (ΔP): 0.5 and 1 × 10⁵Pa. This
figure shows also the permeate flux curves during the filtration of FW.
While filtering FW, the average permeate flux at 1 bar is about 1.8 × 10− 4m/s while it is about 0.83 × 10− 4m/s at 0.5 × 10⁵Pa. A
lit-tle decrease in permeate flux is observed for both tested pressures. These results indicate that a weak fouling occurred even during the filtration of filtered wine. This fouling is mainly due to the adsorption of wine compounds on membrane material because the filtered wine doesn't contain particles or large macromolecules susceptible to form a deposit on membrane surface. This was checked by measuring the initial turbidity which was equal to 0.1 NTU. To highlight the
Current to pressure transducer Feed tank Pump Flow-meter T1 T2 V1 V2 P1 P2 P3 Electrical controller and automated system Electronic balance Membrane module Air
b
a
adsorption mechanism, the membrane was immersed in FW for 24 h and the water permeability was checked before and after immersion. A decrease about 10% of membrane permeability was measured. The
adsorption mechanism was also proposed byVernhet, Cartalade, and Moutounet (2003)to explain membrane fouling during filtration of the permeate of a red wine. For the following result analysis, this Fig. 3. A summary of cross-flow microfiltration experiments.
10% variation due to adsorption will be considered in the error range of the flux measurements. Moreover this value has been obtained after 24 h of wine membrane contact while all the following experi-ments didn't last more than 80 min.
During the filtration of wines added with tannins, it can be seen that the lower permeate flux (1.9×10⁻⁵m/s) was obtained with
wines containing 2.5 g/l tannins. The impact of tannin concentration is noticeable while observing flux decreases. For the same pressure, wines containing 1.25 g/l tannins present higher fluxes than those containing 2.5 g/l tannins. The same behavior is reported byCzekaj, Lopez, and Guell (2000) who showed while filtering two white wines having the same initial turbidity that the different polyphenol concentrations of the 2 wines may explain the different performances observed during filtration.
It may also be observed that the permeate fluxes of wines loaded with tannins seem to stabilize around 2 × 10− 5m/s whatever the
fil-tration conditions (pressure or concenfil-tration). This fact could be explained by the stabilization of the permeate flux by the cross-flow velocity independently of the transmembrane pressure.
Total resistance values calculated by Eq.(3)are plotted inFig. 6as total resistance versus filtrate volume. The total resistance, whatever the filtration conditions, increases during time; with a gradual decrease observed in slope during filtrations of FW+2.5 g/l tannins at 0.5 and 1 × 10⁵Pa and FW+1.25 g/l tannins at 0.5× 10⁵Pa. According to Tracey and Davis (1994), an external fouling (pore blocking or cake
formation) is represented by a curve with a decreasing slope and quasi‐steady state of the resistance. Regarding more precisely the curves of FW+2.5 g/l tannins, the external fouling is the dominant fouling mechanism. The filtration of wine containing 1.25 g/l tannins at 0.5× 10⁵
Pa presents the same mechanism. But the filtration of the same solution, FW+1.25 g/l tannins, at 1 × 10⁵Pa suggests a shift
from one mechanism to another and doesn't reach a quasi-steady state of the resistance.
The contribution of tannin concentration and the pressure ΔP can be evaluated while plotting the total resistance versus filtered volume: at a given ΔP, an increase in tannin concentration led to a higher resistance while at the same concentration of tannins, the pressure impact is greater as the concentration is high. This observation may be explained by the in-crease of collision probabilities between tannin molecules forming bigger molecules, as the convective flux increased with pressure as far as the concentration increases. In fact, tannins have colloidal behaviors in wines and are unstable in wines which explain the changeable properties of tannins (Poncet-Legrand, Cartalade, Putaux, Cheynier, and Vernhet, 2003; Ribéreau-Gayon et al., 2006). During filtration, when increasing the ΔP, a gradient of the tannin volume fraction may appear from the sus-pension bulk to the surface of the membrane, which can cause tannin ag-gregation and eventually pore blocking and cake filtration in the neighbor of the membrane.
4.1.2. Fouling mechanisms
The identification of fouling mechanisms by wine tannins is realized by dead-end filtrations performed on the same multichannel ceramic membrane as the one used in the previous cross-flow filtrations. The decrease of permeate flux over time has been analyzed using the differ-ent filtration laws as discussed inSection 2. In the next paragraph, the linearized forms of blocking models are used. The results are investigat-ed by plotting the common mathematical form (Eq.(1)) to check if the coexistence of mechanisms also exists during filtration of wine colloids. 4.1.2.1. Mechanism identification by linearized forms. To identify the most appropriate of blocking models to describe the decrease in per-meate flux of FW+tannin filtration, the correlation coefficients (r2) of different models are compared (Table 2). To confirm the model fitting, correlation coefficient (r2) values should be greater than
0.99. As cake filtration model provided the highest values of r2
(>0.99), this model was identified as the best fitted model to repre-sent the flux decline mechanism for FW added with tannins indepen-dently from the transmembrane pressure and tannin concentration. Other models present r2values below 0.99. Therefore the resistance
coefficient Kghas also been reported for this model. We can observe
an increase in the resistance coefficient with the concentration, which is as expected. But, for a given concentration, the resistance coefficient decreases when the pressure increases, this implies that tannins form a non-compressible deposit on the surface of the membrane.
0.0E+00 5.0E-05 1.0E-04 1.5E-04 2.0E-04 0 0.001 0.002 0.003 0.004 J (m/s)
FW + 1.25 g/l tannins FW + 1.25 g/l tannins FW + 2.5 g/l tannins
FW + 2.5 g/l tannins FW FW
V (m3)
Fig. 5. Permeate flux profiles of FW wines loaded with different concentrations of
tan-nins (—: 0.5×10⁵Pa; ‐‐‐: 1×10⁵Pa).
0.0E+00 1.0E+12 2.0E+12 3.0E+12 4.0E+12 0 0.001 0.002 0.003 0.004 Rt (m -1) V (m3)
FW + 1.25 g/l tannins FW + 1.25 g/l tannins FW + 2.5 g/l tannins
FW + 2.5 g/l tannins FW FW
Fig. 6. Effect of tannin concentration and transmembrane pressure on total resistance
(—: 0.5×10⁵Pa; ‐‐‐: 1×10⁵Pa).
Table 2
Summary of parameters associated to various blocking models for FW added with tannins. Complete pore blocking Intermediate pore blocking Standard pore blocking Cake filtration r2 r2 r2 r2 K g(s/m2) FW + 1.25 g/l tannins (0.5 ×10⁵Pa) 0.9377 0.9769 0.9598 0.9959 1.85× 10⁶ FW + 1.25 g/l tannins (1× 10⁵Pa) 0.9311 0.9805 0.9598 0.9981 1.00× 10⁶ FW + 2.5 g/l tannins (0.5 ×10⁵Pa) 0.9168 0.9795 0.9537 0.9999 5.10× 10⁶ FW + 2.5 g/l tannins (1× 10⁵Pa) 0.9762 0.9731 0.9339 0.9999 3.95× 10⁶
4.1.2.2. Mechanism identification by d2t/dV2. As mentioned before,
the obtained results with linearized forms will be checked by plotting the common mathematical equation for blocking models (Eq.(1)) (Fig. 7). The results show that only cake filtration (n=0) occurs during filtrations of FW added with 1.25 g/l tannins regardless of the transmembrane pressure. The obtained results are consistent with those obtained with the cross-flow filtrations. Both modes, cross-flow and dead-end, showed that a deposit on the membrane is formed as well as the same amount of fouling is detectable (in terms of resistance in cross-flow mode, and in terms of log(d2t/
dV2) for dead-end mode). In fact, as explained before, the log(d2t/
dV2)(d2t
dV2¼dVd Q1
# $
withQ ¼ΔPS
μR) represents the variation of the
hy-draulic resistance with the filtered volume. When comparing the log(d2t/dV2) and the total hydraulic resistance for both tested
trans-membrane pressure, the two filtrations present the same evolution and almost the same amount of total resistance as well as the same evolution and amount of log(d2t/dV2).
In the case of FW added with 2.5 g/l tannins, the value of the blocking index (n) varies over time. At 0.5 bar, the first recorded value of the blocking index (n = 0.5) means that there is a transition between two models: intermediate pore blocking and cake filtration. The transition leads to cake filtration model (n=0). At 1× 10⁵Pa, the beginning of the filtration shows a blocking index equal to 1 charac-teristic of the intermediate pore blocking. This latter is followed by a transition (n = 0.5) to the cake filtration model (n=0). The end of the filtration is characterized by a negative blocking index. In our case and asIritani, Mukai, Tanaka, and Murase (1995)have shown in their study, the negative slope contradicts the theory.
It should be noted that the membrane has a non-homogeneous pore size distribution. Thus, fouling does not occur in the same way and at the same rate on every pore. These distributions may partly ex-plain why there is no clear separation between fouling models.
It was surprising to find that tannins could form a deposit during microfiltration because these molecules (DPm≈ 5.5) have a size range below the membrane cut-off (0.2 μm). Tannins are unstable molecules and their physical–chemistry aspect behavior is not well known yet. Several authors have shown that tannins can self-associate and eventu-ally aggregate to form colloidal particles (Poncet-Legrand et al., 2003; Riou, Vernhet, Doco, and Moutounet, 2002). So, the cake formation by tannin molecules could be induced by the convective flux. This latter can enhance the physical–chemical interactions between tannin mole-cules leading to aggregation phenomena. According to our observa-tions, the most plausible mechanism is a fast interaction between
tannins and the membrane (adsorption), quickly followed by tannin– tannin interactions leading to aggregates that could block the pores and then form a deposit at the membrane surface.
4.2. Effect of added polysaccharides
The impact of wine polysaccharides on filtration performances was studied by testing two categories of polysaccharides. The first category includes pectin which comes from grape berries. The second category is formed by mannoproteins whose presence in wine is due to the release from yeast cell wall.
4.2.1. Pectins impact on cross-flow filtration performances
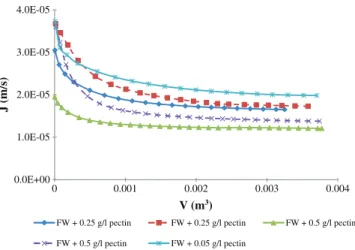
Fig. 8 shows the experimental data of the permeate fluxes as a function of filtered volume during constant ΔP (0.5 and 1 × 10⁵Pa)
cross-flow microfiltration for wines containing pectins at different concentrations (0.25 and 0.5 g/l). Transmembrane pressure seems to only affect the initial permeate flux. At the end of the filtrations, no real differences have been noticed in terms of permeate flux for wines containing 0.25 and 0.5 g/l pectins when increasing the trans-membrane pressure. Results showed a severe fouling comparing to filtrations with FW alone. The presence of pectins had a noticeable in-fluence even from the first seconds of filtration independently of pec-tin concentration. This assumption was confirmed by a last trial with the pectin concentration divided by 5 (0.05 g/l) compared to the ini-tial lowest tested concentration (0.25 g/l). At 0.5 bar, mean permeate flux observed for wines containing pectins ranges between 75% (FW + 0.05 g/l pectin) and 85% (FW + 0.5 g/l pectin) lower than the mean permeate flux of the FW.
The total resistance (Fig. 9) of all wines added with pectins in-creases during filtration. As for wines containing tannins, a gradual decrease in slope is observed which means that an external fouling is taking place. The total resistance behavior for all filtrations doesn't contain any point of inflection or concavity upwards. So, the mecha-nism proposed to explain membrane fouling appears to be an imme-diate fouling of the pores and a growing pectin layer onto membrane surface. This mechanism seems to be in accordance with several other works dealing with pectins but not specific to wine (Jiraratananon, Uttapap, and Tangamornusksun, 1997; Rai, Majumdar, Dasgupta, and De, 2005; Riedl, Girard, and Lencki, 1998). The experimental data clearly show that the total resistance increases with an increase in pectin concentration and transmembrane pressure. Total resis-tance is quickly stabilized and reached the quasi-steady state for a fil-tered volume of 0.0015 m3, regardless of the operating conditions
and the type of filtered solution. At 1 ×10⁵Pa, wine containing
0.5 g/l pectins reached a total resistance 10 times higher than that
1.E+07 1.E+08 1.E+09 1.E+05 1.E+06 Log(d²t/dV²) (s/m 6) log (dt/dV) (s/m3) n=0 n=0 n=0 n=0 FW + 1.25 g/l tannins (0.5 x 10⁵ Pa) FW + 1.25 g/l tannins (1 x 10⁵ Pa) FW + 2.5 g/l tannins (1 x 10⁵Pa) FW + 2.5 g/l tannins (0.5 x 10⁵Pa)
Fig. 7. A plot of d2t/dV2vs. dt/dV curves for wine added with tannins.
0.0E+00 1.0E-05 2.0E-05 3.0E-05 4.0E-05 0 0.001 0.002 0.003 0.004 J (m/s) V (m3)
FW + 0.25 g/l pectin FW + 0.25 g/l pectin FW + 0.5 g/l pectin
FW + 0.5 g/l pectin FW + 0.05 g/l pectin
Fig. 8. Permeate flux versus permeate volume data obtained during cross-flow
obtained with FW at the same pressure. The effect of transmembrane pressure is clearer when plotting the total resistance more than the representation of permeate flux. For wines containing 0.25 and 0.5 g/l pectins, an increase in ΔP from 0.5 to 1 × 10⁵Pa doubled
ap-proximately the total resistance. At high ΔP, the rate of deposition of pectins would be high leading to a thick deposit and gelification. The high pressure may also compress the deposit into a denser foul-ing layer as shown also by El Rayess, Albasi, Bacchin, Taillandier, Mietton-Peuchot, et al. (2011a).
4.2.2. Mannoprotein impact on cross-flow filtration performances Mannoproteins are polysaccharides originating from the yeast cell wall. Among wine polysaccharides, it was shown that mannoproteins play crucial roles in membrane fouling during wine filtration (Vernhet, Pellerin, Belleville, Planque, and Moutounet, 1999). In our following filtration experiments, the aim was to describe the behavior of FW + mannoprotein solutions on a ceramic membrane with a mean cut-off of 0.2 μm. For the first time, the behavior of mannoproteins was investigated using wines added with mannoproteins at concen-trations of 0.1 and 0.2 g/l at 0.5 bar (range of concenconcen-trations found in wine). The results presented inFig. 10indicate a significant effect of mannoproteins on the permeate flux. However, the two tested
concentrations exhibited approximately the same permeate flux. So, there were no differences between the two tested concentrations in terms of permeate flux and even in total resistance (Fig. 11). This observation led us to suggest that there is a mannoprotein effect inde-pendently of its concentration. In order to confirm this suggestion, a wine containing 0.02 g/l mannoproteins was filtered at the same pres-sure. This wine exhibited permeate fluxes two times higher than those obtained with 0.2 g/l mannoproteins. This result shadowed our previ-ous suggestion and the filtrations of wines added with mannoproteins are well mannoprotein concentration dependant. It also seems that there is a limit concentration above which a plateau value of permeate flux is obtained. Further experiments are needed to determine accurately this limit concentration which seems to be lower than 100 mg/l in our case.
The transmembrane pressure effect (0.5 and 1 × 10⁵Pa) was only
tested on wines containing 0.2 g/l mannoproteins. As it can be seen onFig. 10, an increase in ΔP (1 × 10⁵Pa) enabled an increase in initial
permeate flux. On the other hand, a rapid decrease in fluxes is observed and values at the end of the filtration are lower than those obtained at 0.5 × 10⁵Pa.
When plotting the total resistance versus filtered volume, wines containing 0.02 g/l mannoproteins exhibited lower total resistance for ΔP = 0.5 × 10⁵Pa while 0.1 and 0.2 g/l have similar total
resis-tance evolution at the same pressure. When increasing ΔP to 0.5 and 1 × 10⁵
Pa, the curve seems to have an inflection point around 0.0015 m3. This latter means that there is a transition between a
con-cave up curve involving a pore constriction mechanism and a concon-cave down implying a cake layer formation (Tracey and Davis, 1994). 4.2.3. Fouling mechanisms
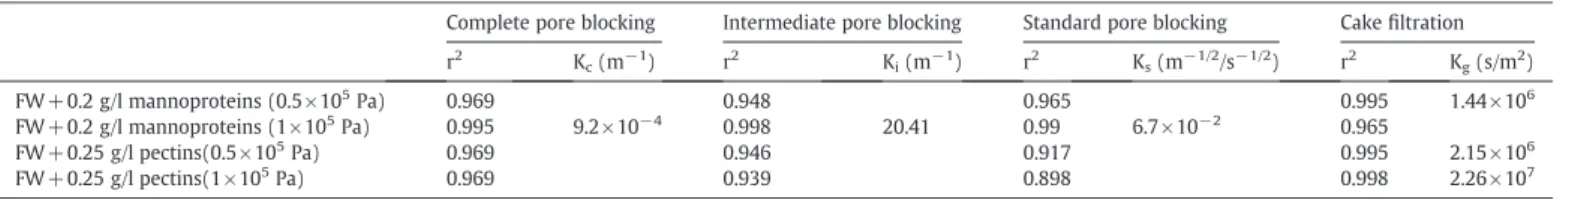
The fouling mechanisms during filtration of wines loaded with poly-saccharides have been studied for the following solutions: FW+ 0.2 g/l mannoproteins and FW+0.25 g/l pectins at 0.5 and 1 × 10⁵Pa.
4.2.3.1. Mechanism identification by linearized forms. The obtained R2
of the linearized forms for the different blocking models obtained during filtration of these solutions are shown inTable 3. The cake fil-tration model can be applied to the following filfil-trations: FW+0.2 g/l mannoproteins (0.5 × 10⁵Pa), FW + 0.25 g/l pectins (0.5 × 10⁵Pa)
and FW + 0.25 g/l pectins (1 × 10⁵
Pa). The resistance coefficient (Kg) of FW + 0.25 g/l pectins increased by 10 times fold when
dou-bling the transmembrane pressure. This means that the cake formed by pectins is a compressible deposit which may explain the lower permeate flux obtained with wines added by pectins.
On the other hand, the succession of three blocking models (complete pore blocking (r2= 0.9954), intermediate pore blocking
(r2= 0.9982) and standard pore blocking (r2= 0.9905)) may 0.0E+00 1.0E+12 2.0E+12 3.0E+12 4.0E+12 5.0E+12 0 0.001 0.002 0.003 0.004
FW + 0.25 g/l pectin FW + 0.25 g/l pectin FW + 0.5 g/l pectin
FW + 0.5 g/l pectin FW + 0.05 g/l pectin FW
V (m3) Rt
(m
-1)
Fig. 9. Total hydraulic resistance during wine filtrations containing pectins at different concentrations (0.05, 0.25 and 0.5 g/l) and transmembrane pressures (0.5 and
1 × 10⁵Pa) (—: 0.5×10⁵Pa; ‐‐‐: 1×10⁵Pa).
0.0E+00 2.0E-05 4.0E-05 6.0E-05 8.0E-05 1.0E-04 0 0.001 0.002 0.003 0.004 J (m/s) V (m3) FW + 0.1 g/l mannoprotein FW + 0.2 g/l mannoprotein FW + 0.2 g/l mannoprotein FW + 0.02 g/l mannoprotein
Fig. 10. Permeate fluxes versus permeate volume during wine filtration added with
mannoproteins (—: 0.5×10⁵Pa; ‐‐‐: 1×10⁵Pa).
0.0E+00 5.0E+11 1.0E+12 1.5E+12 2.0E+12 2.5E+12 3.0E+12 0 0.001 0.002 0.003 0.004 Rt (m -1) V (m3) FW FW + 0.1 g/l mannoprotein FW + 0.2 g/l mannoprotein FW + 0.2 g/l mannoprotein FW + 0.02 g/l mannoprotein
Fig. 11. Total resistance versus permeate volume during wine filtration added with
illustrated the fouling mechanisms for the FW + 0.2 g/l mannoprotein (1 bar) solution.
4.2.3.2. Mechanism identification by d2t/dV2. In order to investigate the
coexistence of fouling mechanisms, d2t/dV2vs. dt/dV curves for FW
added with polysaccharides are presented onFig. 12. Results show that only the cake filtration model (n=0) is representative of the foul-ing mechanisms durfoul-ing filtration of wines added with pectins. These re-sults confirm those obtained with the linearized form. Cross-flow filtration of the same solutions reported also cake layer formation. In fact, the amount of fouling (in terms of total resistance in cross-flow mode, and in terms of log(d2t/dV2) in dead-end mode) is higher
when filtering at pressure 1×10⁵Pa than 0.5 × 10⁵Pa. For both studied
pressures, it is noticed that the amount of fouling is proportional to the applied pressure in cross-flow mode, while in dead-end, an amount of fouling 10-times higher is observed when increasing the pressure. This latter observation may be due to a compressible deposit formed by the pectins and to a bigger rate of deposition at 1 × 10⁵Pa.
In the literature, the cake filtration mechanism is well identified dur-ing the filtration of fruit juices loaded with pectins and polysaccharides (Nandi, Das, Uppaluri, and Purkait, 2011; Rai, Majumdar, Dasgupta, and De, 2006). It was described by the formation of a gel-type layer on the membrane surface adding a supplemental hydraulic resistance (Kirk, Montgomery, and Kortekaas, 1983; Vladisavljevic, Vukosavljevic, and Bukvic, 2003). The pectins used in this study (citrus pectins, Sigma, P9135) have an esterification degree of 60.9% therefore it belongs to the highly methylated pectins (Sato, Oliveira, and Cunha, 2008). This latter can form a gel in acidic medium (pH b3.8) through hydrogen bonds and hydrophobic interactions. The formation of this gel-type layer is enhanced by the process especially by increasing the transmem-brane pressure and thus the convective flux (Rai et al., 2006).
Fig. 12 also illustrates the results obtained during filtration of wines added with 0.2 g/l mannoproteins. Results reveal that only
the cake filtration mechanism (n=0) is present at 0.5 bar while sev-eral mechanisms manifest at 1 bar. The first mechanism presents a blocking index higher than 2 (n = 3.8) which is not identified in the literature but would suggest that a small amount of molecules block some pores. Then, the complete blocking (n = 2) model is identified followed by the intermediate blocking model corresponding to mole-cules beginning to settle on other retained molemole-cules. The end of the filtration seems to be governed by cake layer formation. These results are consistent with those obtained from the linearized forms. They can also explain the unusual shape of the total resistance curve obtained from the filtration of the same solution in cross-flow mode (Fig. 11). In cross-flow filtration of the same solution, an inflection point in the total resistance curve was observed and reported as a transition between several fouling mechanisms. These mechanisms have been identified by the analysis of fouling in dead-end mode: complete blocking and intermediate blocking mechanism and cake layer formation. A transition in blocking mechanisms was also ob-served byYe, Le Clech, Chen, Fane, and Jefferson (2005)during filtra-tion of model solufiltra-tion of extracellular polymeric substances (EPS). They showed that the beginning of the filtration was governed by the standard blocking mechanism followed by a cake layer formation. 4.3. Analysis of the initial fluxes
In this section, the initial fluxes (Table 4) obtained during all conducted filtrations will be discussed. In fact, experiments performed with FW at 0.5 × 10⁵Pa should record an initial flux around 0.8 × 10− 4m/s and 1.8 × 10− 4m/s for those conducted at
1 × 10⁵
Pa. This is not the case for all filtrations where the initial flux value is a function of the type of added molecules, the associat-ed concentrations and the appliassociat-ed pressure. It must be mentionassociat-ed that a maximum of 10% difference of membrane water permeabili-ty is tolerated after chemical cleaning. So, the membrane has al-most the same permeability at the beginning of each filtration.
For wines added with tannins as well as those added with mannoproteins, initial fluxes (regardless of the applied pressure) seem to be concentration dependent. For example, the initial fluxes of FW +1.25 g/l tannins fit well with expectations while those obtained with 2.5 g/l tannins are divided by half, sign of a very quick fouling. The initial fluxes recorded with 0.1 g/l and 0.2 g/l mannoproteins are below those obtained with FW. At 0.02 g/l mannoproteins, the initial flux (8.2×10⁻⁵m/s) matches well with the expected one. These
obser-vations are in accordance with the flux evolution, for which an influence of the concentration, probably based on physical–chemical consider-ations has been pointed out.
The effect of pectins is noticeable from the very first seconds of filtra-tion. Any of the 5 experiments conducted in the presence of pectins showed the expected initial fluxes whatever the used concentration. The initial flux was improved when adding enzymes but still did not reach the desired value of FW. The strong affinity of pectins with mem-brane is here confirmed.
In conclusion, although the initial fluxes are closely related to the state of the membrane, it is obvious and surprising that the nature of filtered molecules and their concentration had an immediate effect on these fluxes during wine filtration.
Table 3
Summary of parameters associated to various blocking models for FW added with polysaccharides.
Complete pore blocking Intermediate pore blocking Standard pore blocking Cake filtration
r2 K c(m−1) r2 Ki(m−1) r2 Ks(m−1/2/s−1/2) r2 Kg(s/m2) FW + 0.2 g/l mannoproteins (0.5 ×10⁵Pa) 0.969 0.948 0.965 0.995 1.44 × 10⁶ FW + 0.2 g/l mannoproteins (1× 10⁵Pa) 0.995 9.2 × 10⁻⁴ 0.998 20.41 0.99 6.7 ×10⁻² 0.965 FW + 0.25 g/l pectins(0.5 × 10⁵Pa) 0.969 0.946 0.917 0.995 2.15 × 10⁶ FW + 0.25 g/l pectins(1 × 10⁵Pa) 0.969 0.939 0.898 0.998 2.26 × 10⁷ 1.E+07 1.E+08 1.E+09 1.E+10
1.E+05 1.E+06 1.E+07
n = 0 n = 0 n = 0 n = 0.2 FW + 0.2 g/l mannoproteins (0.5 x 10⁵Pa) FW + 0.25 g/l pectins (0.5 x 10⁵ Pa) FW + 0.2 g/l mannoproteins (1 x 10⁵Pa) FW + 0.25 g/l pectins (1 x 10⁵ Pa) log (dt/dV) (s/m3) Log(d²t/dV²) (s/m 6)
Fig. 12. d2t/dV2vs. dt/dV curves for FW added with polysaccharides (0.2 g/l mannoproteins
4.4. Influence of cross-flow microfiltration on chemical composition of wines
Analytical measurements carried out on samples from feed and permeate of the cross-flow microfiltration of wines are reported in
Table 5. The wine characteristics as pH, % of ethanol, total acidity and total anthocyanin were affected neither by the added compounds nor by the process. These parameters were 3.6, 12.07%, 2.48 g/l H2SO4
and 350–360 mg/l, respectively. The value of total acidity is low be-cause the wines undergo malolactic fermentation and tartaric acid stabilization.
Regardless of the initial turbidity of the wine, the permeate turbid-ity is always inferior to 1.5 NTU. This means that cross-flow microfiltration fulfilled its mission and had lowered wine turbidity less than 2 NTU.
When adding tannins to the wines, an increase in turbidity, color intensity (IC), total polyphenol index (TPI) and total tannins is ob-served depending on the added concentration. For wines containing 1.25 or 2.5 g/l tannins, a decrease of 3.2–5% or 7.5% in IC, 3.4–6.2% or 5.6–6.2% in TPI and 7.4–8.6% or 5.6–7.6% in total tannins is ob-served after filtration. So, no significant differences in terms of quality loss are observed between both tested concentrations.
According to Arriagada-Carrazana, Saez-Navarrete, and Brodeu (2005), the reduction observed in TPI, IC and the decrease in the con-centration of tannins can be explained by the adsorptive phenome-non of tannins on membrane material. The adsorptive phenomephenome-non was also highlighted byVernhet and Moutounet (2002)andUlbricht et al. (2009). However, interactions between macromolecules induced by hydrodynamic conditions must be taken into consideration. These interactions lead to macromolecular aggregation at pore entrance or membrane surface.
Concerning wines containing pectins, no changes were observed to IC, TPI and total tannins. Logically, an increase in total polysaccharides
has been observed depending on the added concentration. Permeates were impoverished in polysaccharide concentration due to the reten-tion of pectins by the membrane and formareten-tion of a gel layer. This de-crease is about 33–35% for wines supplemented with 0.25 g/l pectins and 34–42% for those added with 0.5 g/l pectins. Enzyme treated wines showed lower initial concentration (about 20–22%) in total poly-saccharides. Concentration of total polysaccharides in permeates of wines treated with enzyme decreased by about 32%. This latter percent-age is the same for permeates of wines supplemented with 0.2 g/l mannoproteins.
Supplemented wines with mannoproteins as wines containing pectins showed no changes to IC, TPI and total tannins. A decrease in total polysaccharides is observed after filtration. It is about 16% for wines containing 0.1 g/l mannoproteins and 32–33% for wines containing 0.2 g/l mannoproteins.
5. Conclusion
In this study, the tested wine constituents: tannins, pectins and mannoproteins induced permeate flux declines but with different im-pacts on membrane fouling. Filtered wine (FW) induced a little loss of membrane permeability, due to the adsorption of wine molecules on membrane material. Wine colloids had a strong impact on membrane fouling. Independently of their concentrations found in wine, they can be ranked according to their increasing effect on permeate flux as: mannoproteins b tannins b pectins.
Quick adsorption followed by pore blocking and/or aggregation and ending by a cake formation is the most plausible mechanism to explain fouling by wine tannins. The strong impact of pectins is due to the formation of the gel layer at the membrane surface. The coex-istence of different fouling mechanisms was highlighted with wines containing mannoproteins but the ends of the filtrations are governed by the cake layer filtration mechanisms.
Table 4
Summary of the initial fluxes obtained with different filtrations (n.d. = not determined).
FW Initial flux (10−5m/s)
FW + 1.25 g/l tannins FW +2.5 g/l tannins FW + 0.1 g/l mannoproteins FW + 0.2 g/l mannoproteins FW +0.02 g/l mannoproteins
0.5 ×10⁵Pa 8 7.62 3.22 5.59 5.48 8.2
1 ×10⁵Pa 18 18 6.65 n.d. 8.19 n.d.
Initial flux (10−5m/s)
FW +0.25 g/l pectins FW +0.5 g/l pectins FW + 0.05 g/l pectins
0.5 ×10⁵Pa 3.73 1.95 3.7
1 ×10⁵Pa 3.67 3.6 n.d.
Table 5
Analytical composition of different wines before and after filtration.
Turbidity (NTU) (±0.2) IC (±0.07) IPT (±0.5) Tannins (g/l) (±0.12) Polysaccharides
(mg/l) (±30)
Feed Permeate %
removal
Feed Permeate Feed Permeate Feed Permeate % removal Feed Permeate % removal FW Tannins 1.25 g/l 0.5 ×10⁵ Pa 0.1 0.1 0 0.85 0.84 44.5 44.2 2.45 2.43 0.8 60 54 10 38.7 0.9 98 0.93 0.9 58.5 56.5 3.48 3.22 7.5 70 55 21 0.5 ×10⁵Pa 39.2 1.1 97 0.94 0.89 59.3 55.6 3.45 3.15 8.7 50 60 0 1.25 g/l 0.5 ×10⁵ Pa 73.2 1.2 98 1.01 0.93 72.1 67.7 4.55 4.28 6 72 63 12.5 1 × 10⁵ Pa 71.3 1.5 98 1.02 0.94 72.4 68.3 4.6 4.25 7.5 80 59 26 0.25 g/l 0.5 ×10⁵ Pa 12.2 0.7 94 0.86 0.84 44.5 43.7 2.45 2.4 2 315 205 35 0.5 ×10⁵Pa 12.8 0.6 95 0.87 0.85 46.3 44.2 2.48 2.42 2.5 305 205 33 Pectins 0.5 g/l 0.5 ×10⁵ Pa 22.3 0.5 98 0.87 0.85 46.8 43.8 2.52 2.4 5 535 350 34.5 1 × 10⁵ Pa 21.4 1.1 95 0.87 0.84 46.5 43.9 2.53 2.41 4.7 550 320 42 0.25 g/l+enz. 1 × 10⁵ Pa 19.6 1.02 95 0.86 0.84 46.2 45.2 2.6 2.45 5.7 210 150 28.5 Mannoproteins 0.1 g/l 0.5 ×10⁵ Pa 3.2 0.28 97 0.85 0.85 45.8 45.2 2.38 2.36 0.8 190 160 16 0.2 g/l 0.5 ×10⁵ Pa 6.22 0.68 89 0.85 0.84 44.7 44.8 2.4 2.39 0.4 315 215 32 1 × 10⁵ Pa 6.8 1.2 82 0.86 0.84 45.3 44.9 2.38 2.35 1.3 285 190 33
The analytical measurement showed that cross-flow microfiltration may induce a loss till 8% in total tannins, 6% in TPI and 35% in total poly-saccharides. The loss in total polysaccharides may affect the quality of wine but more studies with real wines are needed to assess this point. No relationship was found between the initial turbidity and filtra-tion performances. So, new parameter or index is necessary to predict filtration performances of wines.
Nomenclature
d2t/dV2 variation of the hydraulic resistance with the filtered volume
n blocking index
Kc resistance coefficient of complete pore blocking model (m−1)
Ks resistance coefficient of standard pore blocking model
(m− 1/2/s− 1/2)
Ki resistance coefficient of intermediate pore blocking model
(m−1)
Kg resistance coefficient of cake filtration model (s/m2)
KA blocked surface of the membrane per unit of filtered
vol-ume that flow through the membrane (m− 1)
KB cross section blocked surface per unit of total volume that
flow through the membrane (m− 1)
KD cake surface per unit of total volume which flow through
the membrane (m− 1)
Rg hydraulic resistance due to the cake formation (m− 1)
Rm membrane hydraulic resistance (m− 1)
A membrane surface blocked at time t (m2)
A0 initial membrane surface (m2)
J0 the initial permeate flux (m/s)
J permeate flux (m/s) V filtered volume (m3)
t time (s)
S membrane surface (m2)
ΔP transmembrane pressure (Pa) μ wine viscosity (Pa.s)
Rt total hydraulic resistance (m− 1)
Acknowledgments
The authors gratefully acknowledge “PERA” company and Centre National de Recherche Scientifique (CNRS) for their financial support. References
Arriagada-Carrazana, J. P., Saez-Navarrete, C., & Brodeu, E. (2005). Membrane filtration effects on aromatic and phenolic quality of Cabernet Sauvignon wines. Journal of Food Engineering, 68(3), 363–368.
Belleville, M. P., Brillouet, J. M., Tarodo de la Fuente, B., & Moutounet, M. (1992). Fouling colloids during microporous alumina membrane filtration of wine. Journal of Food Science, 57(2), 396–400.
Boissier, B., Lutin, F., Moutounet, M., & Vernhet, A. (2008). Particles deposition during the cross-flow microfiltration of red wines—Incidence of the hydrodynamic condi-tions and of the yeast to fines ratio. Chemical Engineering and Processing: Process Intensification, 47(3), 276–286.
Bowen, W. R., Calvo, J. I., & Hernandez, A. (1995). Steps of membrane blocking in flux decline during protein microfiltration. Journal of Membrane Science, 101(1–2), 153–165.
Czekaj, P., Lopez, F., & Guell, C. (2000). Membrane fouling during microfiltration of fermented beverages. Journal of Membrane Science, 166(2), 199–212.
El Rayess, Y., Albasi, C., Bacchin, P., Taillandier, P., Mietton-Peuchot, M., & Devatine, A. (2011). Cross-flow microfiltration of wine: Effect of colloids on critical fouling con-ditions. Journal of Membrane Science, 385–386(1), 177–186.
El Rayess, Y., Albasi, C., Bacchin, P., Taillandier, P., Raynal, J., Mietton-Peuchot, M., & Devatine, A. (2011). Cross-flow microfiltration applied to oenology: A review. Journal of Membrane Science, 382(1–2), 1–19.
Flanzy, C. (1998). Œnologie: Fondements scientifiques et technologiques. Paris: Lavoisier TEC&DOC.
Grenier, A., Meireles, M., Aimar, P., & Carvin, P. (2008). Analysing flux decline in dead-end filtration. Chemical Engineering Research and Design, 8(11), 1281–1293. Hermans, P. H., & Bredee, H. L. (1936). Principles of the mathematical treatment of
con-stant pressure filtration. (Pappas). Journal of Society of Chemical Industry, 55(1), 1–11.
Hermia, J. (1982). Constant pressure blocking filtration laws—Application to power-law non-Newtonian fluids. Transaction of the Institution of Chemical Engineers, 60, 183–187.
Iritani, E., Mukai, Y., Tanaka, Y., & Murase, T. (1995). Flux decline behavior in dead-end microfiltration of protein solutions. Journal of Membrane Science, 103(1–2), 181–191.
Jiraratananon, R., Uttapap, D., & Tangamornusksun, C. (1997). Self-forming dynamic membrane for ultrafiltration of pineapple juice. Journal of Membrane Science, 129(1), 135–143.
Kirk, D. E., Montgomery, M. W., & Kortekaas, M. G. (1983). Clarification of pear juice by hollow fiber ultrafiltration. Journal of Food Science, 48(6), 1663–1667.
Nandi, B. K., Das, B., Uppaluri, R., & Purkait, M. K. (2009). Microfiltration of mosambi juice using low cost ceramic membrane. Journal of Food Engineering, 95(4), 597–605.
Nandi, B. K., Das, B., Uppaluri, R., & Purkait, M. K. (2011). Identification of optimal mem-brane morphological parameters during microfiltration of mosambi juice using low cost ceramic membranes. LWT— Food Science and Technology, 44(1), 214–223. Poirier, D., Bennasar, M., Tarodo de la Fuente, B., Gillot, J., & Garcera, D. (1984). Clarifi-cation et stabilisations des vins par ultrafiltration tangentielle sur membranes minérales. Le Lait, 64(638–639), 141–142.
Poncet-Legrand, C., Cartalade, D., Putaux, J. L., Cheynier, V., & Vernhet, A. (2003). Flavan-3-ol aggregation in model ethanolic solutions: Incidence of polyphenol structure, concentration, ethanol content and ionic strength. Langmuir, 19(25), 10563–10572.
Preys, S., Souquet, J. M., Meudec, E., Morel-Salmi, C., & Cheynier, V. (2004). Develop-ment of a rapid quantative method to analyse proanthocyanidins in red wines. (25–28 August 2004, Helsinki, Finland). Proceedings of XXII International Conference on Polyphenols (pp. 25–28).
Rai, P., Majumdar, G. C., Dasgupta, S., & De, S. (2005). Understanding ultrafiltration per-formance with mosambi juice in an unstirred batch cell. Journal of Food Process En-gineering, 28(4), 166–180.
Rai, P., Majumdar, G. C., Dasgupta, S., & De, S. (2006). Modeling of sucrose permeation through a pectins gel during ultrafiltration of depectinsized mosambi [Citrus sinensis (L.) Osbeck] juice. Journal of Food Science, 71(2), 87–94.
René, F., & Lalande, M. (1991). Momentum and mass transfer during ultrafiltration of dextran with tubular mineral membranes in turbulent flow regime. Journal of Membrane Science, 56(1), 29–48.
Ribéreau-Gayon, P., Glories, Y., Maujean, A., & Dubourdieu, D. (2006). Handbook of enol-ogy (2nd ed.). The chemistry of wine, stabilization and treatments., 2, Paris: Dunod. Riedl, K., Girard, B., & Lencki, R. W. (1998). Influence of membrane structure on fouling layer morphology during apple juice clarification. Journal of Membrane Science, 139(2), 155–166.
Riou, V., Vernhet, A., Doco, T., & Moutounet, M. (2002). Aggregation of grape seed tan-nins in model wine — Effect of wine polysaccharides. Food Hydrocolloids, 16(1), 17–23.
Salazar, F. N., de Bruijn, J. P. F., Seminario, L., Guell, C., & Lopez, F. (2007). Improvement of wine crossflow microfiltration by a new hybrid process. Journal of Food Engineer-ing, 79(4), 1329–1336.
Sato, A. C. K., Oliveira, P. R., & Cunha, R. L. (2008). Rheology of mixed pectins solutions. Food Biophysics, 3(1), 100–109.
Tracey, E. M., & Davis, R. H. (1994). Protein fouling of track-etched polycarbonate microfiltration membranes. Journal of Colloid and Interface Science, 167(1), 104–116.
Ulbricht, M., Ansorge, W., Danielzik, I., Konig, M., & Schuster, O. (2009). Fouling in microfiltration of wine: The influence of the membrane polymer on adsorption of polyphenols and polysaccharides. Separation and Purification Technology, 68(3), 335–342.
Usseglio-Tomasset, L. (1976). Les colloïdes glucidiques solubles des moûts et des vins. Connaissance de la vigne et du vin, 10(2), 193–226.
Vernhet, A., Cartalade, D., & Moutounet, M. (2003). Contribution to the understanding of fouling build-up during microfiltration of wines. Journal of Membrane Science, 211(2), 357–370.
Vernhet, A., & Moutounet, M. (2002). Fouling of organic microfiltration membranes by wine constituents: Importance, relative impact of wine polysaccharides and poly-phenols and incidence of membrane properties. Journal of Membrane Science, 201(1–2), 103–122.
Vernhet, A., Pellerin, P., Belleville, M. P., Planque, J., & Moutounet, M. (1999). Relative impact of major wine polysaccharides on the performances of an organic microfiltration membrane. American Journal of Enology and Viticulture, 50(1), 51–56.
Vladisavljevic, G. T., Vukosavljevic, P., & Bukvic, B. (2003). Permeate flux and fouling re-sistance in ultrafiltration of depectinsized apple juice using ceramic membranes. Journal of Food Engineering, 60(3), 241–247.
Ye, Y., Le Clech, P., Chen, V., Fane, A. G., & Jefferson, B. (2005). Fouling mechanisms of alginate solutions as model extracellular polymeric substances. Desalination, 175(1), 7–20.