HAL Id: irsn-00176550
https://hal-irsn.archives-ouvertes.fr/irsn-00176550
Submitted on 4 Oct 2007HAL is a multi-disciplinary open access archive for the deposit and dissemination of sci-entific research documents, whether they are pub-lished or not. The documents may come from teaching and research institutions in France or abroad, or from public or private research centers.
L’archive ouverte pluridisciplinaire HAL, est destinée au dépôt et à la diffusion de documents scientifiques de niveau recherche, publiés ou non, émanant des établissements d’enseignement et de recherche français ou étrangers, des laboratoires publics ou privés.
XPS Investigations of Ruthenium Deposited onto
Representative Inner Surfaces of Nuclear Reactor
Containment Buildings
Christian Mun, J.J. Ehrhardt, J. Lambert, C. Madic
To cite this version:
Christian Mun, J.J. Ehrhardt, J. Lambert, C. Madic. XPS Investigations of Ruthenium Deposited onto Representative Inner Surfaces of Nuclear Reactor Containment Buildings. Applied Surface Science, Elsevier, 2007, 253, pp.7613-7621. �10.1016/j.apsusc.2007.03.071�. �irsn-00176550�
XPS Investigations of Ruthenium Deposited onto Representative
Inner Surfaces of Nuclear Reactor Containment Buildings
C. Mun 1, J.J. Ehrhardt 2, J. Lambert 2, C. Madic 3
1 Institut de Radioprotection et de Sûreté Nucléaire (IRSN), Direction de la Prévention des
Accidents Majeurs (DPAM), Centre de Cadarache, BP3 – 13115 Saint-Paul-lez-Durance (France) Mail to: christian.mun@irsn.fr ×
2 Laboratoire de Chimie Physique et Microbiologie pour l’Environnement (LCPME) UMR 7564
CNRS-Nancy University - 405, rue de Vandoeuvre 54600 Villers-lès-Nancy (France) Mail to: ehrhardt@lcpe.cnrs-nancy.fr
3 Commissariat à l’Energie Atomique (CEA), Direction de l’Energie Nucléaire, Centre de
Saclay, 91191 Gif-sur-Yvette Cedex – France Mail to: charles.madic@cea.fr
ABSTRACT
In the case of a hypothetical severe accident in a nuclear power plant, interactions of gaseous RuO4 with reactor containment building surfaces (stainless steel and epoxy paint) could possibly
lead to a black Ru-containing deposit on these surfaces. Some scenarios include the possibility of formation of highly radiotoxic RuO4(g) by the interactions of these deposits with the oxidising
medium induced by air radiolysis, in the reactor containment building, and consequently dispersion of this species. Therefore, the accurate determination of the chemical nature of ruthenium in the deposits is of the high importance for safety studies. An experiment was designed to model the interactions of RuO4(g) with samples of stainless steel and of steel covered with epoxy paint. Then,
these deposits have been carefully characterised by scanning electron microscopy (SEM/EDS), electron probe microanalysis (EPMA) and X-ray photoelectron spectroscopy (XPS). The analysis by XPS of Ru deposits formed by interaction of RuO4(g), revealed that the ruthenium is likely to be in
the IV oxidation state, as the shapes of the Ru3d core levels are very similar with those observed on the RuO2,xH2O reference powder sample. The analysis of O1s peaks indicates a large component
attributed to the hydroxyl functional groups. From these results, it was concluded that Ru was present on the surface of the deposits as an oxyhydroxide of Ru(IV). It has also to be pointed out that the presence of “pure” RuO2, or of a thin layer of RuO3 or Ru2O5, coming from the
decomposition of RuO4 on the surface of samples of stainless steel and epoxy paint, could be ruled
out. These findings will be used for further investigations of the possible revolatilisation phenomena induced by ozone.
PACS codes: 28.41 Te (Safety (fission reactor)), 33.60 Fy (X-ray photoelectron spectroscopy),
82.65+r (surface interface chemistry)
Keyword: ruthenium oxides, ruthenium deposit, XPS, ruthenium oxyhydroxides.
INTRODUCTION
The study of ruthenium behaviour by the French “Institut de Radioprotection et de Sûreté Nucléaire” in cooperation with the CNRS, is motivated by several factors. Firstly, during nuclear reactor operation, the fission-product ruthenium will accumulate in the fuel. The quantity of ruthenium formed increases with fuel burn-up; moreover, its content is more important in MOX (Mixed Oxides) fuel than in classical UO2 fuel. As a consequence, the ruthenium amount formed in
fuel life will continuously rise as utilities continuously optimize fuel performance. Secondly, Ru is a high specific activity fission-product. Finally, besides its ability to form oxide compounds which are very volatile, this fission-product has, in addition to its chemical toxicity [1] [2] [3], a high radio-toxicity, essentially through its isotopes 106Ru (T
1/2 = 369 days) and 103Ru (T1/2 = 39.3 days). During a
hypothetical nuclear reactor Severe Accident (SA), significant release of volatile ruthenium species from fuel matrix may occur if the fuel is oxidized, for instance in the case of air ingression in the reactor vessel. Ruthenium can then flow through the reactor coolant system, and finally reach the reactor containment building. Under the containment building thermal-hydraulic conditions, the most stable gaseous species is the ruthenium tetroxide: RuO4(g).
RuO4(g) has been reported to have a certain affinity for iron oxides [4] [5] and for organic
compounds [6] [7]. Therefore, the significant part of surfaces present inside the French PWR (Pressurised Water Reactor) containment buildings may act as an efficient trap for RuO4(g) and so
has to be considered in terms of reactivity, as ruthenium is able of contaminating these inner surfaces (epoxy paints) and all stainless steel materials (316 L/ 304 L). As Ru could be trapped by the surface of these materials, it is believed that it would be present in a chemical form with an oxidation state below 8.
During a SA, the high dose rate in the containment building, linked to the presence of other fission-products than ruthenium, would induce air radiolysis products, notably ozone which is a strong oxidizing agent. Thus, ruthenium deposited onto inner containment surfaces, may be reoxidised up to RuO4. In order to quantify, and next to understand the mechanism involved in this
possible oxidation process, information concerning the Ru deposit are required. This paper presents the results of such an analysis and it constitutes a preliminary step of the study devoted to the Ru revolatilisation phenomena.
Over the past decade, it has been demonstrated that XPS technique could provide powerful information regarding oxidation state and stoichiometry for ruthenium oxides [8] [9] [10] [11]. Nevertheless, the characterisation by this technique is a very complex subject because Ru3d peaks are overlaid by C1s peaks which come from carbon surface contamination. Argon sputtering treatments could be applied to clean up the surface of the samples, but potential secondary effects such as possible reduction of the oxides have to be considered very carefully.
Concerning interactions between gaseous ruthenium tetroxide and stainless-steel substrates, some discrepancies exist between the different studies in the literature. Many authors [12] [13] [14] agree that ruthenium deposits from RuO4(g) consist of RuO2, according to the reaction RuO4(g) →
RuO2(s) + O2. Nevertheless, others have questioned this conclusion. For example Eichler [15]
attributed the low temperature deposit domain, at about 400 K, to the formation of RuO3(s) in
non-equilibrium conditions, even if its existence has not been established. This assumption was also supported by Zimmerman et al. [16] who focused their studies on RuO4 photochemical decomposition
onto steel substrates. The existence of ruthenium trioxide in solid form was also mentioned by Kim et al. [17] who provides well characterised XPS spectra. They found a surface layer corresponding to RuO3 on anhydrous RuO2(s). Sakurai et al. [18] studied RuO4(g) interactions with various surfaces,
including stainless steels, at room temperature and low pressure. Contrary to the already quoted hypothesis concerning RuO4 decomposition into (RuO2 + O2), they were not able to obtain any
experimental evidence about dioxide formation, even if the black colour of the deposit is consistent with RuO2. According to them, the deposit was not RuO2, but a ruthenium tetroxide form modified by
the interaction with the metal. In fact a RuO4 molecule is supposed to be linked to another one via
peroxide Ru-O-O-Ru bonds. In that case, the black deposit observed would consist of (RuO4)n polymerised with peroxide bonds. It must be noticed that no experimental study of the interaction between gaseous ruthenium tetroxide and paints has been carried out yet.
Therefore, the actual nature of this deposit is not well characterised up to now and this study is devoted to a better understanding of the properties of this over layer. For that purpose coatings of Ru compounds formed by the interaction of RuO4(g) with samples of stainless steel and also of
In this paper, the experimental set-up dedicated to the generation of crystallised ruthenium tetroxide, and the preparation of the ruthenium coatings, by interaction of RuO4(g) onto the
specific substrates previously cited, are briefly described. Then, an overview of the surface observations by SEM/EDS, and the results obtained by EPMA are presented. The XPS results of the ruthenium deposit samples surface analysis are presented and discussed.
1 EXPERIMENTAL
1.1 Preparation of samples coated with ruthenium deposit
Since RuO4 is not commercially available due to its instability, the first step consisted in
generating this species as pure as possible, under a crystallised form. The principle of this process is based on the oxidation of Ru(III) to Ru(VIII), and then, thanks to its volatility, ruthenium tetroxide is transported as a gas and finally condensed in a liquid nitrogen cold trap. More details can be found in the reference [19].
The deposition of ruthenium coatings onto surfaces of stainless steel and painted steel followed the procedure described hereafter. The RuO4 crystals were sublimated from the condenser
reactor. The sublimation of RuO4 usually begins at temperature higher than 7°C [7] [20]. Then, a
dry air flow transported ruthenium tetroxide vapours through a glass line to a temperature controlled reactor, simulating the containment building (called “Containment Reactor” or CR). Previously, a surface sample was placed inside the CR.
The dimensions of the steel samples were 8.5 mm × 8 mm × 5 mm (thickness), and 13.3 mm × 10 mm × 5 mm (thickness) for the painted samples, in order to be close to the containment surface-volume ratio (0.35). The duration of each adsorption experiment was fixed at 24 hours.
The temperature of the CR was set to 90°C, that is representative of the containment temperature during a SA. The pictures of a stainless steel sample, before and after ruthenium interaction, are presented in Figure 1. The characteristic black colour deposit is clearly seen on these pictures.
1.2 Surface analysis experimental procedure
1.2.1 SEM/EDS and EPMA
Concerning the analysis by SEM/EDS, the ruthenium deposits were examined by a Jeol 6330F scanning electron microscope equipped with an Oxford Si/Li LED. A X-Ray analyzer coupled to the SEM allows us to perform a semi-quantitative analysis of the sample surfaces. Spectra were analysed using the IMIX/PGT software. We worked without metallization of the sample, and using a low tension (lower than 1.5 keV).
The aim of EPMA analysis was here to determine the thickness of the Ru layer of the deposits. Indeed, the incident electrons will penetrate the matter on a depth of a few µm, and the X-ray radiation emitted into the sample will partially be absorbed by itself, before being emitted again in the vacuum, and finally detected. The emitted intensity I is linked to the generated intensity I0 at
the depth x, by the following equation: I = I0 e-µx. We performed several measurements of the
intensities ratio with and without a Ru layer, by changing the acceleration tension of the electron beam. Then, we used a model named X-film, developed by Merlet et al. [21], which can fit the curve I/I0=f(V), and finally we obtained the surface mass parameter: xρ.
The steel FeKα line at 6.4 keV was used as the X-ray emission of the substrate. The electron beam acceleration tension ranged between 5 and 30 kV. For each tension, 20 measurements were performed on random areas onto the Ru deposit, and then onto the steel substrate.
1.2.2 XPS
The XPS analyses were carried out with a Kratos Axis Ultra (Kratos Analytical, UK) spectrometer with a hemispherical energy analyser and using a monochromatic AlKα source (1486.6 eV). As the delay-line detector allows a high count rate the power applied to the X-ray anode was reduced to 90 W so that the possible X-ray induced degradation of the sample was minimized. The instrument work function was calibrated to give a binding energy (BE) of 83.96 eV for the Au 4f7/2 line for metallic gold and the spectrometer dispersion was adjusted to give a BE of 932.62 eV for Cu 2p3/2 line for metallic copper.
The samples were attached to the sample holder and then evacuated overnight prior analyses. The pressure in the analysis chamber during XPS analysis was in the low 10-9 mbar range.
All spectra were recorded at a 90° take-off angle, the analysed area being currently about 700 µm2. Survey spectra were recorded with 1.0 eV step and 160 eV analyser pass energy and the
high resolution regions with 0.05 eV step and 20 eV pass energy (instrumental resolution better than 0.5 eV). In both cases the hybrid lens mode was employed. Spectra were analysed using the Vision software from Kratos (Vision 2.2.0). A Shirley base line allows the subtraction of the background whereas Gaussian G (60%) Lorentzian L (40%) peaks or asymmetrical GL peaks were used for spectral decomposition.
The analysed samples were not prepared in situ in the XPS analysis chamber and the ions sputtering cleaning procedure was only used for metallic Ru on which no artefact would be expected. Therefore, in the process of transferring the Ru containing deposits from the experimental set-up to the XPS analysis chamber, the samples were inevitably exposed to atmospheric conditions and some surface contamination could not be avoided.
In order to have a basis of consistent standards for Ru chemical environments, some reference samples were analysed in the same conditions as described above. For that purpose, it has been used a ruthenium rod purchased from Goodfellow, an anhydrous ruthenium dioxide powder (RuO2, 99.95 % metals basis), and an hydrated ruthenium dioxide powder purchased from Alfa Aesar
(RuO2,xH2O, 99.99 % metals basis, with typically x ≈ 2.3).
2 RESULTS AND DISCUSSION
2.1 SEM/EDS
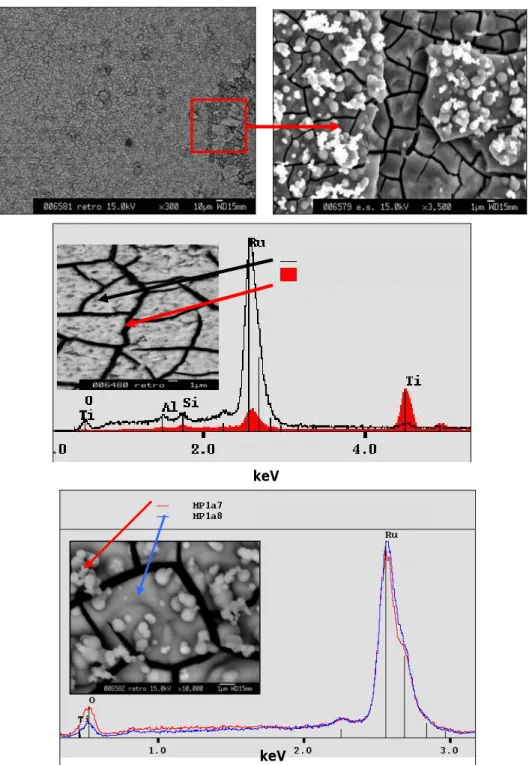
Due to the apparent non-uniform Ru deposit layer onto both steel and painted substrates, several analyses were performed in each case. For the stainless steel substrate, SEM micrographs and EDS spectra are presented in Figure 2. The lightest-coloured zones rich in Fe, Cr, Ni, also contain Ru, and the brownish colour in particular phases is explained by the presence of more Ru atoms.
SEM micrographs and EDS spectra for the painted sample are presented in Figure 3. It can be seen that ruthenium deposit was clearly crackled, but it was not the epoxy paint coat because TiO2
is visible in the cracks. Ru is clearly under oxidized form, but since the deposits were not perfectly uniform, like those obtained on stainless steel substrates, we do not know if the measured oxygen does not in fact come from the paint.
Some micro-pellets are present on the surface, and the EDS analysis revealed that in this case the Ru species seemed to be more oxidized than in the brownish homogenous layer. This point may indicate the presence of a second Ru species. Nevertheless, it must be noted that the non flatness of the surface could lead to intensity differences in the O peak.
2.2 EPMA
Let us note that initially XRD analysis was planned to characterise the structure of the Ru deposits. For both painted and stainless steel substrates, it appeared that it was really difficult to detect ruthenium, evidencing that the thickness of Ru layer must be very low. Nevertheless, it seemed that the steel Ru XRD diagram was characteristic of an amorphous sample. As previously demonstrated by Mills et al. [22], the difference in the crystallinity between anhydrous and hydrated RuO2, is directly related to the content of water in the sample. Even if the Ru layer
thickness was extremely low, we can postulate that the species present could be an hydrated ruthenium form.
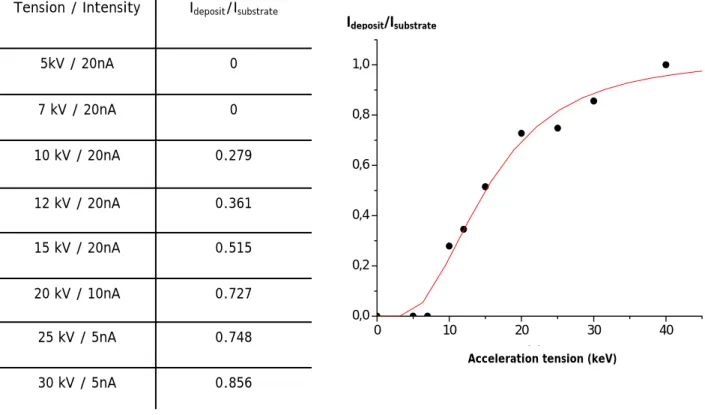
Due to the last difficulties to get useful information with XRD experiments, a study using EPMA was performed in order to determine the thickness of Ru layer on specific substrates. The methodology, previously detailed in paragraph 1.2.1, has been applied to determine the thickness of the Ru layer on the stainless-steel sample, but it cannot be used for the painted substrate due to its non conductive character. The experimental mean intensities ratios calculated are reported on the Figure 4.
According to these experimental data, we obtain a surface mass of 0.092 mg/cm². If we assume that the deposit is made of ruthenium dioxide, the corresponding RuO2 density is 7.05
g/cm3, therefore the thickness of Ru layer can be deduced to be equal to 0.13 µm. This value is
extremely low and coherent with the XRD observations.
2.3 XPS
2.3.1 Reference samples
Three reference samples have been analysed in order to establish a coherent basis of binding energies for ruthenium compounds, namely a Ru(0) rod, an anhydrous ruthenium dioxide powder and an hydrated ruthenium dioxide powder (see paragraph 1.2.2 for the details).
For both powders, a tablet was realized with 50 mg of dioxide, using a hydraulic power press delivering a pressure of 8000 psi. The diameter of each tablet was 13 mm.
Ruthenium dioxide is the most stable species among the family of the ruthenium oxides. In the bulk phase, RuO4 sublimes from 7°C. It is well known that RuO3 is only thermodynamically stable
at temperature higher than 1300°C as a gas, and therefore no reference sample can be studied. A ruthenium slide, cut in a rod, has been freshly polished before its introduction in the analysis chamber and a short argon sputtering treatment has been applied to clean up its surface.
The Ru3d core level spectrum is presented in Figure 5a. As expected for a metal, an asymmetric line shape (90 % Lorentzian, 10 % Gaussian, with a ratio of the half width at full height of 0.7) gives the best fit for the 3d3/2 and 3d5/2 lines processing. The spin-orbit coupling gives rise to a separation of 4.21 eV as usually reported in previous published papers [9] [11]. The Ru3d5/2 is pointed out at a binding energy (BE) of 279.95 eV, its FWHM (full width at half maximum) being of 0.72 eV. This value of BE is in full agreement with the values cited in a previous paper [9] (including the references included in this paper) ranging between 279.96 and 280.3 eV. Within the decomposition procedure applied on the spectrum and presented in Figure 5a, two broad peaks are also necessary for a full fit of the spectrum. These features have been previously observed on Ru thin film cleaned by oxidation at 400°C to remove carbon contamination followed by reduction in H2
at 300°C [9].The BE of Ru 3d5/2 component is located at 281.55 eV leading to an apparent shift is about 1.6 eV. The interpretation of these peaks is not clear. A straightforward explanation could be the presence of Ru in a higher oxidation state on the surface or in the sub-surface area. However the very weak signal of oxygen weakens considerably this explanation. The presence of shake-up satellites would certainly be privileged in the interpretation of this complex line shape of Ru(0). Finally, it has to be noticed that no discernable feature at 284.6 eV, where the C1s core level peak of adventitious carbon contamination is expected, indicating that the cleaning method used here was very efficient.
The anhydrous RuO2 is an oxide that behaves as a metallic conductor and consequently i) no
charge correction was necessary to be applied to the BE scale and, ii) an asymmetric line shape is expected [10]. Some Ar sputtering has been tested for cleaning the surface of this sample, dramatic effects have been observed: peak enlargement and also appearance of a totally unexpected Ru(0) component.
Therefore no cleaning attempt was applied and some contamination could certainly be present on the surface. The Ru 3d spectrum is reported on Figure 5b. It is much more complex and six components were necessary to obtain a fit of good quality. The S-O splitting of the two main peaks is estimated to 4.14 eV. The BE of the Ru 3d5/2 line is pointed out at 280.77 eV in full agreement with previously reported values in the literature [ref. [9] and literature cited therein], ranging between 280.68 and 281.0 eV. Besides these mains peaks, a further doublet was introduced with a shift of 1.45 eV. This high binding energy spin-orbit doublet was extensively discussed in a previously published article [10] and has been likely attributed to an unscreened final state, the high binding energy doublet being fully screened. It has to be noticed that the intensity of these satellites compared to the intensity of the main peaks is much higher than in the case of Ru(0). The nature of these extra peaks is certainly very different. Finally, two peaks located at 284.4 and 288.6 eV have been attributed to C1s due to carbon contamination of the surface of the sample. The value of 284.4 eV is slightly lower than the expected value for adventitious carbon at 284.6 eV, but has been judged quite satisfactory considering the rather complex decomposition procedure. The peak at 288.6 eV could be associated to an oxidised form of carbon, for example carbonates.
It is known that RuO2 behaves as a hygroscopic oxide and a hydrated ruthenium dioxide
sample has also been investigated. The Ru3d spectrum is presented on Figure 5c, the parameters of decomposition used for the anhydrous RuO2 sample (number of peaks, line shapes, FWHMs, ratio
branching) have been used here, allowing only a shift of the overall spectrum and of course of the intensities. The fit is fully satisfactory. The BE of the Ru 3d5/2 core level is pointed at 282.30 eV on this sample in agreement with the value reported recently on RuO2 prepared by electrochemistry
[10]. On this sample, the high binding energy spin-orbit doublet is obviously of higher intensity than on anhydrous RuO2 and the C1s line is also pointed at 284.4 eV. Interestingly enough is the
comparison of the O1s spectra obtained on both reference samples and presented in Figures 7a and 7b, for RuO2 and RuO2,xH2O respectively.
The decomposition of these O1s peaks has been performed in a classical way, using three components (BE = 529.45, 530.75 and 532.6 eV) attributed tentatively to oxygen atoms in three chemical environments namely: O2-, OH- and H
2O, associated respectively, to lattice oxygen,
It appears clearly that the “water” component is always rather weak, the samples being characterised in UHV conditions, only a bilayer of water molecules is expected to remain on the surface of the oxide according to the enthalpy of adsorption of water [23]. Furthermore the component at 530.75 eV increases significantly in the hydrated RuO2 sample giving then a strong
evidence of a hydroxylation process. Therefore it is believed that the exposure of RuO2 to water is
not restricted to a simple hydration process, but results in a chemical reaction producing, at least on the surface, a pseudo oxyhydroxide. Finally, one should notice that the so-called anhydrous RuO2
presents also some surface hydroxylation (Figure 6a), probably due to exposure to the ambient atmosphere prior to the transfer to the analysis chamber.
This analysis into three components presents some similarity with the decomposition proposed by Chan et al. [9], on Ru thin films oxidised under oxygen at atmospheric pressure, but the assignments are quite different. The lower binding energy peak was assigned to oxygen atoms of the lattice whereas the high binding energy component would be related to adsorbed atomic oxygen. This interpretation would not be consistent with the sample preparation used in this study.
In this interpretation of the O1s core level line, two types of oxygen atoms are clearly identified if the contribution of water adsorption is neglected. As expected, the more the oxide is hydrated, the more the intensity of the hydroxyl signal is important, and it has to be recalled that the hydroxyl signal is also clearly observed on the “anhydrous” RuO2 sample. Coming back to the
Ru3d spectra observed on the anhydrous and hydrated RuO2, it is clear that the high binding energy
spin-orbit doublet behaves the same way than this O1s component. Therefore, a new interpretation of this high binding energy spin-orbit doublet could be the fingerprint of Ru atoms having at least one hydroxyl group as neighbour. In the absence of well characterised oxyhydroxide of Ru(IV), the only way to consolidate this hypothesis would be to perform electronic charge calculations on the Ru atoms in various structural configurations. However, this interesting aim is quite away the scope of the present work.
2.3.2 Stainless steel samples
The Ru layers deposited on a piece of stainless steel (8.5 x 8 mm) have been analysed by XPS without using the charge neutraliser system. It has been checked that the deposit is rather homogeneous on the whole surface in recording the spectra in various zones of the prepared samples, thanks to the low area of analysis (700 µm).
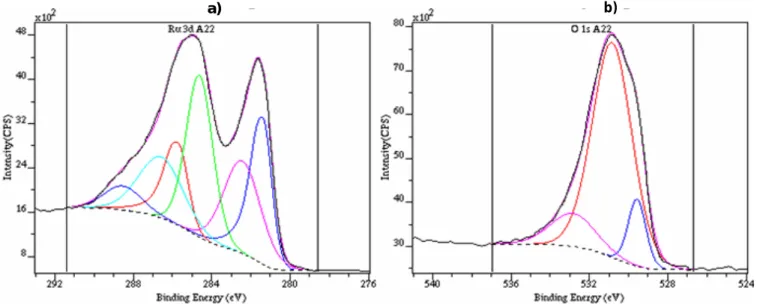
No significant difference was observed. As the spectra are very similar, only a typical example is presented on Figure 7a (Ru3d spectral area), and 8b (O1s zone). The spectra of Ru 3d and O1s have been analysed using the procedure developed for ruthenium dioxide samples presented in the previous section. The shapes of the Ru3d core levels are very similar with that we observed on RuO2,xH2O. The BE of the Ru 3d5/2 level is pointed out at 281.4 eV and on this spectra
the C1s line appears to be located at a BE of 284.6 eV, with a noticeable higher intensity than on the reference sample. The O1s line is however completely dominated by the hydroxyl component.
2.3.3 Painted samples
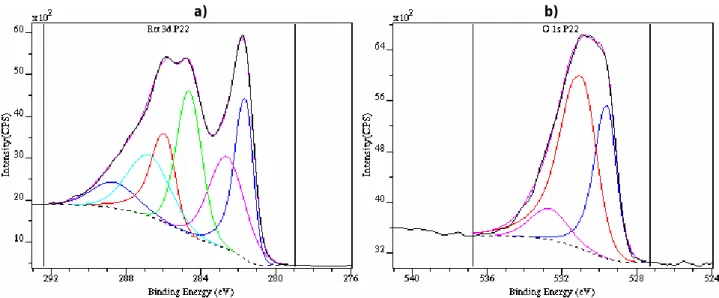
The Ru layers deposited on a piece of painted steel (13.3 x 10 mm) have been analysed by XPS (cf. Figure 8a and 8b). This kind of sample being a bad conductive material, the use of the charge neutraliser could not be avoided. Therefore, after decomposition of the Ru lines by always the same procedure, the C1s line was fixed at 284.6 eV, and the coherency of this calibration was checked by the O1s signal, the O2- signal appearing at 529.6 eV as expected.
2.3.4 XPS discussion
The XPS results for both Ru layers deposited onto steel and painted samples indicate that the nature of the Ru compounds is identical. These species are in accordance to those detected in the hydrated Ru dioxide reference powder.
The fact that the interaction of RuO4 with both stainless steel and painted substrates yields to
the formation of the same species can be understood in considering the ruthenium tetroxide decomposition mechanism previously proposed [27]. Indeed, the results obtained during RuO4(g)
adsorption experiments on the two specific substrates considered here [27], have demonstrated that mean adsorption kinetic constants were extremely low (≈ 10-8 m.s-1). These values would not be
consistent with an efficient adsorption mechanism.
It has been concluded that the decomposition of RuO4 in the gas phase should occurred, and
the deposition of non-volatile Ru species, i.e. condensation, was at the origin of the deposition phenomenon. As experimentally observed, the Ru deposit was nearly proportional to the surface area (whatever the nature of the substrate: steel, paints and even glass).
Although the existence of particular species like ruthenium trioxide was claimed by Kim et al. [17] or Zimmerman et al. [16], to be present as a surface structure defect, this interpretation seems not to be consistent with our experimental results. Indeed, the areas of the two Ru 3d5/2 peaks in both states are quite similar (cf. Figure 7a and 8a), which are not really convincing for the presence of a structure defect.
The presence of amorphous ruthenium pentavalent oxide species, Ru2O5, has been also
reported by several authors [24] [25] [5], but this form of Ru(V) is not really consistent with the presence of OH- hydroxyl groups detected here.
From our point of view, hydroxyl forms of ruthenium dioxide are present in the Ru layers. These ones are the only species which could explain their presence in both ruthenium dioxide powders and Ru deposits samples, and consistent with our experimental observations.
In the literature, little is known about the Ru-O-H system, and particularly quantitative thermochemical experiments are lacking. Let us note that Rard [26] indicated, from the scarce thermodynamic data, that RuO2,2H2O and Ru(OH)3,H2O are both believed to be metastable. This
kind of hydroxide forms of Ru may also be present in our deposits in equilibrium with the hydrated ruthenium dioxide, but the presence of the +III oxidation state is less convincing. By analogy with Fe(III) or Mo(VI) oxide and oxyhydroxide species, it might be expected the existence of RuO2(OH)2,
but this species must be ruled out by the lower stability of the Ru(VI) oxidation state, relative to Ru(IV) one. Thus, the species RuO(OH)2 (hydrated or not) corresponding to an oxyhydroxide of Ru(IV)
CONCLUSIONS
XPS technique used in this study to characterise ruthenium deposits, provide high sensitivity level rarely achieved, allowing us to determine the BE and the relative contribution of each component in the decomposition of the O1s peaks or the Ru3d core levels. The presupposed decomposition of RuO4 into final RuO2 on the surface was not experimentally verified. Moreover, the
presence of the two “exotic” species: ruthenium trioxide or diruthenium pentavalent oxide, already mentioned by different authors, cannot be confirmed with the present study. Another interpretation is proposed.
The XPS results for Ru layers, whatever the nature of the surface is, show that Ru deposits are identical to the hydrated Ru dioxide reference powder. It can be concluded that the ruthenium species on the surface are in the IV oxidation state. The decomposition of O1s peaks for both stainless steel and painted substrates indicate the predominance of the ruthenium hydroxyl forms, corresponding to oxyhydroxide species of Ru(IV).
Thus, oxyhydroxide of Ru(IV) has to be considered in the oxidation process by ozone in nuclear reactor containment buildings. No thermodynamic data are available for the Ru oxyhydroxide species. Experiments to study the possible Ru revolatilisation phenomena by action of ozone are planned.
ACKNOWLEDGMENTS
This work was achieved through the financial support of the partners of the International Source-Term Project (ISTP) like “Electricité de France” (EDF), CEA, NRC, PSI…
The authors are thankful to A.Grandjean, for her assistance in the SEM/EDS analysis. C.Duriez and S.Sao Joao are also greatly acknowledged for helpful discussions about EPMA analysis.
REFERENCES
[1] M.E. Frazier, T.K. Andrews, B.B. Thompson, M.A. Wincek, Evaluation of toxic effects of heavy metals and chelating agents in VERO cells. Pacific Northwest Laboratory Annual Report. DOE Assist. Secr. Environ. (1977).
[2] B. Szubinska, J.H. Luft, Ruthenium red and violet. III- Fine structure of the plasma membrane and extraneous coats in amoebae (A proteus and chaos chaos). Anat. Rec. 171 (1971) 417-442. [3] R. Masse, Le ruthénium, les métaux activés. Masson ed. Toxiques Nucléaires. (1982) 112-124. [4] C. Courtois, Oxydes du ruthénium et piégeage des composés volatils du ruthénium, CEA report
BIB-213: Fontenay-aux-roses. (1974).
[5] A. Ortins de Bettencourt, A. Jouan, Volatilité du ruthénium au cours des opérations de vitrification des produits de fission (2ème partie) - Rapport CEA-R-3663 (2): CEN de Fontenay-aux-Roses. (1969).
[6] P. Pascal, Nouveau traité de chimie minérale, Tome XIX (1958) 21-171.
[7] E.A. Seddon, K.R. Seddon, The Chemistry of Ruthenium. Monograph 19, ed. E. (Amsterdam): Elsevier (1984).
[8] J.Y. Shen, A. Adnot, S. Kaliaguine, An ESCA study of the interaction of oxygen with the surface of ruthenium. Appl. Surf. Sci. 51( 1991) 47-60.
[9] H.Y.H. Chan, C.G. Takoudis, M.J. Weaver, High pressure oxidation of ruthenium as probed by surface enhanced Raman and X-ray Photoelectron spectroscopies. Journal of Catalysis 172 (1997) 336-345.
[10] H.J. Lewerenz, Oxygen Evolution and Corrosion: XPS Investigation on Ru and RuO2 Electrodes.
Surf. Sci. 126 (1983) 463-468.
[11] D. Rochefort, P. Dabo, D. Guay, P.M.A. Sherwood, XPS investigations of thermally prepared RuO2 electrodes in reductive conditions. Electrochem. Acta 48 (2003) 4245-4252.
[12] E.T. Maas, J.M. Longo, Confinement of ruthenium oxides volatilized during nuclear fuels reprocessing. Nuclear Technology 47 (1980) 451-456.
[13] M.J. Holdoway, The volatilisation and deposition of ruthenium dioxide in relation to fingal process. Atomic Energy Research Establishment Report, AERE-R6418, Harwell (1971).
[14] P.W. Cains, S.J. Barnes, Deposition of volatilized ruthenium on stainless steels. J. of Nucl. Mat. 186 (1991) 83-86.
[15] B. Eichler, F. Zude, W. Fan, N. Trautmann, G. Herrmann, Volatilization and deposition of ruthenium oxides. Radiochim. Acta. 56 (1992) 133-140.
[16] G.L. Zimmerman, S.J. Riviello, T.A. Glauser, J.G. Kay, Photochemical decomposition of RuO4.
J. of the Amer. Chem. Soc., 94 (1990) 2399-2404.
[17] K.S. Kim, N. Winograd, X-ray Photoelectron Spectroscopic studies. J. of Catal. 35 (1974) 66-72. [18] T. Sakurai, Y. Hinatsu, A. Takahashi, G. Fujisawa, Adsorption of ruthenium tetroxide on metal
surfaces. J. Phys. Chem. 89 (1985) 1892-1896.
[19] C. Mun, L. Cantrel, C. Madic, Study of the ruthenium fission-product behaviour in the containment of a nuclear reactor, in the case of a severe accident occurring in oxidizing conditions. Proc. Nuclear Energy for New Europe. Bled, (2005).
[20] F. Mousset, Electro-volatilisation du ruthénium en milieu nitrique, Thèse Université Paris-VI (2004).
[21] C. Merlet, E.S. Etz, A new quantitative model for multi-layer films in electron probe microanalysis. Proc. Microbeam Analysis, VCH, 203. (1995).
[22] A. Mills, S. Gidding, I. Patel, C. Lauwrence, Thermally activated ruthenium dioxide hydrate. A reproducible, stable oxygen catalyst. J. Chem. Soc. Faraday Trans 1. 83(8) (1987) 2331.
[23] M.A. Henderson, The interaction of water with solid surfaces. , Ed. F.a.r.-S.S.R. (2002) 1-308. [24] G. Nowogrocki, G. Tridot, Etude de l'acidification des solutions de ruthénates et perruthénates.
Bull. Soc. Chim. de France, 124 (1965) 688-690.
[25] H. Debray, A. Joly, Compte rendu des séances de l'académie des sciences, 106 (1888) 328-333. [26] J.A. Rard, Chemistry and thermodynamics of ruthenium and some of its inorganic compounds
and aqueous species. J. of the Amer. Chem. Soc. Chemical Reviews 85(1) (1985) 1-39.
[27] C. Mun, L. Cantrel, C. Madic, Study of RuO4 decomposition in dry and moist air. Accepted for
a) b)
5 mm
Figure 1: Picture representing stainless steel substrates, before (a), and after (b), RuO4(g)
deposition.
keV
keV
keV
0.856 30 kV / 5nA 0.748 25 kV / 5nA 0.727 20 kV / 10nA 0.515 15 kV / 20nA 0.361 12 kV / 20nA 0.279 10 kV / 20nA 0 7 kV / 20nA 0 5kV / 20nA Ideposit/Isubstrate Tension / Intensity 0 10 20 30 40 0,0 0,2 0,4 0,6 0,8 1,0 Idépot substrat/I
Tension d'accélération(keV)Acceleration tension (keV)
Ideposit/Isubstrate
Figure 4: Mean intensities ratios as a function of the acceleration tension.
b) c)
a)
Figure 5: XPS spectra of Ru3d core level lines: on a clean metallic sample (a), of anhydrous RuO2 (b), of hydrated RuO2,xH2O (c).
b) a)
Figure 6: XPS spectra of O1s on anhydrous RuO2 sample (a), and on hydrated RuO2 ,xH2O
sample (b).
b) a)
Figure 7: XPS spectra of Ru 3d (a), and O1s (b), of a Ru layer deposited on a piece of stainless steel.
a) b)