American Dairy Science Association, 2003.
Within-Herd Effects of Age at Test Day
and Lactation Stage on Test-Day Yields
J. Bormann,*,† G. R. Wiggans,† T. Druet,*,‡ and N. Gengler*,‡ *Animal Science Unit, Gembloux Agricultural University, B-5030 Gembloux, Belgium †Animal Improvement Programs Laboratory, Agricultural Research Service, USDA, Beltsville, MD 20705-2350
‡National Fund for Scientific Research, B-1000 Brussels, Belgium
ABSTRACT
Variance ratios were estimated for random within-herd effects of age at test day and lactation stage, on test-day yield and somatic cell score to determine whether including these effects would improve the accu-racy of estimation. Test-day data starting with 1990 calvings for the entire US Jersey population and Hol-steins from California, Pennsylvania, Wisconsin, and Texas were analyzed. Test-day yields were adjusted for across-herd effects using solutions from a regional analysis. Estimates of the relative variance (fraction of total variance) due to within-herd age effects were small, indicating that regional adjustments for age were adequate. The relative variances for within-herd lactation stage were large enough to indicate that accu-racy of genetic evaluations could be improved by includ-ing herd stage effects in the model for milk, fat, and protein, but not for somatic cell score. Because the within-herd lactation stage effect is assumed to be ran-dom, the effect is regressed toward the regional effects for small herds, but in large herds, lactation curves become herd specific. Model comparisons demonstrated the greater explanatory power of the model with a within-herd-stage effect as prediction error standard deviations were greater for the model without this ef-fect. The benefit of the within-herd-stage effects was confirmed in a random regression model by comparing variance components from models with and without random within-herd regressions and through log-likeli-hood ratio tests.
(Key words: test-day model, genetic evaluation, yield traits, lactation curves)
Abbreviation key: RRM= random regression model.
Received October 16, 2001. Accepted April 1, 2003.
Corresponding author: G. R. Wiggans; email: wiggans@aipl. arsusda.gov.
INTRODUCTION
In addition to improved accounting for environmental effects, an advantage of test-day models over genetic evaluations based on lactation records is that they may account for differences in the shape of the lactation curve. In a fixed regression model (Ptak and Schaeffer, 1993), all cows within a class (e.g., age-parity-season) are assumed to have the same lactation curve. A ran-dom regression model, with polynomial or other simple functions as covariates (Jamrozik and Schaeffer, 1997), allows the shape of the lactation curve to be split into two parts: a general part, accounting for similarities of lactation curves within specified groups (i.e., age classes), and an animal specific part (individual devia-tion from the class average lactadevia-tion curve). The general part is modeled by a fixed function and the animal part by a random one.
Environmental effects such as age and lactation stage (stage) have been reported to be major sources of varia-tion between herds (Kachman and Everett, 1989; Stan-ton et al., 1992). Everett et al. (1994) investigated the percentage of total variation removed in a model consid-ering age and stage within herd and a model restricted to global effects. In the herd effects model, 60% of the total daily yield variation was removed, whereas the global model removed only 45%.
Estimation of fixed effects within herd can be affected by small class size, where estimates are more likely to be outliers because they are not constrained to a predefined space. An alternative is to treat effects with small classes (e.g., within-herd stage and age effects) as random. Random effect solutions are regressed towards their expected value, the population mean. For small classes, the solution is close to its expected value, whereas for large classes the solution approaches the mean of the observations in its class. Thus, within-herd estimation based on random effects will have almost no effect in small herds, but large herds will have herd-specific adjustments. Unreasonable stage and age solu-tions should be avoided. The Northeast test-day model (Bauman et al., 1999) lacks this feature; lactation stage,
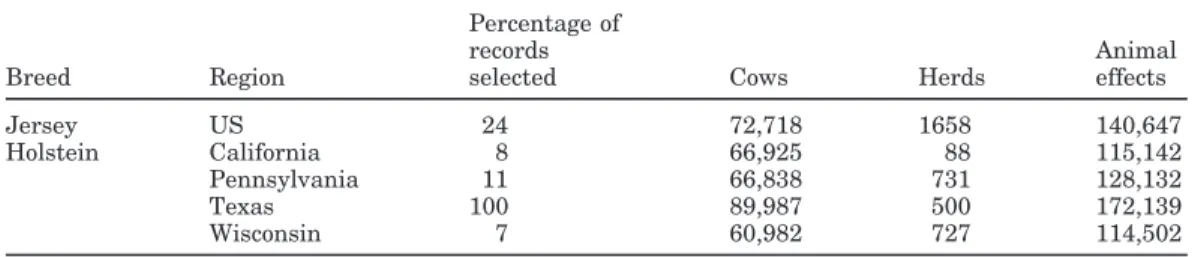
Table 1. Data used for variance ratio estimation by breed and region.
Percentage of
records Animal
Breed Region selected Cows Herds effects
Jersey US 24 72,718 1658 140,647
Holstein California 8 66,925 88 115,142
Pennsylvania 11 66,838 731 128,132
Texas 100 89,987 500 172,139
Wisconsin 7 60,982 727 114,502
age, month of calving, and pregnancy are included as fixed effects within herd.
Random regression models provide the most complete modeling of lactation curves by allowing for individual variation in the lactation curve. In a Canadian model comparison study, Liu et al. (1998) analyzed the residu-als of a random regression model and a fixed regression model, and the random regression model was shown to have smaller residuals. Similarly, in a study on moni-toring of daily milk yields to detect deviant or suspicious observations, Van Bebber et al. (1999) showed that a recursive repeatability test-day model, including a sub-model that accounted for the average shape of the lacta-tion curve, gave more accurate prediclacta-tion of daily yields than a “rolling average” model based on a cow’s own yields averaged over the past days, with no underlying environmental curve and no accounting for lactation stage. The accuracy of predictions depends upon model definition. By using lactation curves appropriate for a herd or groups within herd, a better model fit and higher accuracy in predictions can be achieved, resulting in breeding values that better reflect a cow’s true ge-netic merit.
Preadjustment for effects such as regional age, stage, and pregnancy (Gengler et al., 2000) can be done before estimating within-herd effects. Using preadjustments for global effects, within-herd solutions are obtained by fully iterating each herd successively. For calculating genetic evaluations, the across-herd estimation of breeding values could be carried out as a second step using a multi-trait analysis as proposed by Wiggans and Goddard (1997) or random regression as proposed by Gengler et al. (2000). There is, however, a need to allow some deviation from global effects, particularly for larger herds.
Given the issues described above, the objective of this study was to investigate the value of including random within-herd effects for age and stage in a single-trait repeatability model and, for herd-stage effects, to con-firm results through the introduction of within-herd (by 2-yr calving group) stage random regressions effects in a random regression model. Because differences in (co)variances had been found by herd production level (e.g., Veerkamp and Goddard, 1998), an additional
ob-jective was to extend the research on random regression models to different production levels to determine the value of within-herd age and stage effects by produc-tion level.
MATERIALS AND METHODS Data
Holstein data from four states (California, Pennsyl-vania, Wisconsin, Texas), and Jersey data from the en-tire US population were analyzed. Calvings from Janu-ary 1990 through December 1999 were grouped into five 2-yr classes. Parities one through five were included and three parity groups were defined (first, second, and later). Lactation was divided into 20-d classes. Age at test day was defined as number of months from birth. Age range by parity was 20 to 45 mo for first parity, 32 to 55 mo for second parity, and 45 to 96 mo for later parities. Test-day records were required to include fat and protein percent and milk yield. Most records also included SCS. Test days greater than 365 were deleted. Cows were required to have a minimum of three test-day records per lactation. Test-test-day observations were deleted if a test-day class (herd, test date) contained fewer than four observations. Number of days pregnant was based on reported breedings when available, but reported breedings resulting in days pregnant >280 were ignored. Pedigree was traced to ancestors born since 1980, and cows were required to have at least one parent identified. Genetic groups of unknown parents were defined by birth year in 2-yr classes from 1980.
For variance ratio estimation, herds were randomly selected so that at least one million test-day records were included in the Jersey file and each Holstein state file. Percentages of records selected from test-day data passing edits and number of animal effects included from Jersey and Holsteins by state are in Table 1. The completeness of pedigrees varied by state. Test-day re-cords from cows with one unknown parent were 17% for California, 1% for Wisconsin, 6% for Texas, and nearly 0% for Pennsylvania.
The stage-effect classes were defined by herd, 2 yr of calving, parity group, and 20-d interval.
Table 2. Number of records and means for milk, fat, and protein,
and adjusted herd test-day SCS used for within herd-level estimation of herd lactation curve variances.
Herd production level High Medium Low Records 75,838 74,845 71,996 Milk (kg) 35.4 28.8 25.6 Fat (g) 1282.2 1055.2 922.6 Protein (g) 1034.0 861.2 762.9 Records with SCS 63,301 63,625 51,333 SCS 2.62 2.92 3.24
For the random regression models, a subsample of first-lactation Holstein records was obtained from those used in the study of the herd-stage effect. Herds were then classified by mean annual production per cow into three categories: low (<7257 kg), medium (9072 to 9525 kg), and high (>11,340 kg).
This classification was done to test the consistency of results across production levels. Numbers of records and means used in estimation are in Table 2.
For all studies, test-day data passing edits were addi-tively preadjusted with fixed constants for age, stage, and pregnancy effects. These constants were estimated from random herd samples from data without multipli-cative preadjustment (Bormann et al., 2002). For Hol-steins, preadjustment effects were estimated sepa-rately for the four regions (California, Pennsylvania, Wisconsin, and Texas). Interactions involving parity and time period were taken into account.
METHODS
Repeatability model. A single-trait repeatability model was used. Test-day records were regarded as repeated records within and across lactations, assum-ing constant environmental and additive genetic vari-ances throughout lactation. The complete repeatability model equation for previously adjusted test-day yields was
y= Xhh+ Zaa+ Zss+ Zww+ Zcc+ Zgg+ e, where y= vector of test-day yield residuals, h = vector of fixed test-day class effects, a= vector of random within-herd age class (within-herd-two calving year interval-age) ef-fects, s= vector of random within-herd-two calving year-stage effects, w= vector of random lactation (within-lactation permanent environment) effects, c= vector of random cow (across-lactation permanent environment) effects, g= vector of additive genetic effects, e = vector of random residual test-day effects, Xh, Za, Zs, ZW, Zc, and Zg= incidence matrices linking y and the respective
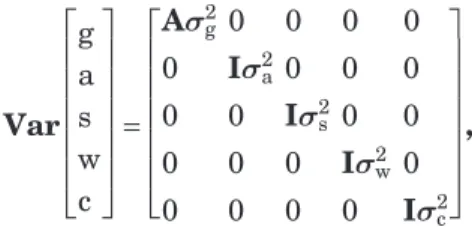
vectors of fixed or random effects. The (co)variance ma-trix is, Var g a s w c = Aσ2 g 0 0 0 0 0 Iσ2a 0 0 0 0 0 Iσ2 s 0 0 0 0 0 Iσ2w 0 0 0 0 0 Iσ2c ,
where A is the numerator relationship matrix. The total phenotypic variance can be written as
σy2= σ2a+ σ2s+ σw2 + σ2c+ σ2g+ σ2e.
Variance estimation. Method R (Reverter et al., 1994) with a preconditioned conjugate gradient algo-rithm for solving equations (Druet et al., 2001) was used to estimate variances from these large datasets as in Bormann et al. (2002). Estimates of variances from that study were used as starting values for this procedure. For each trait, Method R was run on six 50% subsamples. These subsamples were generated by changing the seed value of the random number genera-tor for each sample. Convergence was assumed when regression coefficients were between 0.9998 and 1.0002. The total number of iteration rounds required for con-vergence for the entire dataset and for the 50% samples ranged from 900 to 2800. Means and standard devia-tions of relative variances (as a percentage of the pheno-typic variance) were calculated. In a parallel test, within-herd stage effects were eliminated from the ran-dom herd-stage model, and within- and across-lacta-tion, additive genetic, and residual relative variances were investigated.
Goodness of fit. Maximum likelihood ratio tests are often used to compare one model to another. Because likelihood based variance components estimation tech-niques were not always used, the different test-day models could not be compared by such tests. In most studies of model fitting to test-day data, criteria such as the correlation between observed and predicted yields, mean absolute residuals or the variance, and distribu-tion of residual terms were explored (Guo and Swalve, 1997; Van Bebber et al., 1999; Pool and Meuwissen, 1999). The accuracy of test-day predictions was evalu-ated across herds by comparing prediction error stan-dard deviations from two computations, one with the complete model, including within-herd stage effect, and one with the same model without this effect. Required variances were developed from those computed earlier. Within-herd age effects were not included in the models for this comparison because analysis of adjusted
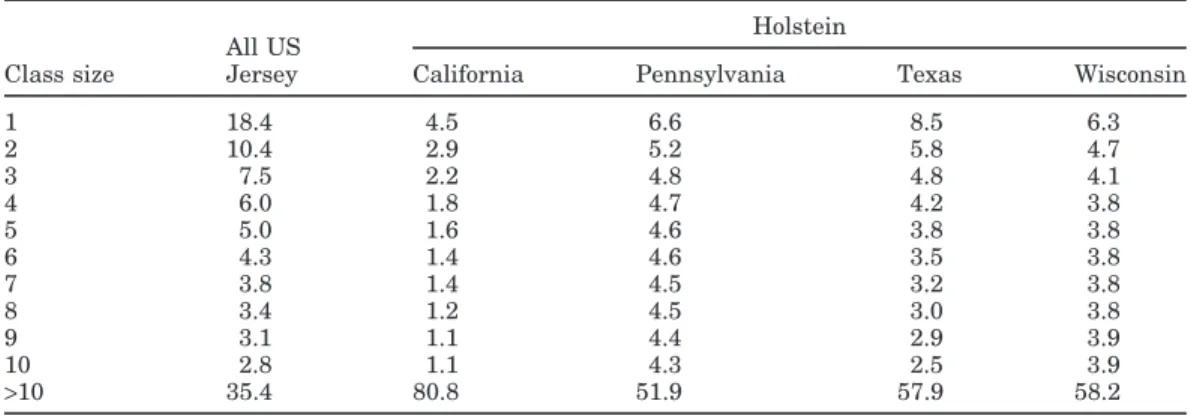
test-Table 3. Percentages of records in small lactation stage classes.
Holstein All US
Class size Jersey California Pennsylvania Texas Wisconsin
1 18.4 4.5 6.6 8.5 6.3 2 10.4 2.9 5.2 5.8 4.7 3 7.5 2.2 4.8 4.8 4.1 4 6.0 1.8 4.7 4.2 3.8 5 5.0 1.6 4.6 3.8 3.8 6 4.3 1.4 4.6 3.5 3.8 7 3.8 1.4 4.5 3.2 3.8 8 3.4 1.2 4.5 3.0 3.8 9 3.1 1.1 4.4 2.9 3.9 10 2.8 1.1 4.3 2.5 3.9 >10 35.4 80.8 51.9 57.9 58.2
day data showed that regional age adjustment was ade-quate and faster convergence was achieved when within-herd age effects were omitted.
The first test-day record for each cow was randomly assigned to one of two files. Subsequent records were then assigned alternately to each file. By this method, each cow contributed half of her test-day data to each file and most subclasses were present in both files.
Solutions for all effects were estimated from file 1. These solutions were used to estimate the milk, fat, and protein test-day yields in file 2. In this way, the data used for testing was different from the data used for estimating the solutions. Some subclasses did not exist in both files. If a test-day yield could not be pre-dicted because of missing subclasses, that test day was not used for statistical comparisons.
Prediction errors (actual minus predicted yields) were computed. The goodness of model fit was deter-mined from the mean and standard deviation of predic-tion errors. Predicpredic-tion error standard deviapredic-tion indi-cated how accurately the records in file 2 could be pre-dicted using the solutions from file 1.
Prediction precision also was investigated by herd size. Herd size was determined in each herd for each year since 1990. Herds were assigned to the following groups:<5, 5 to 10, 11 to 20, 21 to 30, 31 to 50, 51 to 100, 101 to 200, 201 to 500, 501 to 1000, 1001 to 2000, and>2000 cows. The prediction errors from the previous analysis of Wisconsin data were assigned to these herd size groups. Correlations between observed and dicted values, prediction error absolute means, and pre-diction error standard deviations were calculated.
Random regression model. Following Gengler et al. (1999), (co)variance components were estimated by expectation maximization-REML for two random re-gression models (RRM) with third-order Legendre’s polynomials (constant, linear, and quadratic) for all random effects. The first model (incomplete RRM) con-tained animal genetic regressions and animal
perma-nent environment regressions. The second model (com-plete RRM) also included within-herd (by 2-yr calving group) stage effects modeled as random regressions. As the estimation of covariance components was done by maximum likelihood and one model was a submodel of the other, likelihood ratio tests could be used.
RESULTS AND DISCUSSION Repeatability Model
Herd and class size. Average herd size and sizes of stage and age classes were evaluated to indicate the extent that solutions were regressed toward the popula-tion mean. Mean Holstein herd size in random herd subsets used for variance ratio estimation was 83 for Wisconsin, 91 for Pennsylvania, 179 for Texas, and 760 for California. For Jersey, herd size averaged 44. The highest percentage of records in small stage classes was for Holsteins in Pennsylvania where 48% of tions were in subclasses with fewer than 11 observa-tions (Table 3). Texas and Wisconsin had 42% in sub-classes with fewer than 11 observations. Because of the larger number of age classes (99 vs. 51 stage classes), a high percentage of observations in all groups was found in small age classes. For Holsteins in Wisconsin, Pennsylvania, Texas, and California, and Jerseys; 72, 63, 56, 38, and 79% of observations were in age classes with fewer than 11 observations, respectively.
Descriptive statistics. Table 4 shows mean herd averages and standard deviations of adjusted test-day yield traits (milk, fat, and protein) and SCS. These phenotypic observations were adjusted for regional en-vironmental effects, but not for the test-day class effect. Variance estimations. Analysis of the adjusted test-day data failed to detect any important differences in the effect of age on performance across herds. Within-herd age effects accounted for less than 0.1% of the total variation in yield traits and SCS. This indicates that regional adjustments for age were adequate. In a
Table 4. Adjusted herd day yield means for milk (kg), fat (kg), and protein (kg) and adjusted herd
test-day SCS in random herd samples used for variance ratio estimation.
Yield trait Breed Region Mean SEM
Milk Jersey US 19.9 4.17 Holstein California 31.6 4.56 Pennsylvania 28.9 4.19 Texas 27.4 4.64 Wisconsin 29.2 4.36 Fat Jersey US 0.9 0.19 Holstein California 1.2 0.16 Pennsylvania 1.0 0.15 Texas 1.0 0.18 Wisconsin 1.1 0.17 Protein Jersey US 0.7 0.14 Holstein California 1.0 0.13 Pennsylvania 0.9 0.13 Texas 0.8 0.14 Wisconsin 0.9 0.13 SCS Jersey US 3.3 0.91 Holstein California 3.0 0.54 Pennsylvania 3.1 0.54 Texas 3.3 0.61 Wisconsin 2.9 0.63
study by Carvalheira et al. (1998), no herd× age of cow at calving interactions were detected. A slow conver-gence rate was observed with very small variances. In some cases, convergence failed. For these reasons, the within-herd age class effect was omitted from the model for the rest of this study.
Estimates of relative variances (as a percentage of total variance) for within-herd stage effect, lactation, cow (across lactation) and genetic effects, and residual for yield traits are in Table 5. Differences in relative variances across breed and region confirm the need for separate ratio estimates for each breed or region. Within-herd variances measure the magnitude of
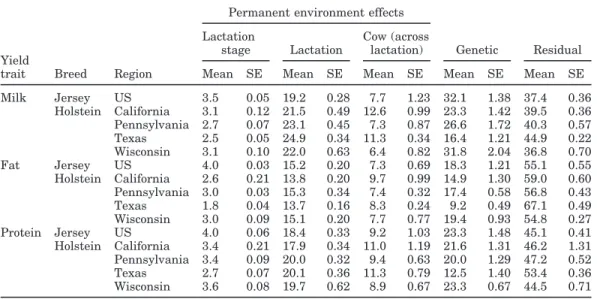
envi-Table 5. Mean variances of random effects as a percentage of phenotypic variance and approximate standard
errors.
Permanent environment effects Lactation Cow (across
stage Lactation lactation) Genetic Residual Yield
trait Breed Region Mean SE Mean SE Mean SE Mean SE Mean SE Milk Jersey US 3.5 0.05 19.2 0.28 7.7 1.23 32.1 1.38 37.4 0.36 Holstein California 3.1 0.12 21.5 0.49 12.6 0.99 23.3 1.42 39.5 0.36 Pennsylvania 2.7 0.07 23.1 0.45 7.3 0.87 26.6 1.72 40.3 0.57 Texas 2.5 0.05 24.9 0.34 11.3 0.34 16.4 1.21 44.9 0.22 Wisconsin 3.1 0.10 22.0 0.63 6.4 0.82 31.8 2.04 36.8 0.70 Fat Jersey US 4.0 0.03 15.2 0.20 7.3 0.69 18.3 1.21 55.1 0.55 Holstein California 2.6 0.21 13.8 0.20 9.7 0.99 14.9 1.30 59.0 0.60 Pennsylvania 3.0 0.03 15.3 0.34 7.4 0.32 17.4 0.58 56.8 0.43 Texas 1.8 0.04 13.7 0.16 8.3 0.24 9.2 0.49 67.1 0.49 Wisconsin 3.0 0.09 15.1 0.20 7.7 0.77 19.4 0.93 54.8 0.27 Protein Jersey US 4.0 0.06 18.4 0.33 9.2 1.03 23.3 1.48 45.1 0.41 Holstein California 3.4 0.21 17.9 0.34 11.0 1.19 21.6 1.31 46.2 1.31 Pennsylvania 3.4 0.09 20.0 0.32 9.4 0.63 20.0 1.29 47.2 0.52 Texas 2.7 0.07 20.1 0.36 11.3 0.79 12.5 1.40 53.4 0.36 Wisconsin 3.6 0.08 19.7 0.62 8.9 0.67 23.3 0.67 44.5 0.71
ronmental lactation curve differences across herd. The largest standard deviations across samples were ob-served for additive genetic relative variances. Standard deviations of Method R samples were lowest for within-herd stage effects.
Within-herd stage relative variances were in a range of 2 to 4% of the total variance across yield trait, region, and breed. The magnitude of within-herd stage class variances was very similar across yield traits. Lactation curve differences were also investigated for SCS be-tween herds. Banos and Shook (1990) reported that heritabilities for lactation mean SCS did not differ when using herd average SCS as a criterion for defining
envi-ronments. In the present study, SCS stage class relative variances of less than 0.7% were estimated. Their rela-tive variances were on average 2.6 lower than within-herd stage relative variances of yield traits, suggesting that yield lactation curves differ more consistently by herd than do SCS lactation curves. Thus, regional SCS adjustments appear adequate.
Heritabilities found in this study were lower than those currently used in the Northeast test-day model (35, 28, 31% for milk, fat, and protein, respectively; Cornell Animal Breeding Group), but agreed (except for Texas) with recent estimates from test day adjusted lactation records (Wiggans et al., 2002). In the parallel test, within-herd stage effects were eliminated from the random herd-stage model, and within- and across-lactation, additive genetic, and residual relative vari-ances were investigated. Method R was used to reestim-ate variance ratios from adjusted test-day data from Wisconsin. Comparisons were made with the results in Table 5. For milk, within-lactation relative variances decreased by 0.35%, across-lactation relative variances by 1.94%, and residual relative variances by 0.58%. An increase in additive genetic milk relative variances of 5.96% was observed as a result of model reduction. For fat, within-lactation, additive genetic and residual relative variances increased by 0.44, 1.25, and 1.57%, respectively. The across-lactation relative variance de-creased by 0.30%. Overall, increases in relative vari-ances were observed for protein (0.60% for within-lacta-tion, 0.96% for across-lactawithin-lacta-tion, 0.52% for additive ge-netic, and 1.52% for residuals). Across traits, no consistent pattern was detected. Surprisingly, the within-herd lactation stage effect was largely con-founded with the genetic component, instead of residu-als. This analysis suggests that the within-herd stage variances do not come solely from residual variances estimated in the model without herd-stage effects, but also come from genetic variance. A possible explanation is that animals in a herd are more closely related than animals across herd, therefore, some herd specific vari-ance was formerly considered genetic varivari-ance.
Goodness of fit of the repeatability model. The goodness of model fit was tested for the four Holstein regions. Prediction precision also was investigated by herd size. Prediction error standard deviations under the herd-stage and no herd-stage model were compared. The percentage of test-day records excluded because of missing solutions for specific herd effects was low: less than 1% for Texas and California, less than 4% for Wisconsin, and 5% for Pennsylvania.
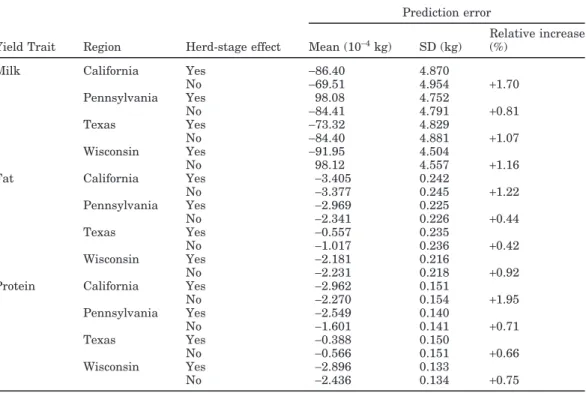
Prediction error means and standard deviations for analysis independent of herd size are in Table 6. Com-parisons of prediction error standard deviations showed that the differences between actual and predicted
val-ues were slightly smaller for the model with herd-stage than for the one without and that the model with herd-stage was superior for all regions. Predictions computed by the herd-stage model were more accurate for all traits.
Wisconsin test-day data were analyzed for differences in prediction precision by herd size. Over the 10 yr included, a continuous increase in the size of Wisconsin herds was observed. Of the 14 million test-day records collected, fewer than 0.06% were from herds with<11 cows. Herd size categories 11 to 20, 21 to 30, 31 to 50, 51 to 100, 101 to 200, 201 to 500, 501 to 1000, 1001 to 2000, and>2000 included 0.3, 0.7, 2.5, 10.7, 33.4, 42.7, 7.0, 2.4, and 0.5% of test-day data, respectively.
Differences in prediction error SD are in Figure 1. The greatest improvement from adding the herd-stage effect was for large herds (>500 cows) and herds with 11 to 20 cows. In very small herds, predictive ability of the model was greater without the herd-stage effect. Figure 2 shows the differences in correlation between predicted and observed values from models with and without the herd-stage effect. Correlation between pre-dicted and observed values is greater with the herd-stage effect for herds with>500 cows. Correlation differ-ences are similar across the middle herd sizes compared with differences in prediction error SD. This may be related to the overall trend of prediction accuracy, which was lower for large herds than for medium-sized herds. This is shown by the larger prediction error SD in Figure 3. The pattern of correlation differences may reflect relative prediction error SD differences (i.e., per-cent improvement from model enhancement).
Across herd sizes, predictive ability was lowest for fat yield, regardless of the model used for estimating solutions. Fat test-day yields seem to be more volatile throughout the lactation and, therefore, less predict-able. Low repeatability of test-day records in a lactation suggests poor prediction accuracy in a simple univari-ate repeatability test-day model.
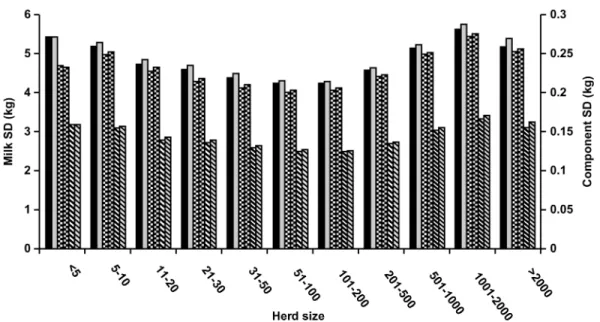
Figure 3 shows that the best model fit was achieved for medium-sized herds. With the small contemporary groups, which occur in small herds, stage solutions are regressed towards the population mean. Because the “true” solution for a very small herd might actually have deviated substantially more from that mean, pre-dictions for small herds are less accurate. Large herds frequently are split into different management groups that often have different environmental conditions (e.g., diet according to yield, housing conditions, milk-ing frequency, within herd variation in use of bST, com-puterized grain feeders). In these cases, a herd-specific lactation curve that was estimated from cows across management groups resulted in lower predictive ability for a single cow’s lactation curve. Because herdmates
Table 6. Prediction error means, standard deviations, and relative increase for Holsteins.
Prediction error
Relative increase Yield Trait Region Herd-stage effect Mean (10−4kg) SD (kg) (%)
Milk California Yes −86.40 4.870
No −69.51 4.954 +1.70 Pennsylvania Yes 98.08 4.752 No −84.41 4.791 +0.81 Texas Yes −73.32 4.829 No −84.40 4.881 +1.07 Wisconsin Yes −91.95 4.504 No 98.12 4.557 +1.16
Fat California Yes −3.405 0.242
No −3.377 0.245 +1.22 Pennsylvania Yes −2.969 0.225 No −2.341 0.226 +0.44 Texas Yes −0.557 0.235 No −1.017 0.236 +0.42 Wisconsin Yes −2.181 0.216 No −2.231 0.218 +0.92
Protein California Yes −2.962 0.151
No −2.270 0.154 +1.95 Pennsylvania Yes −2.549 0.140 No −1.601 0.141 +0.71 Texas Yes −0.388 0.150 No −0.566 0.151 +0.66 Wisconsin Yes −2.896 0.133 No −2.436 0.134 +0.75
in medium-sized herds are likely to be managed more similarly, the lactation curve for the average cow within the herd was a better fit for a single cow’s lactation curve.
In the single-trait repeatability model used in the initial stage of this study, consecutive test-day samples were assumed to be repeated observations on the same trait, and permanent environmental effects accounted for environmental similarities between different test days within and across lactations. The lactation curve was divided into 17 classes, each including 20 DIM. This model assumed that covariances between
succes-Figure 1. Differences in prediction error SD for milk (black bar),
fat (white bar), and protein (shaded bars) between the random herd-stage and the fixed herd-stage models in Wisconsin data, by herd size.
sive test days were equal to those between test days that were far apart. Because a cow’s lactation is a bio-logically continuous process, the correlation between repeated records gradually changes with time. A multi-trait model that considers yields on each test day as a highly correlated but separate trait allows for relax-ation of the assumption of constant variances and co-variances throughout the lactation but is highly over parameterized. A more appealing choice is a random regression or random coefficient model that assumes similar covariance structures with fewer parameters.
Figure 2. Differences in correlation between the random
herd-stage and the fixed herd-stage models for milk (solid bar), fat (white bar), and protein (shaded bars) in Wisconsin data by herd size.
Figure 3. Prediction error SD with random within-herd lactation stage effects and with fixed lactation stage effects for milk (random,
solid black bar; fixed, solid gray bar), fat (random, black and white check pattern; fixed, gray and black check pattern), and protein (random, black and white horizontal bar; fixed, gray and black horizontal bar), in Wisconsin data, by herd size for the random herd-stage and fixed stage models.
Random Regression Models
Table 7 shows the results from the likelihood ratio tests. The complete models in all cases significantly improved the likelihood. This table also shows that the increase in 2log-likelihood was clearly higher for milk, fat, and protein than for SCS.
Phenotypic variances estimated for milk yield for the three levels of herd production are given in Figure 4. Phenotypic variances were very stable for cows in me-dium and low producing herds, showing the expected increase at the beginning and the end of the lactation. High producing herds had a higher variance, especially at the end of the lactation. Estimates were nearly iden-tical for both models.
Figures 5 and 6 show the effect on heritabilities of including the random herd lactation curve effect in the RRM. In the incomplete RRM (Figure 5), heritabilities for milk yield show an unlikely increase at the
begin-Table 7. Likelihood ratio test results for milk, fat, protein and somatic
cell scores, complete versus incomplete random regression models with DF= 6 (all highly significant P < 0.01).
Herd production level
High Medium Low
Milk 580 879 771
Fat 467 706 428
Protein 714 879 769
SCS 74 77 75
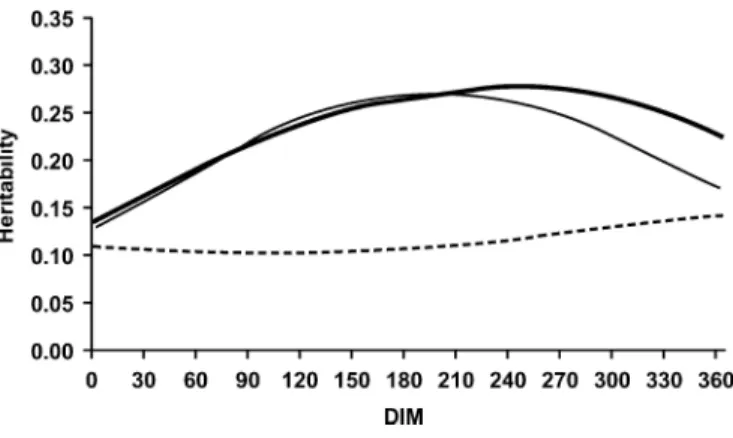
ning of the lactation. This has been reported by Jam-rozik et al. (1997) and Strabel and Misztal (1999). Fig-ure 6 indicates that this increase and the steep increase in heritability for low producing herds in late-lactation stages are nearly eliminated by the introduction of the random herd lactation curve effect.
The random herd-stage effect variance is highest at the beginning of lactation (Figure 7). This suggests that the heritabilities for early-lactation milk yield from the
Figure 4. Phenotypic variances by DIM for incomplete and
com-plete random regression models (RRM) at high (incomcom-plete RRM [—], complete RRM [—]), medium (incomplete RRM [+], complete RRM [▲]), and low (incomplete RRM [×], complete RRM [•]) herd production levels.
Figure 5. Heritabilities for milk yields by DIM from the incomplete
random regression model for low (– –), medium (—), and high (—) producing herds.
incomplete RRM are inflated by including variance, which is assigned to the random herd-stage effect in the complete RRM. These results support those found with the repeatability model.
Results for fat and protein were similar. For SCS, the variance associated with the herd-stage effect never exceeded 5%. Given the results obtained in the likeli-hood ratio tests, this small effect of SCS was expected. The herd-stage effect obtained most of its variance from the genetic effect. As suggested for the repeatabil-ity model, the most likely explanation for the redirec-tion of variance in the complete RRM is that the incom-plete RRM partitions some environmental variance as genetic. This could be an artifact of the fact that the additive relationship within a herd is much higher than between herds, thereby confounding a common herd environmental effect that is not modeled with the addi-tive genetic one.
Figure 6. Heritabilities for milk yields by DIM from the complete
random regression model for low (– –), medium (—), and high (—) producing herds.
Figure 7. Relative variances of random regression herd-stage
ef-fects by DIM for milk yields in low (– –), medium (—), and high (—) producing herds.
CONCLUSIONS
The herd-stage relative variances estimated from test-day data that were previously adjusted for age, stage, and pregnancy effects, calculated across herds were relatively large for yield traits. This indicates that national or regional adjustments did not explain all the lactation stage variation not due to cow. Model compari-sons demonstrated the greater explanatory power of the herd-stage model. A model without the herd-stage effect had greater prediction error standard deviations. Accounting for herd-stage effects should increase the accuracy of genetic evaluations. The benefit is expected to be greatest when comparing cows with different lengths of lactation whose records have not been af-fected by the same stages. Estimation of (co)variances associated with random regression herd lactation curves showed that this herd-stage effect variance came from the genetic, not the environmental effect, as ex-pected before this study. Inclusion of this variance in the genetic variance component was the likely cause of inflated heritabilities in early lactation associated with previous models.
ACKNOWLEDGMENTS
Nicolas Gengler, who is Chercheur Qualifie´, and Tom Druet, who is Charge´ de Recherches, acknowledge their financial support from the National Fund for Scientific Research, Brussels, Belgium. The authors thank J. C. Philpot, A. H. Sanders, and L. L. Melton, Animal Im-provement Programs Laboratory, ARS, USDA, Belts-ville, MD, for their assistance.
REFERENCES
Animal Breeding Group, Animal Science Department, Cornell Uni-versity. 1999. AI Bull Census. Online. Accessed Dec. 10, 2000.
Banos, G., and G. E. Shook. 1990. Genotype by environment interac-tion and genetic correlainterac-tion among parities for somatic cell count and milk yield. J. Dairy Sci. 73:2563–2573.
Bauman, D. E., R. W. Everett, W. H. Weiland, and R. J. Collier. 1999. Production responses to bovine somatotropin in Northeast dairy herds. J. Dairy Sci. 82:2564–2573.
Bormann, J., G. R. Wiggans, J. C. Philpot, T. Druet, and N. Gengler. 2002. Estimating effects of permanent environment, lactation stage, age, and pregnancy on test-day yield. J. Dairy Sci. 85:263. Carvalheira, J. G. V., R. W. Blake, E. J. Pollak, R. L. Quaas, and C. V. Duran-Castro. 1998. Application of an autoregressive process to estimate genetic parameters and breeding values for daily milk yield in a tropical herd of Lucerna cattle and in United States Holstein herds. J. Dairy Sci. 81:2738–2751.
Druet, T., J. So¨lkner, A. F. Groen, and N. Gengler. 2001. Additive and dominance genetic variance of fertility by Method R and preconditioned conjugate gradient. J. Dairy Sci. 84:987. Everett, R. W., F. Schmitz, and L. H. Wadell. 1994. A test-day model
for monitoring management and genetics in dairy cattle. J. Dairy Sci. 77(Suppl. 1):267. (Abstr.)
Gengler, N., A. Tijani, G. R. Wiggans, and I. Misztal. 1999. Estimation of (co)variance function coefficients for test day yield with a expec-tation-maximization restricted maximum likelihood algorithm. J. Dairy Sci. 82:1849.
Gengler, N., A. Tijani, and G. R. Wiggans. 2000. Use of sequential estimation of regressions and effects on regressions to solve large multitrait test-day models. J. Dairy Sci. 83:369.
Gengler, N., and G. R. Wiggans. 2002. Adjustment for heterogeneous genetic and non-genetic (co)variance structures in test-day mod-els using a transformation on random regression effect regressors. Proc. Interbull Annual Mtg. Inter. Bull Eval. Serv. Bull No. 29:79–83.
Guo, Z., and H. H. Swalve. 1997. Comparison of different lactation curve sub-models in test day models. Interbull Bull. No. 16:75–79. Jamrozik, J., G. J. Kistemaker, J. C. M. Dekkers, and L. R. Schaeffer. 1997. Comparison of possible covariates for use in a random
re-gression model for analyses of test day yields. J. Dairy Sci. 80:2550–2556.
Jamrozik, J., and L. R. Schaeffer. 1997. Estimates of genetic parame-ters for a test day model with random regressions for yield traits of first lactation Holsteins. J. Dairy Sci. 80:762–770.
Kachman, S. D., and R. W. Everett. 1989. Test day model with individ-ual herd correction factors. J. Dairy Sci. 72(Suppl. 1):60. (Abstr.) Liu, Z., J. Jamrozik, and G. Jansen. 1998. A comparison of fixed and random regression models applied to dairy test day production data. Interbull Bull. No. 17:60:63.
Pool, M. H., and T. H. E. Meuwissen. 1999. Prediction of daily milk yields from a limited number of test days using test day models. J. Dairy Sci. 82:1555–1564.
Ptak, E., and L. R. Schaeffer. 1993. Use of test day yields for genetic evaluation of dairy sires and cows. Livest. Prod. Sci. 34:23–34. Strabel, T., and I. Misztal. 1999. Genetic parameters for first and
second lactation milk yields of Polish black and white cattle with random regression test-day models. J. Dairy Sci. 82:2805–2810. Reverter, A., B. L. Golden, R. M. Bourdon, and J. S. Brinks. 1994. Method R variance components procedure: Application on the simple breeding value model. J. Anim. Sci. 72:2247–2253. Stanton, T. L., L. R. Jones, R. W. Everett, and S. D. Kachman. 1992.
Estimating milk, fat, and protein lactation curves with a test day model. J. Dairy Sci. 75:1691–1700.
Van Bebber, J., N. Reinsch, W. Junge, and E. Kalm. 1999. Monitoring daily milk yields with a recursive test day repeatability model (Kalman Filter). J. Dairy Sci. 82:2421–2429.
Veerkamp, R. F., and M. E. Goddard. 1998. Covariance functions across herd production levels for test day records on milk, fat, and protein yields. J. Dairy Sci. 81:1690–1701.
Wiggans, G. R., and M. E. Goddard. 1997. A computationally feasible test day model for genetic evaluation of yield traits in the United States. J. Dairy Sci. 80:1795–1800.
Wiggans, G. R., P. M. VanRaden, J. Bormann, J. C. Philpot, T. Druet, and N. Gengler. 2002. Deriving lactation yields from test day yields adjusted for effects of lactation stage, age, pregnancy, and test day class. J. Dairy Sci. 85:264.