HAL Id: hal-02375768
https://hal-amu.archives-ouvertes.fr/hal-02375768
Submitted on 22 Nov 2019
HAL is a multi-disciplinary open access archive for the deposit and dissemination of sci-entific research documents, whether they are pub-lished or not. The documents may come from teaching and research institutions in France or abroad, or from public or private research centers.
L’archive ouverte pluridisciplinaire HAL, est destinée au dépôt et à la diffusion de documents scientifiques de niveau recherche, publiés ou non, émanant des établissements d’enseignement et de recherche français ou étrangers, des laboratoires publics ou privés.
Negative-ion surface production in hydrogen plasmas:
Determination of the negative-ion energy and angle
distribution function using mass spectrometry
J. Dubois, K. Achkasov, D. Kogut, A. Ahmad, J. Layet, A. Simonin, Gilles
Cartry
To cite this version:
J. Dubois, K. Achkasov, D. Kogut, A. Ahmad, J. Layet, et al.. Negative-ion surface production in hy-drogen plasmas: Determination of the negative-ion energy and angle distribution function using mass spectrometry. Journal of Applied Physics, American Institute of Physics, 2016, 119 (19), pp.193301. �10.1063/1.4948949�. �hal-02375768�
1
Negative-ion surface production in hydrogen plasmas:
determination of the negative-ion energy and angle
distribution function using mass spectrometry
J. P. J. Dubois1, K. Achkasov1,2, D. Kogut1, A. Ahmad1, J. M. Layet1, A. Simonin2, G.
Cartry1
1Aix-Marseille University, CNRS, PIIM, UMR 7345, 13013 Marseille, France 2CEA, IRFM, F-13108 Saint-Paul-lez-Durance, France
Abstract
This work focuses on the understanding of the production mechanism of negative-ions on surface in low pressure plasmas of H2/D2. The negative ions are produced on a HOPG sample (Highly Oriented Pyrolitic Graphite) negatively biased with respect to plasma potential. The negative ions created under the positive ion bombardment are accelerated towards the plasma, self-extracted and detected according to their energy and mass by a mass spectrometer placed in front of the sample. The shape of the measured Negative-Ion Energy Distribution Function (NIEDF) strongly differs from the NIEDF of the ions emitted by the sample because of the limited acceptance angle of the mass spectrometer. To get information on the production mechanisms, we propose a method to obtain the distribution functions in energy and angle (NIEADFs) of the negative-ions emitted by the sample. It is based on an a priori determination of the NIEADF and on an a posteriori validation of the choice by comparison of the modelled and experimental NIEDFs.
2
1. Introduction
Negative-ion (NI) production in low-pressure plasma has many applications and is studied in various areas, such as microelectronics1,2,3,4,5,6, magnetically confined fusion7,8, space propulsion9,10,11 and sources for particle accelerators12,13,14. NI in low pressure plasmas are usually created by dissociative attachment of electrons on molecules (volume production)15,16,17, but they can also be created on surfaces by the bombardment of positive ions or hyperthermal neutrals18,19,20,21,22,23,24. Volume-produced NI sources are mainly used in microelectronic 1,2,3,4,5,6 and space propulsion applications9,10,11 while surface production of NI is employed in magnetically confined fusion devices7,8 and sources for particle accelerators12,13,14. Surface production of negative-ions is also observed in sputtering processes as shown in 25,26,27.
In magnetically-confined fusion devices (tokamaks), NI can be used to generate a fast neutral beam through interaction with a stripping gas target; such beam is used to heat the plasma and to implement the current drive. Given the huge dimensions of the ITER device and its successor DEMO, neutral beam energies in the range of 1–2 MeV are required; at these energies the neutralization of positive ions becomes very inefficient. Indeed, the yield of neutralization of the positive ions by a D2 gas tends to zero above 100 keV, while its value is around 55% at 1 MeV for NI28. Therefore, there is a great research effort dedicated to the development of a high current NI source (50A D– beam for ITER)29,30,31,32,33,34,35,36,37. This source uses cesium injection inside the plasma in order to increase strongly the NI extracted current38,39,40. However, as the use of cesium complicates noticeably the neutral beam injection device, there is a demand for the development of cesium-free NI sources in H2/D2 plasmas41 or for the reduction of the cesium consumption in fusion negative-ion sources42. Several papers dedicated to this subject have been recently published19,42,43,44, 45,46,47,48,49. In the present paper, we are pursuing our studies on NI surface production in cesium-free low-pressure H2/D2 plasmas.
In our experimental set-up47 a sample is introduced in the plasma and negatively biased with respect to the plasma potential. The negative ions formed on the surface are accelerated by the sheath in front of the sample and self-extracted on the other side of the plasma towards a mass spectrometer. Negative ions are detected according to their energy and mass and Negative-Ion Energy Distribution Function (NIEDF) is measured. HOPG (Highly Oriented Pyrolitic Graphite) has been chosen as a reference material for the study, because of its high yield of production of negative-ions and because of its simplicity to cleave and clean. In order to gain an insight on the mechanisms of the NI surface production, it is important to analyze and characterize the shapes of the measured NIEDFs.
It has been shown that the measured NIEDFs strongly differ from those of the ions emitted by the sample surface because of the limited acceptance angle of the mass spectrometer47. Furthermore, the measurements provide only information about energy and mass of the negative ions, and no information is obtained concerning their angle of emission from the surface. To get information on the production mechanisms, it is mandatory to determine the distribution functions in energy and angle of the negative-ions (NIEADFs) emitted by the sample. A model has been developed to obtain the NIEADFs earlier47. The
3
principle was to choose a priori the NIEADF f(E, and to compute NIEDF from the chosen NIEADF. The good agreement between the NIEDFs measured by the mass spectrometer and the modelled ones allowed us to validate the choice of the chosen NIEADF. However, it was shown that only few ions among all the emitted ones are collected by the mass spectrometer (5% of collection), hence a good agreement between the model and the experiment only validated the choice of a small part of the NIEADF. Indeed, because of the low acceptance angle of the mass spectrometer, only ions emitted at small angles with respect to the axis of the mass spectrometer can be collected. In the present paper NIEDFs are measured for different tilt angles of the sample, allowing the collection of ions emitted from the surface at any angle and energy. The corresponding NIEDFs are then computed using the chosen NIEADF and compared to the experimental ones in order to further validate the choice of the NIEADF.
The paper is organized in three parts. In the first one, the experimental set-up is briefly described. The second part is dedicated to the improvement of the model developed previously47, which allows taking into account a tilt of the sample with respect to the mass spectrometer axis. In the last part the computed NIEDFs are presented and compared to the experiments. Finally, the other outputs of the model are presented and discussed.
2. Experimental set-up
The reactor, diagnostic instruments and plasma conditions used were described in detail elsewhere47. The measurements are performed in a helicon reactor consisting of an upper cylindrical source chamber (Pyrex tube, 360 mm long and 150 mm diameter) and a lower spherical diffusion chamber (stainless steel chamber, radius 100 mm). The plasma is created in the source chamber by an external antenna surrounding the Pyrex tube and connected to a 13.56 MHz RF generator. The HOPG sample is inserted in the diffusion chamber. Its surface exposed to the plasma is a disc of 8 mm in diameter facing the mass spectrometer nozzle located at 37 mm away. The mass spectrometer axis passes through the center of the sample and the latter can be rotated in the direction perpendicular to this axis (Figure 1). It has been found that the rotation of the sample strongly reduces the intensity of the recorded NIEDFs. Increasing the RF power applied to the plasma to increase both the positive-ion flux and the resulting NI flux is not a satisfying solution since it also increases the RF oscillations of the plasma potential, perturbing the measurements. Therefore, instead of the RF source used in a capacitive mode to generate the plasma, an ECR source (Electron Cyclotron Resonance) from Boreal Plasma was installed in the diffusion chamber, 5 cm away from the sample. The ECR source was operated at 2.45 GHz, which gives electron resonance for a B field of 845 Gauss (such value is reached less than one centimeter away from the magnet). A more detailed description of the ECR source can be found in 16. The plasma density was increased by one order of magnitude and the RF fluctuations problem was avoided. It has been checked that NIEDF shapes are not affected by the magnetic field of the ECR source, which is around 50 gauss at the sample surface. In addition, the orifice diameter in the mass spectrometer nozzle has been increased from 35 µm to 100 µm. This leads to an increase of the signal by a factor ~10. Moreover, the clamping part of the sample holder (see Figure 1 in 47) has been made much thinner (0.1 mm) improving measurements at high tilt angle when the signal is low.
4
Measurements were performed at 1 Pa H2 and 60 W of injected power. The plasma density, as measured by Langmuir probe, is 2.5·1015 m-3, the electron temperature is 1 eV and the plasma potential is 7 V. The positive ion flux composition is determined by mass spectrometry. H3+ flux represents around 75 % of the total ion flux, H2+ flux around 14% and H+ 11%. As explained in 19, due to the variation of the transmission probability of the mass spectrometer, this is only an estimation of the ion fractions, which can vary by few percent depending on the mass spectrometer tuning. The sample was biased to Vs = -130 V leading to the dominant positive ion impact energy of 45 eV per proton. The energy of H- ions entering the plasma is between 130 eV (ion created at rest on the surface) and 175 eV (ion created with initial energy of 45 eV, see Figure 2). In this energy range the electron detachment cross section (H- + H
2) is between 5.3·10-20 and 5.9·10-20 m2 50, giving a mean free path for negative-ion detachment in the range of 70–80 mm. As the distance between the sample and the mass spectrometer is 37 mm, this leads to a loss of around 40% of the ion flux. However, as the detachment cross section is largely dominating over other processes (such as momentum transfer50), and because detachment cross section is not varying too much (from 5.3·10-20 to 5.9·10-20 m2), this does not affect the NIEDF shape as demonstrated previously46.
Figure 1. Sketches of the NI trajectory between the sample surface and the mass spectrometer for the tilt angle α = 0 (a) and α ≠ 0 (b). The figure is not on scale, the sample size is enlarged.
(a)
(b)
X
Y’=Y (Rotation axis)
Sheath 2 Sheath 1 Spectrometer Plasma Z X'
α
𝜃
𝑀𝑆𝑣
𝑀𝑆𝑣
𝑖𝜃
𝑖 Z’ X Z Sample Surface Sheath 2 Sheath 1 Spectrometer Plasma𝜃
𝑀𝑆𝑣
𝑀𝑆𝜃
𝑖𝑣
𝑖 Y (Rotation axis) Deviation 3 7 mm Spectrometer nozzle: Ø40 mm (not on scale) Ø 8 mm (not on scale)5
3. Modelling
As explained in the introduction, a model has been previously developed to obtain the NIEADF on the sample from the NIEDF measured by the mass spectrometer. The principle is to choose a priori the NIEADFs f(E, and to validate a posteriori this choice. In this model the NI trajectories between the sample and the mass spectrometer are computed based on their energy and angle of emission. All ions missing the entrance of the mass spectrometer or arriving to it with an angle θMS higher than the acceptance angle θaa are eliminated from the calculations (Figure 1). The energy and angle distribution of the remaining ions is labelled f’(E,). The transmission probability of the ions passing through the mass spectrometer itself is calculated using the SIMION software51. The energy distribution function of the ions collected by the mass spectrometer f”(E) is obtained by summing up all the ions over the angles weighted by their transmission probability at a given angle and energy. This NIEDF is then compared with the experimental one to validate the choice of f(E,, and if required the method is iterated. In our previous paper47 we have shown that the distribution f’(E) at the mass spectrometer nozzle is not strongly different from the distribution at the mass spectrometer detector f”(E). Therefore, in order to speed up the calculations, only f’(E) is considered in the present paper.
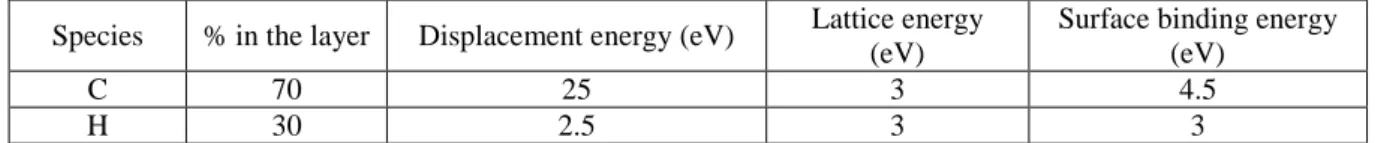
In previous papers we have shown that the negative-ions are formed by the backscattering of positive ions as NI and by the sputtering of adsorbed hydrogen (deuterium) atoms as NI19,43,44. The energy and angular distribution of backscattered and sputtered particles computed by the SRIM code52 has been chosen as the initial NIEADF f(E,. As SRIM does not take into account the surface ionization, this choice implicitly assumes that the surface ionization probability is independent of the angle and energy of the particles emitted. On metals, the ionization probability is usually dependent on the outgoing velocity53,54,55,56,57. Assuming a constant ionization probability is a strong assumption that has been largely discussed previously47. Positive ions impacting the surface have been divided in the modelling in three groups corresponding to the three ion types observed experimentally: H3+, H2+, H+. To take into account molecular ion dissociation at impact, the H3+ ion is modelled by proton impact at one third of H3+ energy with a flux three times higher than the H3+ one (3 protons at 45 eV for each H3+ impact). In the same way, H2+ is modelled by the impact of protons at half the H2+ energy and twice the H2+ flux (2 protons at 67 eV for each H2+ impact). The sample material is assumed to be an amorphous a-C:H layer (30% H), since the graphite surface exposed to plasma is subjected to hydrogen implantation and defect creation in the subsurface layer, which has been confirmed by Raman spectroscopy measurements45,46. The parameters of the SRIM calculation are listed elsewhere48 and reminded in Table 1. 107 incident positive ions have been used in these calculations yielding in ~2·106 H particles emitted from the surface, including backscattered and sputtered ones. The acceptance angle aa as computed by SIMION is 1° with the present mass spectrometer settings.
6
Species % in the layer Displacement energy (eV) Lattice energy (eV)
Surface binding energy (eV)
C 70 25 3 4.5
H 30 2.5 3 3
Table 1: Parameters used for the SRIM calculations. a-C:H layer is modelled with a density of 2.2 g/cm3. The
type of calculation used is “Surface sputtering / Monolayer Collision Steps”. 107 proton impacts with
incidence angle of 0° (with respect to the sample normal) are simulated. The impact energies are given in the text.
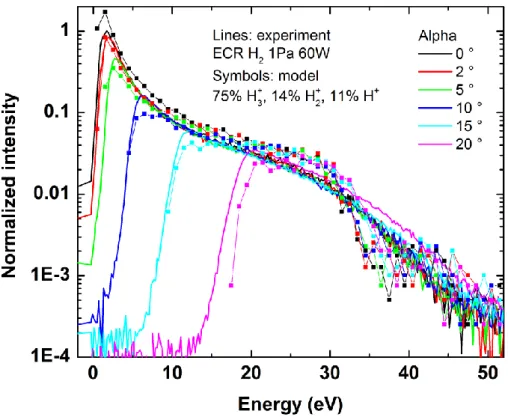
Figure 2 shows a comparison between the measured (black) and the computed (red for the case of 100% H3+ or blue for the case of 75% H3+, 14% H2+, 11% H+) NIEDFs in the ECR plasma. When the three populations of positive ions are taken into account, the model reproduces quite well the shape of the NIEDF, which presents a main peak at low-energy (0– 10 eV), a tail with a slight decreasing slope at intermediate energy (10–30 eV) and a slope breaking around 30 eV followed by the high energy tail. In case when only the H3+ ion flux, which is dominating under the present experimental conditions, is considered, the measured distribution is globally well fitted by the model with the exception of the high-energy tail (above 30 eV). It is due to the fact that only H2+ and H+ ions with higher energy per proton can contribute to the formation of negative-ions with such high energy (see considerations on the maximum H- energy in 19). Let us note however that the modelling with H3+ positive ion only gives a good agreement for 95% of the negative-ion population (only few negative-ions have energy higher than 35 eV). Finally, Figure 2 demonstrates that only a part of the emitted ions is collected by the mass-spectrometer: the distribution function of the collected ions f’(E), shown with empty symbols, differs strongly from the distribution function of the emitted ions f(E), shown with filled symbols.
7
Figure 2. Comparison between the calculated energy distribution function f ’(E) of the negative ions collected by the mass spectrometer (empty symbols) and the experimental one (black line) obtained at 1 Pa, 60 W with the ECR source. Red circle correspond to the case of 100% H3+, blue squares to the case of 75% H3+, 14% H2+
and 11% H+. The energy distribution functions of ions on the sample f(E) calculated by SRIM and used as input
in the model are shown with filled symbols. All NIEDFs are normalized to the peak value.
Figure 3. Left: normalized angular distributions f(θ) of ions leaving the sample surface, either given by SRIM (red) or artificial (blue and magenta). Right: corresponding energy distribution functions of the collected NI f’(E) given by the model (empty symbols) compared to the experimental curve (black). The input of the model is the same f(E) for all cases, as given by SRIM when onlyH3+ is considered (filled red symbols). All NIEDFs are normalized to the peak value.
Left: normalized angular distributions f(θ) of ions leaving the sample surface, either given by SRIM (red) or artificial (blue and magenta). Right: corresponding energy distribution functions of the collected NI f’(E) given by the model (empty symbols) compared to the
8
experimental curve (black). The input of the model is the same f(E) for all cases, as given by SRIM when only H3+ is considered (filled red symbols). All NIEDFs are normalized to the peak value.Figure 3 demonstrates the sensitivity of the modelled NIEDF f’(E) to the input angular distribution f(θ) of ions leaving the sample surface. As it will be shown in the following section, only the ions with polar angle of emission θ close to zero can be collected when the sample is perpendicular to the mass spectrometer axis. Artificial shift of f(θ) given by SRIM towards θ = 0 favors collection of NI in the whole range of energies (see blue curves on the left and on the right), while shifting f(θ) to 90° leads to a considerable decrease of collection at higher energies (magenta curves). Therefore, the shape of the resulting f’(E) is highly sensitive to the assumed f(E,θ) at the sample surface and can be used to validate a priori the choice of f(E,θ).
The sheaths in front of the sample and in front of the mass spectrometer can be considered planar in our experimental conditions47 so that the electric field vector is reduced to one component in the X direction (Figure 1). Indeed, the sheath thickness is 4.5 mm while the 8 mm diameter sample is placed at the centre of a 20 mm × 35 mm surface defined by the clamp size. As this surface is much larger than the sheath size we can assume that sheath edge effects concern only the clamp edges and not the sample. Furthermore, as the clamp has been made very thin (0.1 mm), we can consider that the sheath is planar above the whole surface of the sample. Same reasoning shows that the sheath in front of the mass spectrometer nozzle can also be considered as planar. The potential variation along the X axis in the sheaths is calculated from the Child Langmuir law. Then a simple calculation of the ion trajectories in the sheath can be done. The input parameters for the trajectory calculations, such as the electron density, the electron temperature, the plasma potential and the applied surface bias which allow the computation of the sheath potential, are taken from the experiment (see section 2, “Experimental set-up”). These parameters correspond to the ECR H2 plasma at 1 Pa and 60 W. These calculations have already been detailed in the previous paper47 for the sample perpendicular to the mass spectrometer axis. The same method is used here for a tilted sample. Each NI ejected from the surface is characterized by its kinetic energy E and the angles of emission: polar angle and azimuth angle in spherical coordinate system associated with the sample surface. The distribution in E, is taken from the SRIM calculations; note that the negative ions are emitted with a uniform distribution in . α is the tilt angle between the normal of the sample and the mass spectrometer axis. For α = 0° there is a cylindrical symmetry around the mass spectrometer axis, and the angle has no importance in the calculations. For α ≠ 0° there is no more symmetry and the angle matters. Two output values are mandatory to determine if an ion can be collected by the mass spectrometer:
i) the arrival angle MS of the negative ion at the mass spectrometer entrance. This angle is compared to the mass spectrometer acceptance angle aa determined by the SIMION simulations. The ion is eliminated from the simulation if MS is higher than aa.
ii) the lateral deviation, which is the distance in the YZ plane (plane perpendicular to the mass spectrometer axis, see Figure 1) between the starting location of the negative ion on the sample and its arrival location in the plane of the mass spectrometer. When the sample is not tilted, the lateral deviation must be lower than the sample radius (4 mm) otherwise the ion is eliminated
9
from the calculation. Indeed, an ion emitted from the sample surface cannot reach the mass spectrometer entrance hole if it is laterally deviated by more than 4 mm. When the sample is tilted, the deviation must verify the equation (𝐷𝑒𝑣𝑦
𝑅 )
2+ ( 𝐷𝑒𝑣𝑧
𝑅 𝑐𝑜𝑠𝛼)
2 ≤ 1 where Devy and Devz are the deviation components in the YZ plane, R is the sample radius. This relation describes an ellipse which is the projection of the sample surface (disc) in the plane perpendicular to the mass spectrometer nozzle.
4. Results and discussion
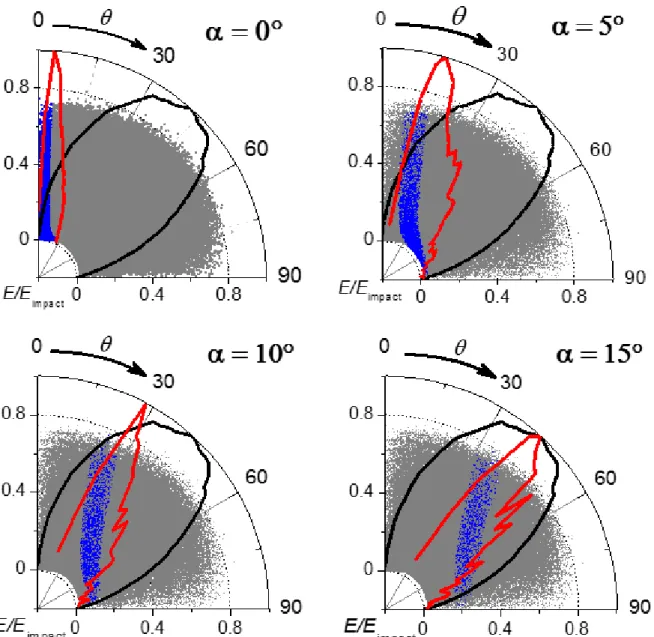
As it is mentioned above, only the negative ions with certain energies and angles of emission can be detected by the mass-spectrometer; the accepted energies and angles vary with the tilt of the sample α. This is illustrated by Figure 4 which shows polar plots of emitted NI (grey dots) and collected NI (blue dots) for different α. The radial position gives the NI emission energy normalized to the impact energy Eimpact = 45 eV of the impinging positive ions (only H3+ ions are considered in this calculation). The angular position gives the emission angle of a NI with respect to the normal of the sample. Angle and energy of emission are obtained from the SRIM calculations (emitted ions) and from the modelling (collected ions). The normalized angular distribution of either emitted NI (black line) or collected NI (red line) is also shown in Figure 4.
The maximum of the emitted NI distribution is always at θ = 45°, however the maximum of the collected NI distribution depends on α; for example, at α = 0° it is located at θ = 4°, although the range of collection extends up to θ = 27°. It may be explained by the fact that the ions emitted from the surface with small angles and energies have trajectories which are easily rectified by the electric field present in the sheaths; hence, NI arrive to the mass spectrometer entrance with the angle θMS < θaa and are collected. The trajectories of the ions emitted at high energies are not rectified efficiently unless θ is close to 0°. Hence in the experiment one favors the collection of NI emitted with small angles θ and/or small energies at α = 0°.
When the sample is tilted, the collected ions come from a different part of the initial distribution f(E,θ). This may be observed in Figure 4 where the polar plots for α = 5°, 10°, 15° show the shift of the maximum of the angular distribution of the collected NI to higher θ. Therefore, by tilting the sample it is possible to collect the NI of all emission angles and energies. It is important to note that the whole distribution of emitted ions is scanned (not shown here) when using α angles from 0° to 30° in the case of proton impact at 45 eV (H3+ impacting on the surface at 135 eV).
10
The NIEDFs from the experiment and the model are compared for different tilt angles of the sample from 0° to 20° in Figure 5. The peak of the NIEDF measured at α = 0° is normalized to unity, and the NIEDFs measured at other tilt angles are normalized accordingly. The peak of the distribution computed for α = 2° is normalized to the experimental one measured at α = 2° and the other computed distribution are normalized accordingly. This choice (normalization at α = 2° rather than at α = 0°) is discussed below.
The shapes of the distributions at any alpha angle are well reproduced by the model. When α increases, the energy onset of the distribution shifts to higher energies. These shifts in the measured NIEDFs are reproduced by the model. The global experimental intensities are decreasing with α and this decrease is also well reproduced by the model with one exception at
Figure 4. The polar plots of NI emitted from HOPG surface (f (E,θ), grey dots, from SRIM calculations) and NI collected by the mass-spectrometer (f’(E,θ), blue dots) as given by the model for different angles α of the sample tilt. The surface bias is Vs = -130 V. The radial position gives the negative-ion emission energy normalized to
the impact energy of the positive ions Eimpact = 45 eV. Black line is the normalized angular distribution of the
emitted negative ions. Red line is the normalized angular distribution of the collected negative ions. Input parameters of the modelling correspond to the situation of an ECR H2 plasma at 1 Pa, 60 W, Vs = -130 V.
11
α = 0° (see the discussion below). The distributions measured at different alpha always superimpose with the tails of the previous ones. This is also reproduced by the model. The agreement between the experiment and the calculation is good enough to conclude that the improved model can be used to simulate the trajectories with a tilted sample. It validates the use of the distribution function f(E,θ) calculated by SRIM for all the values of energy and angle of the emitted NI. Up to now this choice was validated for small angles only since at α = 0° only ions emitted at small angles are collected47 (Figure 4). Thus, for HOPG, the surface-produced NI distribution can be approximated by the distribution of neutrals calculated by SRIM with the parameters listed above.
One can notice that the variations in the distribution intensity with α is well reproduced by the model except for α = 0°. For α = 0°, the intensity calculated by the model is higher than the experimental one. In other words, the drop in intensity between α = 0° (symmetrical situation) and α 0° (non-symmetrical situation) predicted by the modelling is observed in the experiment but is less important than expected. We have no explanation at the moment. It could arise from imperfect determination of the angle α = 0° in the experiment. Further studies are required to clarify this point. Let us note that the normalization between model and experiment for α = 0° (as done on Figure 2) would have given modelled NIEDFs with lower intensity than the experimental ones for all angles α > 0 °.
The decrease of the NIEDF peak intensity with the growth of α can be understood by simple geometrical considerations. For α = 0° there is a cylindrical symmetry around the mass spectrometer axis. The criteria of collection of an ion by the mass spectrometer only depends on E and , there is no restriction on The ions collected for a given (E,originate from a circle on the sample, i.e. ∈ [0:2π]. When the symmetry is broken (α ≠ 0°), only a part of the
Figure 5. Comparison of the experimental NIEDF (solid lines) with the modelled ones (symbols) for different tilts of the sample (from α = 0° to 20°, with a step of 5°). ECR H2 plasma 1 Pa, 60 W, Vs = -130 V.
12
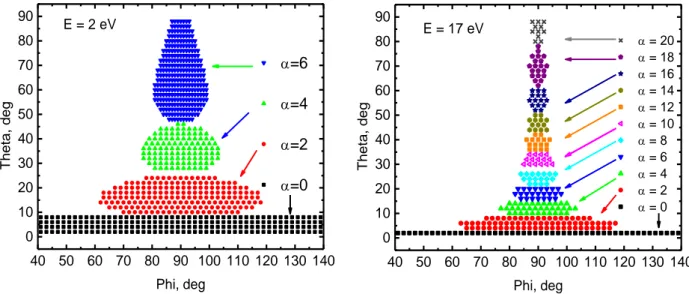
distribution in is collected, so the signal strongly decreases. In order to illustrate this, the following calculation was performed. A distribution of ions emitted from the surface was created, each ion having a unique combination of E, θ and φ with E, θ and φ distributed uniformly (from 0 to 50 eV, 0 to 90°, 0 to 180° correspondingly). Transmission of these ions in the plasma was calculated by the model for different α. As a result, one could construct the distribution f’(θ, φ) for each energy individually from calculations for different sample tilts α. Two examples of f’(θ, φ) are shown in Figure 6: for E = 2 eV on the left and for 17 eV on the right. Each dot in Figure 6 corresponds to an ion and its color indicates the tilt angle α at which this ion can be measured. One can see that the measured range of φ is strongly reduced for higher energies and/or higher α and θ. One can also note that the minimum number of different sample tilts α, which has to be measured to cover the total range of θ at a given energy, increases with energy.
The fact that at higher values of α the angular distribution of the collected NI shifts to higher θ (Figure 4, Figure 6) has an important consequence. It has been shown before that NI originate from both sputtered and backscattered particles from the sample surface induced by the positive ion bombardment and the angular emission yield is strongly dependent on the process considered48. The emission yield for sputtered particles shows a maximum at θ = 20° and goes to zero above 45°; as far as backscattering is considered, the yield is maximal at 45° and goes to zero above 70° 48. Therefore, by varying the tilt angle α we can collect preferentially either sputtered or backscattered NI; this is illustrated in Figure 7.
Figure 8 shows the spatial distribution of the original locations of NI on the sample surface collected for each tilt angle. The spatial origin of the ion is simply inferred from its deviation which is computed based on E, of the particle. A uniform distribution of E, has been chosen for this calculation as an example of an arbitrary NIEADF, in order to enlarge the discussion from the NI surface production on HOPG to the general case.
Figure 6. Distribution f’(θ, φ) of the NI collected by the MS obtained from different sample tilts α for a given energy: E = 2 eV (left) and E = 17 eV (right). The distribution of emitted ions has been chosen uniform in E, for this calculation. Input parameters of the modelling correspond to an ECR H2 plasma at 1 Pa, 60 W, Vs = -130 V.
40 50 60 70 80 90 100 110 120 130 140 0 10 20 30 40 50 60 70 80 90 E = 2 eV =6 =4 =2 =0 T h e ta, de g Phi, deg 40 50 60 70 80 90 100 110 120 130 140 0 10 20 30 40 50 60 70 80 90 = 20 = 18 = 16 = 14 = 12 = 10 = 8 = 6 = 4 = 2 = 0 E = 17 eV T h e ta, de g Phi, deg
13
The ions collected at α = 0° originate from a circle on the sample (see Figure 8)When the symmetry is broken (α ≠ 0°), only a part of the distribution in is collected and the signal strongly decreases. Moreover, the spot of origin of the ions transforms into an ellipse and shifts in the direction of the mass spectrometer, perpendicular to the rotation axis, see Figure 8. The spot remains small in dimensions (~2 mm) compared to the total sample surface (8 mm in diameter). Despite the shift, it can be seen that even at the tilt angle α = 30°, NI never originate from the sample holder (or even the edge of the sample), which justifies our measurement scheme. Figure 8 shows that it would be possible to work with smaller samples if required.
The main output of the present work is the experimental confirmation that backscattered and sputtered neutral distribution functions as computed by SRIM can be used for negative-ions. It implies that the surface ionization probability under the present experimental conditions is not dependent on the angle and energy of the outgoing particle. This is not usually the case for metals, while it can be possible for insulators. Further studies are required to clarify the
0 5 10 15 20 25 30 0 20 40 60 80 100 Fr actio n co llected (%) alpha
Negative ions collected at the MS entrance: fraction backscattered
fraction sputtered
Figure 7. Fraction of sputtered and backscattered NI, which are collected by the mass-spectrometer, for different tilts of the sample α; the calculation is done in SRIM with Eimpact = 45 eV. Input parameters of the modelling
correspond to the situation of an ECR H2 plasma at 1 Pa, 60 W, Vs = -130 V.
Figure 8. Maps showing the spatial distributions of the origin on the sample surface of NI collected by the mass spectrometer. The maps are drawn for tilts of the sample α = 0°, 15° and 30°. Uniform distribution in E, θ, φ is assumed. Input parameters of the modelling correspond to an ECR H2 plasma at 1 Pa, 60 W, Vs = -130 V.
14
reason for this independence. In any case, knowing the NIEADF on the sample surface is of primary importance for the study of negative-ion surface production in plasmas with the aim of finding proper negative-ion enhancer materials. Figure 2 shows that at any tilt angle the fraction of ions collected is low compared to the total number of emitted ions. Measuring NIEDF at one particular tilt angle is therefore not enough to test the efficiency of one particular material with respect to the negative ion surface production. Hydrogenated materials, such as carbon considered here, will probably present a high signal at 0° tilt angle due to the preferential collection of sputtered ions (Figure 7) despite most of the ions are created on the surface by backscattering48. Non-hydrogenated materials might present a small signal at 0° tilt angle despite a high efficiency. Comparison of two different materials in terms of negative-ion yield must therefore be done at all tilt angles. The best approach is to use these measurements and the model to validate NIEADF given by SRIM and to compare directly NIEADF of both materials. Let us finally note that the ions formed at low energy and low angle are preferable in a negative-ion source in order to obtain well collimated beams of extracted ions. Thus, sputtering process is preferable since it gives lower energy and lower average angle emitted ions. In that sense, hydrogenated materials are interesting for the NI surface production.
5. Conclusion
The method developed here to determine the initial energy and angular distribution function (NIEADF) of NI emitted from the sample surface in H2 plasma is validated by a good agreement of the model with the experiment. Indeed, using SRIM distribution function as initial NIEADF, the model can reproduce the Negative-Ion Energy Distribution Functions (NIEDFs) measured by the mass spectrometer at different tilt angles of the sample. Moreover, we showed by tilting the sample that this validation concerns the whole distribution of emitted ions in terms of energy and angle. It confirms that the NIEADF for HOPG is close to the neutral distribution function given by SRIM. It implies that the NI formation probability on the graphite surface, under the present experimental conditions, is almost independent of the angle and energy of emission as stated previously47. The present paper shows that only a small part of the negative-ions emitted by the sample is collected by the mass spectrometer and one measurement at one particular tilt angle is not enough to characterize negative-ion yield. Furthermore, the model shows that hydrogenated materials will probably present high negative ion signal at 0° tilt angle contrary to non-hydrogenated materials. Therefore, in order to analyze efficiency of different negative-ion enhancer materials, it is of primary importance to compare the corresponding NI yields at different tilt angles. The best approach is to use SRIM to compute NIEADF on the sample surface and to validate it by comparison with experimental NIEDF measured at different tilt angles. In that way, the NIEADF of ions emitted by different materials can be directly compared.
The present method for the investigation of surface production of negative-ions in plasma is not restricted to hydrogen ions and to the application to Neutral Beam Injectors for fusion. For instance, it can also be used for analysis of oxygen negative-ions formed during thin layer deposition by reactive sputtering 25,26,27.
15
Acknowledgments
This work was carried out within the framework of the French Research Federation for Fusion Studies (FR-FCM) and of the EUROfusion Consortium. It has received funding from the Euratom research and training programme 2014-2018 under grant agreement No 633053. The views and opinions expressed herein do not necessarily reflect those of the European Commission. Financial support was received from the French Research Agency within the framework of the project ANR BLANC 13-BS09-0017 H INDEX TRIPLED.
References
1 Samukawa S, Sakamoto K and Ichiki K 2001 High-efficiency low energy neutral beam generation using negative
ions in pulsed plasma Japan. J. Appl.Phys. Part 2 40 L997–9
2 Thomas C, Tamura Y, Okada T, Higo A and Samukawa S 2014 Estimation of activation energy and surface
reaction mechanism of chlorine neutral beam etching of GaAs for nanostructure fabrication Journal of Physics D: Applied Physics 47 275201
3 Thomas C, Tamura Y, Syazwan M E, Higo A and Samukawa S 2014 Oxidation states of GaAs surface and their
effects on neutral beam etching during nanopillar fabrication J. Phys. D-Appl. Phys. 47 215203
4 Draghici M and Stamate E 2010 Properties and etching rates of negative ions in inductively coupled plasmas and
dc discharges produced in Ar/SF6 J. Appl. Phys. 107 123304
5 Vozniy O V and Yeom G Y 2009 High-energy negative ion beam obtained from pulsed inductively coupled
plasma for charge-free etching process Appl. Phys. Lett. 94 231502
6 D Marinov, Z el Otell, M D Bowden and N St J Braithwaite 2015 Extraction and neutralization of positive and
negative ions from a pulsed electronegative inductively coupled plasma Plasma Sources Science and Technology, Volume 24, Number 6
7 Fantz U, Franzen P and Wünderlich D 2012 Development of negative hydrogen ion sources for fusion:
experiments and modelling Chem. Phys. 398 7–16
8 Schiesko L, McNeely P, Fantz U, Franzen P and NNBI Team 2011 Caesium influence on plasma parameters and
source performance during conditioning of the prototype ITER neutral beam injector negative ion source Plasma Physics and Controlled Fusion 53 085029
9 Aanesland A, Rafalskyi D, Bredin J, Grondein P, Oudini N, Chabert P, Levko D, Garrigues L and Hagelaar G
2015 The PEGASES Gridded Ion-Ion Thruster Performance and Predictions IEEE Transactions on Plasma Science 43 321–6
10 Lafleur T, Rafalskyi D and Aanesland A 2015 Alternate extraction and acceleration of positive and negative
ions from a gridded plasma source Plasma Sources Sci. Technol. 24 015005
11 D. Renaud, D. Gerst, S. Mazouffre and A. Aanesland 2015 E × B probe measurements in molecular and
electronegative plasmas Rev. Sci. Instrum. 86, 123507
12 Ueno A et al 2010 Interesting experimental results in japan proton accelerator research complex H ion-source
development (invited) Rev. Sci. Instrum. 81 02A720
13 Moehs D P, Peters J and Sherman J 2005 Negative hydrogen ion sources for accelerators IEEE Trans. Plasma
Sci. 33 1786–98
14 Lettry J, Aguglia D, Andersson P, Bertolo S, Butterworth A, Coutron Y, Dallocchio A, Chaudet E, Gil-Flores
J, Guida R, Hansen J, Hatayama A, Koszar I, Mahner E, Mastrostefano C, Mathot S, Mattei S, Midttun Ø, Moyret P, Nisbet D, Nishida K, O’Neil M, Ohta M, Paoluzzi M, Pasquino C, Pereira H, Rochez J, Alvarez J S, Arias J S, Scrivens R, Shibata T, Steyaert D, Thaus N and Yamamoto T 2014 Status and operation of the Linac4 ion source prototypesa) Review of Scientific Instruments 85 02B122
15 Bacal M and Wada M 2015 Negative hydrogen ion production mechanisms Applied Physics Reviews 2 021305 16 Béchu S, Soum-Glaude A, Bès A, Lacoste A, Svarnas P, Aleiferis S, Ivanov A A and Bacal M 2013
Multi-dipolar microwave plasmas and their application to negative ion production Physics of Plasmas 20 101601
17 J. Komppula, O. Tarvainen, S. Lätti, T. Kalvas, H. Koivisto, V. Toivanen and P. Myllyperkiö (2013)
VUV-diagnostics of a filament-driven arc discharge H− ion source AIP Conference Proceedings, 1515, 66-73
16
18 Babkina T, Gans T and Czarnetzki U 2005 Energy analysis of hyperthermal hydrogen atoms generated through
surface neutralisation of ions Europhys. Lett.72 235–41
19 Schiesko L et al 2008 H-production on a graphite surface in a hydrogen plasma Plasma Sources Sci. Technol. 17 035023
20 Mahieu S and Depla D 2007 Correlation between electron and negative O[sup −] ion emission during reactive
sputtering of oxides Applied Physics Letters 90 121117
21 Toyoda H, Goto K, Ishijima T, Morita T, Ohshima N and Kinoshita K 2009 Fine Structure of O - Kinetic Energy
Distribution in RF Plasma and Its Formation Mechanism Applied Physics Express 2 126001
22 Ishijima T, Goto K, Ohshima N, Kinoshita K and Toyoda H 2009 Spatial Variation of Negative Oxygen Ion
Energy Distribution in RF Magnetron Plasma with Oxide Target Japanese Journal of Applied Physics 48 116004
23 Andersson J M, Wallin E, Münger E P and Helmersson U 2006 Energy distributions of positive and negative
ions during magnetron sputtering of an Al target in Ar∕O[sub 2] mixtures Journal of Applied Physics 100 33305
24 Heeren R M A et al 1994 Angular and energy distributions of surface produced H−and D−ions in a barium
surface conversion source J. Appl. Phys. 75 4340
25 Mahieu S, Leroy W P, Van Aeken K and Depla D 2009 Modeling the flux of high energy negative ions during
reactive magnetron sputtering Journal of Applied Physics 106 093302
26 Norihiro Ito, Nobuto Oka, Yasusi Sato, and Yuzo Shigesato 2010 Effects of Energetic Ion Bombardment on
Structural and Electrical Properties of Al-Doped ZnO Films Deposited by RF-Superimposed DC Magnetron Sputtering Jpn. J. Appl. Phys. 49 071103
27 Britun N, Minea T, Konstantinidis S and Snyders R 2014 Plasma diagnostics for understanding the plasma–
surface interaction in HiPIMS discharges: a review Journal of Physics D: Applied Physics 47 224001
28 R.S. Hemsworth and T.Inoue, IEEE Trans. Plasma Sci. 33(6), 1799 (2005)
29 Heinemann B, Fantz U, Franzen P, Froeschle M, Kircher M, Kraus W, Martens C, Nocentini R, Riedl R, Ruf B,
Schiesko L, Wimmer C and Wuenderlich D 2013 Negative ion test facility ELISE-Status and first results Fusion Eng. Des. 88 512–6
30 Fantz U, Schiesko L and Wuenderlich D 2014 Plasma expansion across a transverse magnetic field in a negative
hydrogen ion source for fusion Plasma Sources Sci. Technol. 23 044002
31 Fubiani G and Boeuf J P 2013 Role of positive ions on the surface production of negative ions in a fusion plasma
reactor type negative ion source-Insights from a three dimensional particle-in-cell Monte Carlo collisions model Phys. Plasmas 20 113511
32 Fubiani G and Boeuf J P 2014 Plasma asymmetry due to the magnetic filter in fusion-type negative ion sources:
Comparisons between two and three-dimensional particle-in-cell simulations Phys. Plasmas 21 073512
33 Mochalskyy S, Wuenderlich D, Fantz U, Franzen P and Minea T 2015 Towards a realistic 3D simulation of the
extraction region in ITER NBI relevant ion source Nucl. Fusion 55 033011
34 Mochalskyy S, Wuenderlich D, Ruf B, Fantz U, Franzen P and Minea T 2014 On the meniscus formation and
the negative hydrogen ion extraction from ITER neutral beam injection relevant ion source Plasma Phys. Control. Fusion 56 105001
35 V. Toigo et al (2015) Progress in the realization of the PRIMA neutral beam test facility Nuclear Fusion, Volume
55, Number 8
36 Antoni, V. and Agostinetti, P. and Aprile, D. and Cavenago, M. and Chitarin, G. and Fonnesu, N. and Marconato,
N. and Pilan, N. and Sartori, E. and Serianni, G. and Veltri, P. (2014) Physics design of the injector source for ITER neutral beam injector Review of Scientific Instruments, 85, 02B128
37 Miyamoto, K. and Okuda, S. and Nishioka, S. and Hatayama, A. (2013) Effect of basic physical parameters to
control plasma meniscus and beam halo formation in negative ion sources, Journal of Applied Physics, 114, 103302
38 Dudnikov V and Johnson R P 2011 Cesiation in highly efficient surface plasma sources Phys. Rev. ST Accel.
Beams 14 054801
39 V. Dudnikov, SU patent application C1.H013/04, No. 411542(10 March 1972)
40 Dudnikov, Vadim and Han, B. and Johnson, Rolland P. and Murray, S. N. and Pennisi, T. R. and Santana, M.
and Stockli, Martin P. and Welton, R. F. (2011) Surface Plasma Source Electrode Activation by Surface Impurities AIP Conference Proceedings, 1390, 411-421
41 Simonin A, Achard J, Achkasov K, Bechu S, Baudouin C, Baulaigue O, Blondel C, Boeuf J P, Bresteau D,
Cartry G, Chaibi W, Drag C, de Esch H P L, Fiorucci D, Fubiani G, Furno I, Futtersack R, Garibaldi P, Gicquel A, Grand C, Guittienne P, Hagelaar G, Howling A, Jacquier R, Kirkpatrick M J, Lemoine D, Lepetit B, Minea T, Odic E, Revel A, Soliman B A and Teste P 2015 R&D around a photoneutralizer-based NBI system (Siphore) in view of a DEMO Tokamak steady state fusion reactor Nuclear Fusion 55 123020
42 Schiesko L, Cartry G, Hopf C, Höschen T, Meisl G, Encke O, Heinemann B, Achkasov K, Amsalem P and
Fantz U 2015 First experiments with Cs doped Mo as surface converter for negative hydrogen ion sources Journal of Applied Physics 118 073303
17
43 Schiesko L, Carrère M, Layet J-M and Cartry G 2009 Negative ion surface production through sputtering in
hydrogen plasma Applied Physics Letters 95 191502
44 Schiesko L et al 2010 A comparative study of H- and D-production on graphite surfaces in H2 and D2 plasmas
Plasma Sources Sci. Technol. 19 045016
45 Kumar P et al 2011 Enhanced negative ion yields on diamond surfaces at elevated temperatures J. Phys. D:
Appl. Phys. 44 372002
46 A Ahmad et al 2014 Negative-ion production on carbon materials in hydrogen plasma: influence of the carbon
hybridization state and the hydrogen content on H− yield. J. Phys. D: Appl. Phys. 47 085201
47 A Ahmad et al 2013 Negative-ion surface production in hydrogen plasmas: modeling of negative-ion energy
distribution functions and comparison with experiments. Plasma Sources Sci. Technol. 22 025006
48 G Cartry et al 2012 Production of negative ions on graphite surface in H2/D2 plasmas: experiments and SRIM
calculations Phys. Plasmas 19 063503
49 Kurutz U and Fantz U 2015 Investigations on caesium-free alternatives for H− formation at ion source relevant
parameters AIP Conf. Proc. 1655, 020005
50 Phelps A V 1990 Cross Sections and Swarm Coefficients for H + , H2 + , H3 + , H, H2, and H - In H2
for Energies from 0.1 eV to 10 keV J. Phys. Chem. Ref. Data 19 653
51 SIMION website, http://simion.com/
52 J. F. Ziegler, J. P. Biersack, and M. D. Ziegler, SRIM – the Stopping and Range of Ions in Matter (SRIM Co.,
2008), ISBN 0-9654207-1-X
53 Van Wunnik J N M, Geerlings J J C and Los J 1983 The velocity dependence of the negatively charged fraction
of hydrogen scattered from cesiated tungsten surfaces Surf. Sci. 131 1
54B. Rasser et al., Negative ionization of hydrogen on W and Cs, Surface Science 118 (1982) 697-710
55 H. Winter, Collisions of atoms and ions with surfaces under grazing incidence, Physics Reports 367 (2002) 387–
582
56 Rasser B, Van Wunnik J N M and Los J 1982 Theoretical models of the negative ionization of hydrogen on
clean tungsten, cesiated tungsten and cesium surfaces at low energies Surf. Sci. 118 697–710
57 Tarvainen, O. and Kalvas, T. and Komppula, J. and Koivisto, H. and Geros, E. and Stelzer, J. and Rouleau, G.
and Johnson, K. F. and Carmichael, J. (2011) Effect of Ion Escape Velocity and Conversion Surface Material on H− Production AIP Conference Proceedings, 1390, 113-122