HAL Id: hal-00295422
https://hal.archives-ouvertes.fr/hal-00295422
Submitted on 15 Apr 2004
HAL is a multi-disciplinary open access
archive for the deposit and dissemination of
sci-entific research documents, whether they are
pub-lished or not. The documents may come from
teaching and research institutions in France or
abroad, or from public or private research centers.
L’archive ouverte pluridisciplinaire HAL, est
destinée au dépôt et à la diffusion de documents
scientifiques de niveau recherche, publiés ou non,
émanant des établissements d’enseignement et de
recherche français ou étrangers, des laboratoires
publics ou privés.
in diluted diesel exhaust
U. Mathis, M. Mohr, R. Zenobi
To cite this version:
U. Mathis, M. Mohr, R. Zenobi. Effect of organic compounds on nanoparticle formation in diluted
diesel exhaust. Atmospheric Chemistry and Physics, European Geosciences Union, 2004, 4 (3),
pp.609-620. �hal-00295422�
www.atmos-chem-phys.org/acp/4/609/
SRef-ID: 1680-7324/acp/2004-4-609
Chemistry
and Physics
Effect of organic compounds on nanoparticle formation in diluted
diesel exhaust
U. Mathis1, M. Mohr1, and R. Zenobi2
1EMPA, Swiss Federal Laboratories for Materials Testing and Research, Laboratory for Internal Combustion Engines,
CH-8600 D¨ubendorf, Switzerland
2ETH H¨onggerberg, Swiss Federal Institute of Technology, Chemistry Department, CH-8093 Z¨urich, Switzerland
Received: 6 November 2003 – Published in Atmos. Chem. Phys. Discuss.: 8 January 2004 Revised: 2 April 2004 – Accepted: 2 April 2004 – Published: 15 April 2004
Abstract. The nucleation of nanoparticles in the exhaust of a modern light-duty diesel vehicle was investigated on a chas-sis dynamometer. This laboratory study is focused on the influence of volatile organic compounds (VOCs) on nucle-ation of volatile nanoparticles. Different organic compounds were added to the dilution air of the particle sampling un-der different sampling conditions. Sample temperature and relative sample humidity were varied in a wide range. The number size distribution of the particles was measured with a scanning mobility particle sizer (SMPS) and showed signifi-cant differences in response to the added organic compounds. While the nucleation mode particles showed a large variation in concentration, the accumulation mode particles remained unchanged for all compounds. Depending on the functional group, organic compounds were capable of initiating and in-creasing (alcohols and toluene) or dein-creasing (acetone, ani-line, and methyl tert-butyl ether (MTBE)) nucleation mode particles. Short volatile aliphatic hydrocarbons (hexane and cyclohexane) turned out to be without effect on nucleation of nanoparticles. Possible reasons for the differences are dis-cussed.
1 Introduction
Exhaust from diesel engines represents an important an-thropogenic source of particles in ambient air. Particles from internal combustion engines can be divided into solid and volatile particles (Kittelson, 1998). The solid particles mainly consist of agglomerated carbonaceous primary par-ticles, which are usually described as soot. However, other compounds such as hydrocarbons can be adsorbed or con-densed on its surface. The volatile nanoparticles are usu-ally formed by nucleation of sulfuric acid, water, and other
Correspondence to: M. Mohr
(martin.mohr@empa.ch)
species. Formation of these volatile nanoparticles strongly depends on the dilution and cooling process of the exhaust. The two different kinds of particles usually form separate modes in the number size distribution, that are referred to as “accumulation mode” and “nucleation mode”.
Adverse health effects of particles on human health have been documented in several studies (Pope, 2000; Petrovic et al., 2000; Oberd¨orster, 2001). Impact on health has mainly been studied for soot particles and thus, there is limited information about volatile nanoparticles. Because volatile nanoparticles have a distinctly smaller diameter than soot particles, the mass contribution of volatile nanoparticles is usually small. However, investigations have documented that health effects were more related to particle number than to mass (Donaldson et al., 1998; Sydbom et al., 2001) even though the current legislation for particle emissions is based on mass. Compared to soot a higher deposition rate in the lungs might be expected for volatile nanoparticles because of their smaller diameters. As indicated in a study by Kim and Jaques (2000), the deposition rate of 40 nm solid nanopar-ticles is nearly 2.5 times higher than for 100 nm nanoparti-cles. To assess the human health impact of volatile nanopar-ticles, more information about their exact composition is needed. Sulfuric acid seems to be a relevant compound for human health effects in volatile nanoparticles. Inhalation of acid aerosols in laboratory animal studies causes geno-toxic damage in cells (Soskolne et al., 1984; Swenberg and Beauchamp, 1997). Kilgour et al. (2002) showed cell pro-liferation of the respiratory tract in rats due to exposure to sulfuric acid.
Improvements in engine technologies have reduced parti-cle mass emissions from diesel engines. The limit values for mass emissions from light-duty diesel vehicles were gradu-ally reduced by more than four times from 0.18 g km−1(Euro 1, since 1992) to 0.025 g km−1(Euro 4, as of 2005). A re-duction in mass is related to a decrease in number of soot particles, but there is no clear relation to the volatile
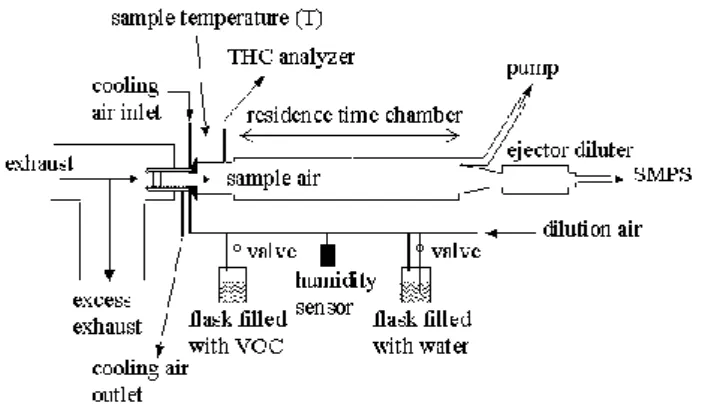
nanopar-Fig. 1. Overview of the experimental set-up.
Table 1. Engine parameters of the vehicle.
displacement per cylinder 1896 cm3
number of cylinder 4
maximum power / rpm 81 kW/4150 min−1 aftertreatment system oxidation catalyst
model year 1999
ticle emissions (Mohr et al., 2001). It is generally accepted that volatile nanoparticles are influenced by dilution param-eters such as temperature, dilution ratio, residence time, and humidity (Abdul-Khalek et al., 1999; Khalek et al., 2000; Mathis, 2002). In addition, the fuel sulfur content plays an important role (Ntziachristos et al., 2000; Maricq et al., 2002). Volatile nanoparticles are observed in both laboratory and vehicle chasing experiments, but the observed nucleation mode in chasing studies could not have been reproduced in laboratory control experiments yet (Kittelson, 2002; Vogt et al., 2003). A possible explanation could be the high sensitiv-ity of the nucleation mode to the dilution parameters. Kittel-son (1998) reported that a dilution ratio of 1000 is typical for an atmospheric dilution process of exhaust. However, large variation in atmospheric dilution depending on driving and ambient conditions is observed. The dilution parameters can be better controlled in laboratory experiments, which guar-antees a stable dilution process. A dilution ratio of 1000 is difficult to apply for many laboratory studies due to the high requirements of exact dilution parameters control. Although a lower dilution ratio is often applied in laboratory studies than under real world conditions, the formation mechanism of volatile nanoparticles is expected to be the same. There-fore, laboratory studies contribute to a better understanding of the principles in the formation process of volatile nanopar-ticles in real world conditions.
If the concentration of soot particles is sufficiently large, volatile nanoparticles can be quenched. Moreover, pre-existing soot particles scavenge a part of the volatile
nanopar-Table 2. Fuel analysis of the diesel.
analysis unit result
sulfur ppm 323 cetan index – 49.1 density at 15◦C kg m−3 831 viscosity at 40◦C mm2s−1 2.41 flash point ◦C 62.5 aromatics volume-% 24.7
ticles by collision (Seinfeld and Pandis, 1998). As the to-tal surface provided by soot particles is reduced, the rele-vant species responsible for nucleation remain in the gaseous phase and can lead to homogeneous nucleation (Kittelson, 1998; Mohr et al., 2001). However, the classical binary nucleation theory of water and sulfuric acid underestimates the formation of nucleation mode particles by several orders in number and thus, further species are suspected to be in-volved in nucleation (Shi and Harrison, 1999; Khalek et al., 2000). Besides the explanation of classical binary homoge-neous nucleation of sulfuric acid and water in diesel exhaust, homogeneous ternary nucleation of sulfuric acid, ammonia, and water (Napari et al., 2002) or nanoparticle formation from chemiions generated during combustion (Yu, 2001; Yu, 2002) were reported. Organic compounds are often consid-ered as the key species to control the growth of nucleation mode particles (Maricq et al., 1999; Kerminen et al., 2000; Khalek et al., 2000; Zhang and Wexler, 2002). Analytical investigations of the volatile nanoparticles in diesel exhaust has given strong indications that organic compounds were in-volved in the nucleation process (Tobias et al., 2001; Sakurai et al., 2003). The role of organic compounds has been in-vestigated in more detail for the formation of cloud conden-sation nuclei (CCN) than for the dilution process of engine exhaust. The organic compounds found in CCN are mainly organic acids such as formic, acetic, pyruvic, pinonic oxalic, and malonic acids (Yu, 2000; Hegg et al., 2001; Giebl et al., 2002). Little is known about organics with other functional groups. We investigated how non-acid organic compounds are involved in the nucleation process of volatile particles in diluted diesel exhaust. We added a variety of VOCs (aliphatic hydrocarbons, aromatic compounds, a ketone, an amine, an ether, and alcohols) into the primary dilution air. The inten-tion of this laboratory study is to contribute to a better un-derstanding of organic compounds in the nucleation process of diluted diesel exhaust. The focus of this laboratory study is to identify the functional groups that are involved in the nucleation process.
2 Experimental
2.1 Vehicle and fuel
All experiments were conducted with a modern light-duty diesel vehicle on a chassis dynamometer at constant speed (50 km h−1) and increased load conditions (7.0±0.2 kW, 18.1±0.5% of maximum power, 2100 rpm). The normal load was 2 kW under road conditions. The engine parameters and the results of fuel analysis are listed in Table 1 and Table 2. The tests were run with a standard fuel with a sulfur concen-tration of 323 ppm. The main advantage of using a diesel fuel with high sulfur content was the stable and repeatable forma-tion of volatile nanoparticles, which was the prerequisite for our investigation. The additional sulfur contribution in the exhaust by lube oil consumption was estimated to be 6 ppm fuel equivalent. The vehicle was running at 7.0±0.2 kW load for at least 20 min to conditionate the vehicle and sampling system.
2.2 Sampling
The overall set-up of the particle measurement is shown in Fig. 1. The relevant nucleation parameters such as dilu-tion ratio, diludilu-tion temperature, and residence time were kept constant. Dilution of the exhaust sample was performed with a two-stage dilution unit. The primary dilution of the ex-haust was accomplished inside a porous tube (Dekati proto-type), which was inserted directly into the tailpipe to min-imize sampling losses. Detailed information about the di-luter can be found in Mikkanen et al. (2001). By control-ling the temperature of the dilution air by means of a vor-tex cooler, the sample temperatures (T) were in the range of 34.7◦C±0.5◦C or 44.5◦C±0.5◦C, respectively. The sample temperature was measured immediately after the first dilu-tion. The dilution ratio was set to 8.5±0.5 by the flow ratio of the dilution air to the raw exhaust. Downstream of the first dilution stage unit, a residence chamber was inserted, offer-ing sufficient time for the relevant nucleation compounds to nucleate. A constant residence time of 2.50±0.15 s was cho-sen. The second dilution unit was placed at the end of the residence chamber to quench the formation and growth of nucleation mode particles. The dilution ratio of this ejector dilution unit remained constant at 10. Our dilution ratios for the primary and the secondary dilution are in line with simi-lar studies conducted in this field (Abdul-Khalek et al., 1999; Maricq et al., 1999; Tobias et al., 2001; Sakurai et al., 2003). To vary humidity in the exhaust sample, a part of the di-lution air of the primary diluter was bubbled through a flask filled with de-ionized water before entering the porous tube diluter. Relative humidity of the dilution air ranged from 4% to 75%, measured by a humidity sensor (Rotronic BM90). The chamber temperature was controlled and only ranged from 24.0◦C to 25.5◦C. This temperature recorded was taken into account for the calculation of the relative sample
humid-ity. Further contributions to the humidity came from com-bustion of the diesel fuel and the comcom-bustion air. Calculation of the combustion air humidity was based on a typical diesel fuel elemental composition of 14% hydrogen and 86% car-bon. The combustion air was measured to be 50% relative humidity at 25◦C and 950 hPa. Taking all contributions into account, the relative sample humidity after the first dilution unit was calculated to range from 30% to 99% at the mea-sured sample temperature. The relative sample humidity is hereafter referred to as relative humidity (RH). To adjust the gas concentration of the selected organic compounds in the sample, the pure organic compounds were filled into an ad-ditional flask as shown in Fig. 1. Some of the liquid organic compounds filled in the flask could uptake water from the di-lution air and reduce the relative humidity of the didi-lution air. This effect was considered to be negligible in this study. All added organic compounds were of technical quality (Fluka). Control experiments by evaporating the organic compounds and de-ionized water in the flask showed no particle forma-tion: The dilution air enriched with the organic compounds and water was analyzed by a scanning mobility particle sizer (SMPS, TSI) without observing any particles in the number size distribution. Concentrations of the organic compounds added to the exhaust were measured with a flame ionization detector (FID, Horiba Mexa-7400H) after the first dilution and were normalized to the effective number of carbon. The FID was calibrated with propane in the linear region from 1 ppm to 5000 ppm corrected as C1. When the
concentra-tion exceeded the concentraconcentra-tion of 5000 ppm corrected as C1,
we present the data as larger than the highest measured con-centration corrected for the added organic compound (e.g.
>5600 ppm toluene in Fig. 6, top panel). 2.3 Particle number size distribution
A SMPS, consisting of a differential mobility analyzer (DMA, TSI 3071) and a condensation particle counter (CPC, TSI 3025), was used for determining the number size distri-bution of the particles. The DMA had a polydisperse inlet flow of 1.5 l min−1and a sheath air flow of 15 l min−1 that selected particle diameters ranged from 7 nm to 214 nm. The impactor upstream of the DMA was removed because the pressure drop was too high to properly operate the CPC. A bypass to the DMA (4.8 l min−1)was installed to increase the flow rate and reduce diffusion losses. Therefore, no cor-rection of diffusion losses was conducted.
2.4 Calculation of the organic vapor concentration Based on the FID measurements, the vapor pressure piof the substance i in the sample air was calculated according to the ideal gas equation:
pi =
(ci,ppm−cbackground,ppm) ·10−6
Mv
42 43 44 45 46 47 0 200 400 600 800 1000 1200 1400 1600 concentration of isopropanol in the dilution air [ppm]
sample temperature [°C] 145 146 147 148 149 150 exhaust temperature [°C]
sample temperature exhaust temperature
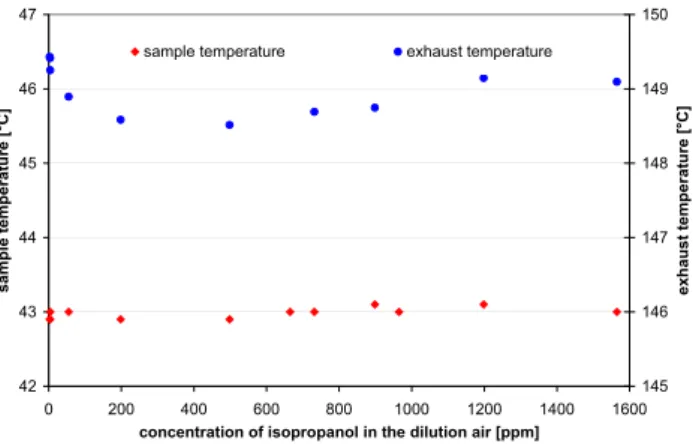
Fig. 2. Variation of sample and exhaust temperatures as a function
of the 2-propanol concentration in the sample air.
where R is the universal gas constant (8.3145 J mol−1K−1),
T is the chamber temperature measured in Kelvin, ci,ppm is the volume concentration in ppm of the substance i,
cbackground,ppm is the concentration without adding any VOCs, and Mv is the mole volume. cbackground,ppm was measured experimentally to be 5 ppm for all measurements.
The vapor pressure PSi in Torr over the pure liquid phase for a flat surface was calculated for the substance i according to the Antoine equation (Lange and Dean, 1973):
log10PSi =A −
B
C + t, (2)
or alternatively, for 1-butanol with log10PSi =C −
52.23 · B
(t +273.15), (3)
where A, B, and C are constants and t is the temperature in ◦C.
The constants A, B, and C were taken from Lange and Dean (1973). For 1-hexanol and MTBE the values were taken from Poling et al. (2001) and Kr¨ahenb¨uhl and Gmehling (1994), respectively.
To compare the vapor pressures with each other, a com-mon quantity was introduced. A good approach is the satu-ration ratio Si; the ratio of the partial vapor pressure pito the saturation vapor over the pure liquid phase PSi:
Si =
pi
PSi
. (4)
3 Results and discussions
The aim of this investigation was to study a selection of VOCs on the nucleation process at varying temperature and humidity of the sample. Because the nucleation process is very sensitively to small changes of the dilution conditions, it had to be verified that the increase of humidity and VOCs
in the dilution air did not influence any sampling parameters. Regarding the key parameters listed in Table 3, the varia-tions of the sampling parameters are small within a test se-ries. The variations from one test to another mainly depended on the restart of the vehicle. To unambiguously assign the effect of VOCs, the influence of the other key parameters were recorded. A typical temperature variation of the dilu-tion flow, sample flow, and exhaust flow within the same test series is shown for 2-propanol in Fig. 2. Variations of tem-peratures were randomly distributed and were not dependent on the concentration of 2-propanol in the dilution air. Based on these control experiments, it was verified that an increase of humidity and VOCs did not influence the sampling param-eters.
The variation of the accumulation mode was found to vary
±25% from one test series to another when the vehicle was restarted. A possible reason could be the corresponding ve-hicle load variation of ±3% at this very sensitive operation point. In line with the load variation the exhaust temper-ature varied ±6◦C. A small exhaust temperature variation can be responsible to alter the conversion rate from SO2 to
SO3by the oxidation catalyst. Nevertheless, the load could
be set within ±1% for a test series that provided stable test conditions without any significant effect on the accumulation mode particles. Therefore, we consider the test-to-test varia-tion as uncritical since the interpretavaria-tion of our data is based on relative changes within a test series.
To investigate at which step of nucleation VOCs have an impact, three test conditions A, B, and C were evaluated. The key nucleation parameters of these three conditions are psented in Table 3. Tests without any addition of VOC re-vealed the following results: Under test condition A (sam-ple temperature (T)=44.9◦C, relative humidity (RH)=36.3%) no or only a weak nucleation mode could be detected. Un-der condition B (T=44.3◦C, RH=81.2%) a nucleation was always observed, which is explained by the higher humid-ity compared to condition A (T=44.9◦C, RH=36.3%). The strongest nucleation occurred under condition C (T=34.7◦C, RH=31.6%) as the low dilution air temperature provoked nu-cleation already at low humidity levels.
3.1 Effect of humidity
To distinguish the effect of humidity and VOCs in the di-lution air on the nucleation process, a first series was con-ducted varying only the humidity in the dilution air. The sample temperature was either held at 45.0◦C or at 34.2◦C. Figure 3 depicts the effect of humidity on nucleation under both conditions. A considerable humidity effect on the nu-cleation mode particles was found at a sample temperature of 45.0◦C. When the humidity was increased, a strong rise of the nucleation mode particles was observed. In addition, this peak moved to slightly higher diameters with increas-ing humidity. This can be explained by stronger coagulation due to a higher concentration of volatile nanoparticles at 99%
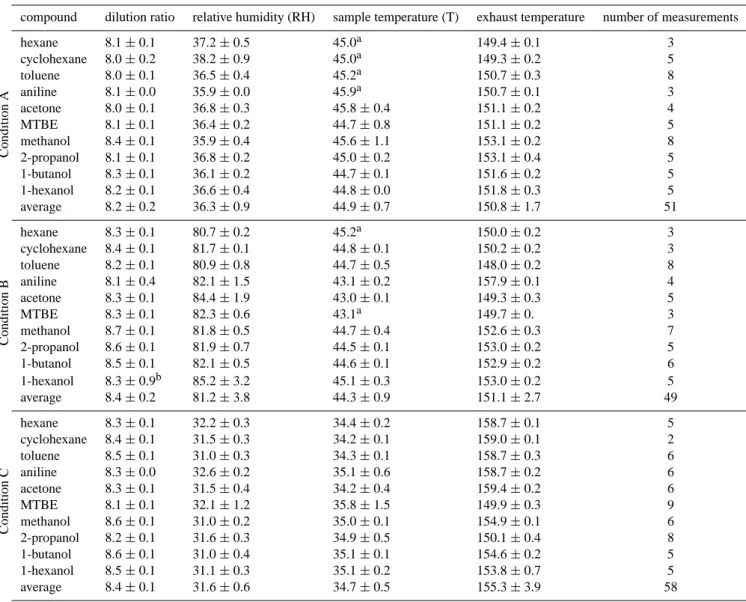
Table 3. Average and standard deviation of the key parameters for all test series. Co nditio n A Con dition B Con dition C
compound dilution ratio relative humidity (RH) sample temperature (T) exhaust temperature number of measurements
hexane 8.1 ± 0.1 37.2 ± 0.5 45.0a 149.4 ± 0.1 3 cyclohexane 8.0 ± 0.2 38.2 ± 0.9 45.0a 149.3 ± 0.2 5 toluene 8.0 ± 0.1 36.5 ± 0.4 45.2a 150.7 ± 0.3 8 aniline 8.1 ± 0.0 35.9 ± 0.0 45.9a 150.7 ± 0.1 3 acetone 8.0 ± 0.1 36.8 ± 0.3 45.8 ± 0.4 151.1 ± 0.2 4 MTBE 8.1 ± 0.1 36.4 ± 0.2 44.7 ± 0.8 151.1 ± 0.2 5 methanol 8.4 ± 0.1 35.9 ± 0.4 45.6 ± 1.1 153.1 ± 0.2 8 2-propanol 8.1 ± 0.1 36.8 ± 0.2 45.0 ± 0.2 153.1 ± 0.4 5 1-butanol 8.3 ± 0.1 36.1 ± 0.2 44.7 ± 0.1 151.6 ± 0.2 5 1-hexanol 8.2 ± 0.1 36.6 ± 0.4 44.8 ± 0.0 151.8 ± 0.3 5 average 8.2 ± 0.2 36.3 ± 0.9 44.9 ± 0.7 150.8 ± 1.7 51 hexane 8.3 ± 0.1 80.7 ± 0.2 45.2a 150.0 ± 0.2 3 cyclohexane 8.4 ± 0.1 81.7 ± 0.1 44.8 ± 0.1 150.2 ± 0.2 3 toluene 8.2 ± 0.1 80.9 ± 0.8 44.7 ± 0.5 148.0 ± 0.2 8 aniline 8.1 ± 0.4 82.1 ± 1.5 43.1 ± 0.2 157.9 ± 0.1 4 acetone 8.3 ± 0.1 84.4 ± 1.9 43.0 ± 0.1 149.3 ± 0.3 5 MTBE 8.3 ± 0.1 82.3 ± 0.6 43.1a 149.7 ± 0. 3 methanol 8.7 ± 0.1 81.8 ± 0.5 44.7 ± 0.4 152.6 ± 0.3 7 2-propanol 8.6 ± 0.1 81.9 ± 0.7 44.5 ± 0.1 153.0 ± 0.2 5 1-butanol 8.5 ± 0.1 82.1 ± 0.5 44.6 ± 0.1 152.9 ± 0.2 6 1-hexanol 8.3 ± 0.9b 85.2 ± 3.2 45.1 ± 0.3 153.0 ± 0.2 5 average 8.4 ± 0.2 81.2 ± 3.8 44.3 ± 0.9 151.1 ± 2.7 49 hexane 8.3 ± 0.1 32.2 ± 0.3 34.4 ± 0.2 158.7 ± 0.1 5 cyclohexane 8.4 ± 0.1 31.5 ± 0.3 34.2 ± 0.1 159.0 ± 0.1 2 toluene 8.5 ± 0.1 31.0 ± 0.3 34.3 ± 0.1 158.7 ± 0.3 6 aniline 8.3 ± 0.0 32.6 ± 0.2 35.1 ± 0.6 158.7 ± 0.2 6 acetone 8.3 ± 0.1 31.5 ± 0.4 34.2 ± 0.4 159.4 ± 0.2 6 MTBE 8.1 ± 0.1 32.1 ± 1.2 35.8 ± 1.5 149.9 ± 0.3 9 methanol 8.6 ± 0.1 31.0 ± 0.2 35.0 ± 0.1 154.9 ± 0.1 6 2-propanol 8.2 ± 0.1 31.6 ± 0.3 34.9 ± 0.5 150.1 ± 0.4 8 1-butanol 8.6 ± 0.1 31.0 ± 0.4 35.1 ± 0.1 154.6 ± 0.2 5 1-hexanol 8.5 ± 0.1 31.1 ± 0.3 35.1 ± 0.2 153.8 ± 0.7 5 average 8.4 ± 0.1 31.6 ± 0.6 34.7 ± 0.5 155.3 ± 3.9 58
aThe dilution temperature was only once measured during the whole test and thus, no deviation is indicated. bBigger deviation was due to the lower dilution ratio of 6.7 in the first scan.
relative humidity. The accumulation mode remained stable at about 70 nm. There was a distinct nucleation mode under dry conditions at 31% relative humidity and a sample tempera-ture of 34.2◦C. The nucleation mode particles increased by a factor of two when the relative humidity was increased from 31% to 81%. In comparison with the sample temperature at 45.0◦C, there was a considerably lower influence of humid-ity on the nucleation process. To compare the strength of nucleation, the ratio of the maximum number concentrations in the nucleation mode to the accumulation mode was calcu-lated. Due to this normalization, no correction of the particle number size distribution by the dilution ratio was necessary. This ratio is presented as a function of the relative humidity in the sample in Fig. 4. Below about 60% relative humidity, no appreciable nucleation took place at a sample temperature
of 45.0◦C, indicating a minimal initial relative humidity for nucleation. As soon as the relative humidity was further in-creased, a clear dependence on humidity was observed. The ratio of the maximum number concentrations of nucleation mode to the accumulation mode showed a linear dependence on the humidity over the entire investigated range at a sample temperature of 34.2◦C. The lower sensitivity on humidity at a sample temperature of 34.2◦C is apparent when the slope is compared under the assumption of linear response. The sam-ple temperature at 45.0◦C with a slope of 0.062(% relative humidity)−1had a significantly steeper slope than at 34.2◦C with a slope of 0.037(% relative humidity)−1. In spite of the bigger humidity effect on the volatile nanoparticles at a sample temperature of 45.0◦C, the absolute concentration of volatile nanoparticles was always higher at 34.2◦C. Our
ex-0.0E+00 1.0E+08 2.0E+08 3.0E+08 4.0E+08 5.0E+08 6.0E+08 7.0E+08 dN/dlog dp [cm -3] 99 84 69 62 41 relative humidity [%] sample temperature: 45.0 °C 0.0E+00 1.0E+08 2.0E+08 3.0E+08 4.0E+08 5.0E+08 6.0E+08 7.0E+08 1 10 100 1000
electrical mobility particle diameter dp [nm]
dN/dlog dp [cm -3] 81 67 62 50 42 31 relative humidity [%] sample temperature: 34.2 °C
Fig. 3. Influence of humidity on the nucleation mode. A weak
nu-cleation was detected at the lowest relative humidity of 41% and sample temperature 45.0◦C (top panel). The nucleation increased more than one order of magnitude when the relative humidity in-creased to 99%. For the sample temperature 34.2◦C a nucleation mode was observed even with the lowest relative humidity 31% (bottom panel). Therefore, the increase of nucleation was less pro-nounced than at sample temperature 45.0◦C.
0 0.5 1 1.5 2 2.5 3 3.5 4 4.5 0 10 20 30 40 50 60 70 80 90 100 relative humidity of sample [%]
ratio (mode <30nm)/(mode >30nm) [-]
sample temperature: 34.2 °C
sample temperature: 45.0 °C
Fig. 4. Strength of nucleation for variable humidity. The linear
regression in the linear region resulted in a correlation factor of R2=0.94 and R2=0.96 at sample temperature 34.2◦C and 45.0◦C, respectively.
perimental work is in accordance with the parametric study of Kim et al. (2002). A linear dependence was found of the nucleation rate as a function of relative humidity under con-ditions of increased humidity.
Table 4. Molecular structure of the investigated organic com-pounds.
22 Table 4. Molecular structure of the investigated organic compounds.
compound structure hexane cyclohexane toluene aniline acetone methyl tert-butyl ether (MTBE) methanol 2-propanol 1-butanol 1-hexanol NH2 O O OH OH OH OH
3.2 Effect of organic vapors on the nucleation mode To find out which substance classes affect the nucleation process, a variety of organic compounds were added. The measured hydrocarbon concentration corrected as C1ranged
from 500 ppm to 5000 ppm in the mixed sample part and ex-ceeded the normal concentrations in exhaust gas by one or two orders of magnitude. However, concentrations of sev-eral thousands ppm are typical for cold starts at low tem-peratures. We found raw gas concentrations of 5000 ppm to 20 000 ppm and 10 000 ppm to 30 000 ppm for diesel and gasoline vehicles, respectively, in the first minutes of cold starts at −20◦C. Since we operated the engine at warm con-ditions, the oxidation catalyst converted hydrocarbons to a large extent. However, we do not intend to simulate the real world situation at this engine operation point but to gain a principal understanding of the nucleation process in pres-ence of organic compounds. The added chemical compounds consisted of aliphatic hydrocarbons, aromatic compounds, a ketone, an amine, an ether, and alcohols. The chemi-cal structures of these compounds are shown in Table 4. We chose compounds of high volatility to prevent losses by condensation on the sampling system. We are aware that less volatile organic compounds are more likely to be
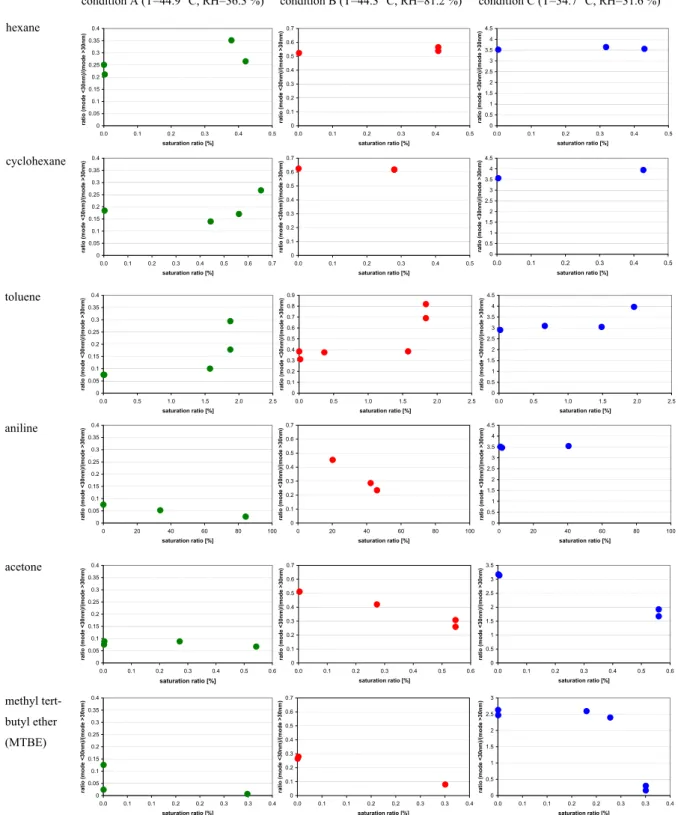
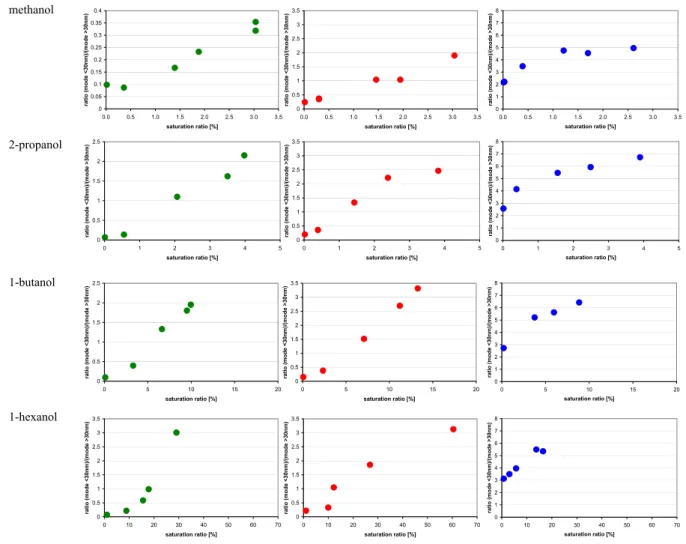
in-condition A (T=44.9 °C, RH=36.3 %) condition B (T=44.3 °C, RH=81.2 %) condition C (T=34.7 °C, RH=31.6 %) hexane cyclohexane 0 0.05 0.1 0.15 0.2 0.25 0.3 0.35 0.4 0.0 0.1 0.2 0.3 0.4 0.5 saturation ratio [%] ratio (m ode <30nm )/(m o de >30nm ) 0 0.1 0.2 0.3 0.4 0.5 0.6 0.7 0.0 0.1 0.2 0.3 0.4 0.5 saturation ratio [%] ratio (m ode <30nm )/(m ode >30nm ) 0 0.5 1 1.5 2 2.5 3 3.5 4 4.5 0.0 0.1 0.2 0.3 0.4 0.5 saturation ratio [%] ratio (m ode <30nm )/(m ode >30nm ) 0 0.1 0.2 0.3 0.4 0.5 0.6 0.7 0.0 0.1 0.2 0.3 0.4 0.5 saturation ratio [%] ratio (m ode <30nm )/(m o de >30nm ) 0 0.5 1 1.5 2 2.5 3 3.5 4 4.5 0.0 0.1 0.2 0.3 0.4 0.5 saturation ratio [%] ratio (m ode <30nm )/(m o de >30nm ) 0 0.05 0.1 0.15 0.2 0.25 0.3 0.35 0.4 0.0 0.1 0.2 0.3 0.4 0.5 0.6 0.7 saturation ratio [%] ratio (m ode <30nm )/(m o de >30nm ) toluene aniline Figure 5. continued. 0 0.05 0.1 0.15 0.2 0.25 0.3 0.35 0.4 0.0 0.5 1.0 1.5 2.0 2.5 saturation ratio [%] ra tio (m ode <30nm )/(m o de >30nm ) 0 0.1 0.2 0.3 0.4 0.5 0.6 0.7 0.8 0.9 0.0 0.5 1.0 1.5 2.0 2.5 saturation ratio [%] ra tio (m ode <30nm )/(m o de >30nm ) 0 0.5 1 1.5 2 2.5 3 3.5 4 4.5 0.0 0.5 1.0 1.5 2.0 2.5 saturation ratio [%] ra tio (m ode <30nm )/(m o de >30nm ) 0 0.05 0.1 0.15 0.2 0.25 0.3 0.35 0.4 0 20 40 60 80 100 saturation ratio [%] ra tio (m ode <30nm )/(m o de >30nm ) 0 0.1 0.2 0.3 0.4 0.5 0.6 0.7 0 20 40 60 80 100 saturation ratio [%] ra tio (m ode <30nm )/(m o de >30nm ) 0 0.5 1 1.5 2 2.5 3 3.5 4 4.5 0 20 40 60 80 100 saturation ratio [%] ra tio (m ode <30nm )/(m o de >30nm ) acetone methyl tert-butyl ether (MTBE) 0 0.05 0.1 0.15 0.2 0.25 0.3 0.35 0.4 0.0 0.1 0.2 0.3 0.4 0.5 0.6 saturation ratio [%] ratio (m ode <30nm )/(m o de >30nm ) 0 0.1 0.2 0.3 0.4 0.5 0.6 0.7 0.0 0.1 0.2 0.3 0.4 0.5 0.6 saturation ratio [%] ratio (m ode <30nm )/(m o de >30nm ) 0 0.5 1 1.5 2 2.5 3 3.5 0.0 0.1 0.2 0.3 0.4 0.5 0.6 saturation ratio [%] ratio (m ode <30nm )/(m o de >30nm ) 0 0.05 0.1 0.15 0.2 0.25 0.3 0.35 0.4 0.0 0.1 0.1 0.2 0.2 0.3 0.3 0.4 saturation ratio [%] ratio (m ode <30nm )/(m o de >30nm ) 0 0.1 0.2 0.3 0.4 0.5 0.6 0.7 0.0 0.1 0.1 0.2 0.2 0.3 0.3 0.4 saturation ratio [%] ratio (m ode <30nm )/(m o de >30nm ) 0 0.5 1 1.5 2 2.5 3 0.0 0.1 0.1 0.2 0.2 0.3 0.3 0.4 saturation ratio [%] ratio (m ode <30nm )/(m o de >30nm )
Fig. 5. Effect of the investigated organic compounds on the nucleation mode particles under condition A, B and C. volved in the nucleation process under atmospheric
condi-tions. Sakurai et al. (2003) reported that organic compounds from diesel nanoparticle was comprised of medium molecu-lar weight with carbon numbers in the range from C24to C32
for aliphatic hydrocarbons. However, our objective of this laboratory study is to identify the functional groups that are
involved in the nucleation process. Therefore, the volatility of the organic compounds only plays a minor relevance for the interpretation of our data.
An overview of the effect of the organic compounds on the nucleation mode is given in Fig. 5. To compare the strength of nucleation, the ratio of the maximum number
concentra-condition A (T=44.9 °C, RH=36.3 %) condition B (T=44.3 °C, RH=81.2 %) condition C (T=34.7 °C, RH=31.6 %) hexane cyclohexane 0 0.05 0.1 0.15 0.2 0.25 0.3 0.35 0.4 0.0 0.1 0.2 0.3 0.4 0.5 saturation ratio [%] ratio (m ode <30nm )/(m o de >30nm ) 0 0.1 0.2 0.3 0.4 0.5 0.6 0.7 0.0 0.1 0.2 0.3 0.4 0.5 saturation ratio [%] ratio (m ode <30nm )/(m ode >30nm ) 0 0.5 1 1.5 2 2.5 3 3.5 4 4.5 0.0 0.1 0.2 0.3 0.4 0.5 saturation ratio [%] ratio (m ode <30nm )/(m ode >30nm ) 0 0.1 0.2 0.3 0.4 0.5 0.6 0.7 0.0 0.1 0.2 0.3 0.4 0.5 saturation ratio [%] ratio (m ode <30nm )/(m o de >30nm ) 0 0.5 1 1.5 2 2.5 3 3.5 4 4.5 0.0 0.1 0.2 0.3 0.4 0.5 saturation ratio [%] ratio (m ode <30nm )/(m o de >30nm ) 0 0.05 0.1 0.15 0.2 0.25 0.3 0.35 0.4 0.0 0.1 0.2 0.3 0.4 0.5 0.6 0.7 saturation ratio [%] ratio (m ode <30nm )/(m o de >30nm ) methanol 2-propanol 0 0.5 1 1.5 2 2.5 3 3.5 0.0 0.5 1.0 1.5 2.0 2.5 3.0 3.5 saturation ratio [%] ratio (m ode <30nm )/(m ode >30nm ) 0 0.05 0.1 0.15 0.2 0.25 0.3 0.35 0.4 0.0 0.5 1.0 1.5 2.0 2.5 3.0 3.5 saturation ratio [%] ratio (m ode <30nm )/(m ode >30nm ) 0 1 2 3 4 5 6 7 8 0.0 0.5 1.0 1.5 2.0 2.5 3.0 3.5 saturation ratio [%] ratio (mode < 30nm)/(mode > 30nm) 0 0.5 1 1.5 2 2.5 0 1 2 3 4 5 saturation ratio [%] ratio (m ode <30nm )/(m o de >30nm ) 0 0.5 1 1.5 2 2.5 3 3.5 0 1 2 3 4 5 saturation ratio [%] ratio (m ode <30nm )/(m o de >30nm ) 0 1 2 3 4 5 6 7 8 0 1 2 3 4 5 saturation ratio [%] rat io ( m ode <30nm )/ (m ode >30nm ) 1-butanol 1-hexanol 0 0.5 1 1.5 2 2.5 0 5 10 15 20 saturation ratio [%] ratio (m ode <30nm )/(m ode >30nm ) 0 1 2 3 4 5 6 7 8 0 5 10 15 20 saturation ratio [%] rat io ( m ode <30nm )/ (m ode >30nm ) 0 0.5 1 1.5 2 2.5 3 3.5 0 10 20 30 40 50 60 70 saturation ratio [%] ratio (m ode <30nm )/(m ode >30nm ) 0 0.5 1 1.5 2 2.5 3 3.5 0 10 20 30 40 50 60 70 saturation ratio [%] ratio (m ode <30nm )/(m ode >30nm ) 0 1 2 3 4 5 6 7 8 0 10 20 30 40 50 60 70 saturation ratio [%] rat io ( m ode <30nm )/ (m ode >30nm ) 0 0.5 1 1.5 2 2.5 3 3.5 0 5 10 15 20 saturation ratio [%] ratio (m ode <30nm )/(m ode >30nm ) Fig. 5. Continued.
tions in the nucleation mode to the accumulation mode was calculated. The repeatability of the nucleation mode parti-cles throughout the same test series is given in Fig. 5 for the four alcohols methanol, 2-propanol, butanol, and 1-hexanol. All alcohols were tested on the same day with-out turning off the engine. The test was started with condi-tion B. As soon as stable sampling condicondi-tions were achieved, the concentration of the first alcohol was varied. Before the next alcohol was tested, SMPS scans were recorded without adding any alcoholic vapor. As illustrated in Fig. 5, the mode ratio of nucleation to soot particles was repeated each time before testing the next alcohol when no alcoholic vapor (sat-uration ratio =0) was added. The test procedure was analogue for the conditions A and C. The mode ratio of nucleation to soot particles varied without alcoholic vapor (saturation ratio =0) in a small range under these conditions. Therefore, the nucleation mode particles were found to be stable under all conditions (A, B and C) within a time period of at least one hour.
3.2.1 Aliphatic hydrocarbons
The effect on nucleation mode particles was investigated for two aliphatic hydrocarbons hexane and cyclohexane. For both compounds, no effect was observed on the particles in the nucleation mode though the concentration in the dilution air was increased up to 8000 ppm (see Fig. 5). However, due to their high volatility, the saturation ratio remained always below 0.41%. Besides the low saturation ratio, little inter-action of these hydrophobic molecules with the main nucle-ation mode particles (water and sulfuric acid) exists. 3.2.2 Aromatic compounds
Toluene was chosen due to its high volatility compared to other polyaromatic compounds. Toluene influenced the nu-cleation mode particles under all conditions investigated, but only at the highest toluene concentration. Similar to the ef-fect of humidity, the nucleation process was more afef-fected when no or a weak nucleation mode existed in the
begin-0.0E+00 2.0E+07 4.0E+07 6.0E+07 8.0E+07 1.0E+08 1.2E+08 1.4E+08 1.6E+08 1.8E+08 dN/dlog dp [cm -3] >5600 >1.87 4863 1.57 40 0.01 67 0.003 concentration of toluene [ppm] / saturation ratio [%] condition A 0.0E+00 2.0E+07 4.0E+07 6.0E+07 8.0E+07 1.0E+08 1.2E+08 1.4E+08 1.6E+08 1.8E+08 1 10 100 1000
electrical mobility particle diameter dp [nm]
dN/dlog dp [cm -3] 131920.2 2477 42.3 2840 46.0 concentration of aniline [ppm] / saturation ratio [%] condition B
Fig. 6. Particle size distribution in the presence of aromatic
com-pounds. The effects on the nucleation mode particles are presented for toluene (top panel) and aniline (bottom panel) under condition A (T=44.9◦C, RH=36.3%) and B (T=44.3◦C, RH=81.2%), respec-tively.
ning as under conditions A (T=44.9◦C, RH=36.3%) and B (T=44.3◦C, RH=81.2%) than for a strong nucleation mode as under condition C (T=34.7◦C, RH=31.6%). Interestingly, toluene was capable of triggering a nucleation mode under condition A (T=44.9◦C, RH=36.3%) when no spontaneous nucleation occurred (see Fig. 6, top panel). Obviously, the hydrophobic toluene associates with the nucleation mode particles. Following a suggestion by Tobias et al. (2001), a two-phase system of the hydrophobic compounds and wa-ter/sulfuric acid is proposed because it is unlikely that an association takes place between toluene and water/sulfuric acid. It likely seems that the organic phase was mainly cre-ated by the added toluene. Compared to other factors affect-ing the nucleation process, e.g. humidity, the increased nu-cleation mode particles due to the addition of toluene were moderate. Therefore, hydrophobic compounds with vapor pressures comparable to or higher than toluene (38 hPa at 25◦C) are assumed to be irrelevant for the nucleation process in diluted diesel exhaust.
For aniline (see Fig. 6, bottom panel), nucleation mode particles were not influenced under condition C (T=34.7◦C, RH=31.6%). A reduction of nucleation mode particles ap-peared under conditions A (T=44.9◦C, RH=36.3%) and B
0.0E+00 1.0E+08 2.0E+08 3.0E+08 4.0E+08 5.0E+08 6.0E+08 1 10 100 1000
electrical mobility particle diameter dp [nm]
dN/dlog dp [cm -3] 41 0.002 125 0.005 >14000 >0.56 concentration of acetone [ppm] / saturation ratio [%] condition C
Fig. 7. Particle size distribution in the presence of acetone.
Reduc-tion of the nucleaReduc-tion mode particles occurred under condiReduc-tion C (T=34.7◦C, RH=31.6%). 0.0E+00 5.0E+07 1.0E+08 1.5E+08 2.0E+08 2.5E+08 3.0E+08 3.5E+08 dN/dlog dp [cm -3] 33 0.001 62 0.002 >8300 >0.30 concentration of MTBE [ppm] / saturation ratio [%] condition B 0.0E+00 5.0E+07 1.0E+08 1.5E+08 2.0E+08 2.5E+08 3.0E+08 3.5E+08 1 10 100 1000
electrical mobility particle diameter dp [nm]
dN/dlog dp [cm -3] 11 0.0004 15 0.0005 6147 0.23 >8300 >0.30 >8300 >0.30 concentration of MTBE [ppm] / saturation ratio [%] condition C
Fig. 8. Particle size distribution in the presence of MTBE under condition B (T=44.3◦C, RH=81.2%), and C (T=34.7◦C, RH=31.6%) on top panel and on bottom panel, respectively. In both cases the nucleation mode particles were reduced.
(T=44.3◦C, RH=81.2%). Since the reduction was weak and not confirmed under condition C (T=34.7◦C, RH=31.6%), we conclude that the effect of aniline on nucleation mode particles is of minor relevance.
3.2.3 Acetone
Acetone was chosen due to its high volatility. Without pre-existing nucleation mode particles under condition A
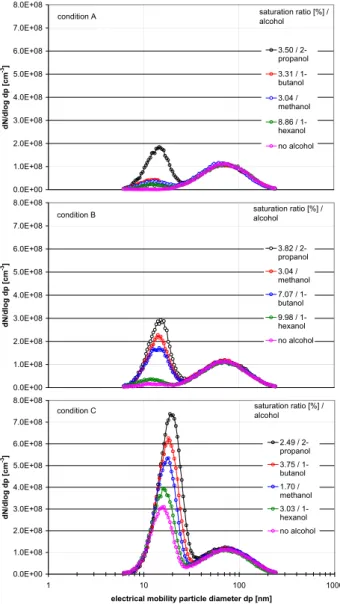
0.0E+00 1.0E+08 2.0E+08 3.0E+08 4.0E+08 5.0E+08 6.0E+08 7.0E+08 8.0E+08 dN/dlog dp [cm -3] 3.50 / 2-propanol 3.31 / 1-butanol 3.04 / methanol 8.86 / 1-hexanol no alcohol saturation ratio [%] / alcohol condition A 0.0E+00 1.0E+08 2.0E+08 3.0E+08 4.0E+08 5.0E+08 6.0E+08 7.0E+08 8.0E+08 dN/dlog dp [cm -3] 3.82 / 2-propanol 3.04 / methanol 7.07 / 1-butanol 9.98 / 1-hexanol no alcohol saturation ratio [%] / alcohol condition B 0.0E+00 1.0E+08 2.0E+08 3.0E+08 4.0E+08 5.0E+08 6.0E+08 7.0E+08 8.0E+08 1 10 100 1000
electrical mobility particle diameter dp [nm]
dN/dlog dp [cm -3] 2.49 / 2-propanol 3.75 / 1-butanol 1.70 / methanol 3.03 / 1-hexanol no alcohol saturation ratio [%] / alcohol condition C
Fig. 9. Particle size distribution in the presence of methanol, 2-propanol, 1-butanol, and 1- hexanol under all three conditions A (T=44.9◦C, RH=36.3%), B (T=44.3◦C, RH=81.2%), and C (T=34.7◦C, RH=31.6%).
(T=44.9◦C, RH=36.3%), no effect on the nucleation was de-tected with addition of the compound. The effect of ace-tone was relatively weak and consisted in a decrease of nu-cleation mode particles with increasing acetone concentra-tion in the sample under condiconcentra-tion B (T=44.3◦C, RH=81.2%) and C (T=34.7◦C, RH=31.6%). As an example, condition C (T=34.7◦C, RH=31.6%) is depicted in Fig. 10.
3.2.4 MTBE
Due to its high relevance as a gasoline additive, MTBE was chosen. MTBE leads to more complete combustion due to the oxygen contained in the molecule (Poulopou-los and Philippopou(Poulopou-los, 2003). The nucleation mode
parti-0.00 0.01 0.02 0.03 0.04 0.05 0.06 0.07 0.08 0.00 0.10 0.20 0.30 0.40 0.50 volume fraction of alcohol
surface tension of water alcohol mixture [Nm
-1] methanol
2-propanol 1-hexanol
1-butanol
Fig. 10. Surface tension of water-alcohol mixtures versus on the
alcohol volume concentration.
Table 5. Water solubility of the investigated alcohols (CRC-press,
1985).
alcohol water solubility, 20◦C
methanol completely miscible 2-propanol completely miscible 1-butanol 77 g 1−1
1-hexanol 5.8 g 1−1
cles showed a strong decrease as soon as the MTBE con-centration was increased. Similar to acetone, no nucleation mode particles occurred with addition of MTBE under con-dition A (T=44.9◦C, RH=36.3%). The nucleation was com-pletely removed under condition B (T=44.3◦C, RH=81.2%; see Fig. 8, top panel) and nearly suppressed under condition C (T=34.7◦C, RH=31.6%; see Fig. 8, bottom panel).
We do not have a satisfactory explanation for the reduc-tion of nucleareduc-tion mode particles with acetone and MTBE. MTBE is an inert compound that is often used as a solvent in chemical reactions and thus, no chemical reaction with any reactive combustion product is expected.
3.2.5 Alcohols
A selection of alcohols with increasing hydrophobicity was chosen, methanol, 2-propanol, 1-butanol, and 1-hexanol. When alcohol was added to the dilution air, an increase of nu-cleation mode particles was observed. In Fig. 9, a direct com-parison of all four alcohols is depicted under all three condi-tions. The nucleation mode particles were increased in the following order: 2-propanol > (butanol or methanol) > 1-hexanol. Compared to condition A (T=44.9◦C, RH=36.3%) and B (T=44.3◦C, RH=81.2%), the relative increase of nucle-ation mode particles was much less pronounced under con-dition C (T=34.7◦C, RH=31.6%). To explain the variation of
the nucleation process within the alcohols, the surface ten-sion and water solubility of the alcohols were considered in more detail. Since the alcohols investigated have a conspic-uously lower surface tension than water, a surface tension reduction of the nucleation mode particles is expected in the presence of the alcohols. The reduction of surface tension as a function of the alcohol fraction is depicted in Fig. 10 for the alcohols investigated. The surface tensions of the water-alcohol mixtures were calculated by the method of Tamura (Tamura et al., 1955). The hydrophilic hydroxyl group in-teracts via hydrogen bonds with the water phase while the hydrophobic rest of the alcohol is directed away from the droplet and reduced the surface tension. A reduction of sur-face tension increases the concentration of nucleation mode particles since the barrier to nucleate is reduced. The high-est increase in nucleation occurred for 2-propanol followed by methanol, 1-butanol, and 1-hexanol. In Table 5 the wa-ter solubility of the alcohols are documented. Methanol and 2-propanol, containing a short hydrophobic chain, are mis-cible with water and thus, a stronger nucleation is expected than for the more hydrophobic 1-butanol and 1-hexanol. The observed differences of nucleation mode particles can be ex-plained by the water solubility and the surface tension for 2-propanol versus hexanol, butanol, and methanol, for 1-butanol versus 1-hexanol, and for methanol versus 1-hexanol (see Fig. 9). In all these cases, an increasing water solubility and a decreasing surface tension led to stronger nucleation. Nevertheless, the experimental results obtained for methanol and 1-butanol cannot be explained by the water solubility and surface tension since both alcohols had a similar effect on the nucleation mode particles.
4 Conclusions
The role of organic vapors in the dilution air of diesel ex-haust was investigated at constant vehicle speed. Three different settings of conditions A (T=44.9◦C, RH=36.3%), B (T=44.3◦C, RH=81.2%), and C (T=34.7◦C, RH=31.6%) were defined by the two crucial nucleation parameters, sam-ple humidity and samsam-ple temperature. All relevant dilution parameters were controlled in a narrow range. It has to be noted that a total dilution ratio of 80 applied in this study might be lower than under real world conditions. Increased humidity initiated nucleation at the higher sample tempera-ture and increased the existing nucleation mode at the lower sample temperature. As soon as the humidity initiated the nucleation process, the concentration of nucleation particles showed a linear correlation with relative humidity of the sam-ple. The increase of nucleation mode particles at a sample temperature of 44.9◦C was about 40% higher than at a sam-ple temperature of 34.7◦C.
It was observed that organic compounds played a key role in nucleation. Because there is little knowledge of the chem-ical composition of the organic compounds involving in the
formation of nucleation particles, we studied a broad selec-tion of organic compounds. Aliphatic hydrocarbons (hexane and cyclohexane) turned out to be without effect on the nu-cleation process due to their high volatility. Only high con-centrations of toluene led to an increase of nucleation mode particles. However, hydrophobic compounds without any functional groups and with vapor pressure equal or higher than toluene are unlikely to substantially contribute to the nucleation mode particles of diluted diesel exhaust. No uni-form effect was observed on the nucleation mode particles when aniline was added into the dilution air. However, the effect was weak under all conditions and thus, aniline plays a minor role in the formation and growth of nucleation mode particles in diluted diesel exhaust. Alcohols generally in-creased nucleation mode particles. Two parameters may af-fect the potential of nucleation, reduction of surface tension and water solubility. With exception of the comparison be-tween methanol and 1-butanol, the experimental results can be explained by the water solubility and surface tension: In-creasing water solubility and deIn-creasing surface tension led to stronger nucleation. 2-propanol, with the highest reduc-tion in surface tension and water miscibility, increased nucle-ation most. The lower potential for nuclenucle-ation of the water miscible methanol can be explained by the lower reduction of the surface tension compared to 2-propanol. Nucleation mode particles were less influenced by the more hydropho-bic 1-hexanol. Although 1-hexanol and 1-butanol reduce the surface tension to a comparable extent, 1-butanol increased the concentration of nucleation mode particles significantly more than 1-hexanol. A possible reason for this finding could be the 13 times higher water solubility of 1-butanol. Acetone and MTBE reduced nucleation mode particles. We presently do not have a satisfactory explanation for this behavior. Fur-ther work has to be undertaken to understand the influence of organic compounds in reduction of nucleation mode particles in more detail.
Acknowledgements. This project was funded by the Swiss Federal Office for Education and Science (BBW). We thank R. Crockett from EMPA for critical review.
Edited by: M. Ammann
References
Abdul-Khalek, I. S., Kittelson, D. B., and Brear, F.: The influence of dilution conditions on diesel exhaust particle size distribution measurements, SAE Technical Paper Series, No. 1999-01-1142, 1999.
CRC-press: CRC Handbook of chemistry and physics, Boca Raton, FL, CRC Press, 1985.
Donaldson, K., Li, X. Y., and MacNee, W.: Ultrafine (nanome-tre) particle mediated lung injury, J. Aerosol. Sci., 29, 553–560, 1998.
Giebl, H., Berner, A., Reischl, G., Puxbaum, H., Kasper-Giebl, A., and Hitzenberger, R.: CCN activation of oxalic and malonic acid
test aerosols with the University of Vienna cloud condensation nuclei counter. J. Aerosol. Sci., 33, 1623–1634, 2002.
Hegg, D. A., Gao, S., Hoppel, W., Frick, G., Caffrey, P., Leaitch, W. R., Shantz, N., Ambrusko, J., and Albrechcinski, T.: Laboratory studies of the efficiency of selected organic aerosols as CCN, Atmos. Res., 58, 155–166, 2001.
Kerminen, V. M., Virkkula, A., Hillamo, R., Wexler, A. S., and Kul-mala, M.: Secondary organics and atmospheric cloud conden-sation nuclei production, J. Geophys. Res.-Atmos., 105, 9255– 9264, 2000.
Khalek, I. A., Kittelson, D. B., and Brear, F.: Nanoparticle growth during dilution and cooling of diesel exhaust: Experimental in-vestigation and theoretical assessment, SAE Technical Paper Se-ries, No. 2000-01-0515, 2000.
Kilgour, J. D., Rattray, N. J., Foster, J., Soames, A., and Hext, P.M.: Pulmonary responses and recovery following single and repeated inhalation exposure of rats to polymeric methylene diphenyl di-isocyanate aerosols, J. Appl. Toxicol., 22, 371–385, 2002. Kim, C. S. and Jaques, P. A.: Respiratory dose of inhaled ultrafine
particles in healthy adults, Philos. Trans. R. Soc. Lond. Ser. A-Math. Phys. Eng. Sci., 358, 2693–2705, 2000.
Kim, D., Gautam, M., and Gera, D.: Parametric studies on the for-mation of diesel particulate matter via nucleation and coagulation modes, J. Aerosol. Sci., 33, 1609–1621, 2002.
Kittelson, D. B.: Engines and nanoparticles: A review, J. Aerosol. Sci., 29, 575–588, 1998.
Kittelson, D. B.: Particle measurement methodology: Comparison of on-road and lab diesel particle size distribution, Proceedings of the 6th International ETH-Conference on Nanoparticle Mea-surements 19.–21. August, 2002.
Kr¨ahenb¨uhl, M. A. and Gmehling, J.: Vapor-pressures of methyl tert-butyl ether, ethyl tert-butyl ether, isopropyl tert-butyl ether, tert-amyl methyl-ether, and tert-amyl ethyl ether. J. Chem. Eng. Data, 39, 759–762, 1994.
Lange, N. A. and Dean, J. A.: Lange’s handbook of chemistry, McGraw-Hill, New York, 1973.
Maricq, M. M., Chase, R. E., and Podsiadlik, D. H.: Vehicle exhaust particle size distributions: A comparison of tailpipe and dilution tunnel measurements, SAE Technical Paper Series, No. 1999-01-1461, 1999.
Mathis, U.: Influencing parameters of nanoparticle formation from diesel exhaust, Proceedings of the 6th International ETH-Conference on Nanoparticle Measurements 19.–21. August, 2002.
Mikkanen, P., Moisio, M., Keskinen, J., Ristim¨aki, J., and Mar-jam¨aki, M.: Sampling method for particle measurements of ve-hicle exhaust, SAE Technical Paper Series, No. 2001-01-0219, 2001.
Mohr, M., Jaeger, L. W., and Boulouchos, K.: The influence of engine parameters on particulate emissions, MTZ worldwide, 62, 686–692, 2001.
Napari, I., Kulmala, M., and Vehkamaki, H.: Ternary nucleation of inorganic acids, ammonia, and water, J. Chem. Phys., 117, 8418–8425, 2002.
Ntziachristos, L., Samaras, Z., Pistikopoulos, P., and Kyriakis, N.: Statistical analysis of diesel fuel effects on particle number and mass emissions, Environ. Sci. Technol., 34, 5106–5114, 2000. Oberd¨orster, G.: Pulmonary effects of inhaled ultrafine particles,
Int. Arch. Occup. Environ. Health, 74, 1–8, 2001.
Petrovic, S., Urch, B., Brook, J., Datema, J., Purdham, J., Liu, L., Lukic, Z., Zimmerman, B., Tofler, G., Downar, E., Corey, P., Tarlo, S., Broder, I., Dales, R., and Silverman, F.: Cardiorespira-tory effects of concentrated ambient PM2.5: A pilot study using controlled human exposures, Inhal. Toxicol., 12, 173–188, 2000. Poling, B. E., Prausnitz, J. M., and O’Connell, J. P.: The properties
of gases and liquids, McGraw-Hill, New York, 2001.
Pope, C. A.: Review: Epidemiological basis for particulate air pol-lution health standards, Aerosol Sci. Technol., 32, 4–14, 2000. Poulopoulos, S. G. and Philippopoulos, C. J.: The effect of adding
oxygenated compounds to gasoline on automotive exhaust emis-sions, J. Eng. Gas. Turbines Power-Trans. ASME, 125, 344–350, 2003.
Sakurai, H., Tobias, H. J., Park, K., Zarling, D., Docherty, S., Kittel-son, D. B., McMurry, P. H., and Ziemann, P. J.: On-line measure-ments of diesel nanoparticle composition and volatility, Atmos. Environ., 37, 1199–1210, 2003.
Seinfeld, J. H. and Pandis, S. N.: Atmospheric chemistry and physics from air pollution to climate change, Wiley, New York, 1998.
Shi, J. P. and Harrison, R. M.: Investigation of ultrafine particle formation during diesel exhaust dilution, Environ. Sci. Technol., 33, 3730–3736, 1999.
Soskolne, C. L., Zeighami, E. A., Hanis, N. M., Kupper, L. L., Herrmann, N., Amsel, J., Mausner, J. S., and Stellman, J. M.: Laryngeal-cancer and occupational exposure to sulfuric-acid, Am. J. Epidemiol., 120, 358–369, 1984.
Swenberg, J. A. and Beauchamp, R. O.: A review of the chronic toxicity, carcinogenicity, and possible mechanisms of action of inorganic acid mists in animals, Crit. Rev. Toxicol., 27, 253–259, 1997.
Sydbom, A., Blomberg, A., Parnia, S., Stenfors, N., Sandstrom, T., and Dahlen, S. E.: Health effects of diesel exhaust emissions, Eur. Resp. J., 17, 733–746, 2001.
Tamura, M., Kurata, M., and Odani, H.: Practical method for esti-mating surface tensions of solutions, Bull. Chem. Soc. Jpn., 28, 83–88, 1955.
Tobias, H. J., Beving, D. E., Ziemann, P. J., Sakurai, H., Zuk, M., McMurry, P. H., Zarling, D., Waytulonis, R., and Kittelson, D. B.: Chemical analysis of diesel engine nanoparticles using a nano-DMA/thermal desorption particle beam mass spectrometer, Environ. Sci. Technol., 35, 2233–2243, 2001.
Vogt, R., Scheer, V., Casati, R., and Benter, T.: On-road measure-ment of particle emission in the exhaust plume of a diesel pas-senger car, Environ. Sci. Technol., 37, 4070–4076, 2003. Yu, F. Q.: Chemiions and nanoparticle formation in diesel engine
exhaust, Geophys. Res. Lett., 28, 4191–4194, 2001.
Yu, F. Q.: Chemiion evolution in motor vehicle exhaust: Further ev-idence of its role in nanoparticle formation, Geophys. Res. Lett., 29, art. no.-1717, 2002.
Yu, S. C.: Role of organic acids (formic, acetic, pyruvic and oxalic) in the formation of cloud condensation nuclei (CCN): a review, Atmos. Res., 53, 185–217, 2000.
Zhang, K. M. and Wexler, A. S.: A hypothesis for growth of fresh atmospheric nuclei, J. Geophys. Res.-Atmos., 107, art. no. 4577, 2002.