HAL Id: hal-00300976
https://hal.archives-ouvertes.fr/hal-00300976
Submitted on 7 Feb 2006HAL is a multi-disciplinary open access
archive for the deposit and dissemination of sci-entific research documents, whether they are pub-lished or not. The documents may come from teaching and research institutions in France or abroad, or from public or private research centers.
L’archive ouverte pluridisciplinaire HAL, est destinée au dépôt et à la diffusion de documents scientifiques de niveau recherche, publiés ou non, émanant des établissements d’enseignement et de recherche français ou étrangers, des laboratoires publics ou privés.
Cloud condensation nuclei properties of model and
atmospheric HULIS
E. Dinar, I. Taraniuk, E. R. Graber, S. Katsman, T. Moise, T. Anttila, T. F.
Mentel, Y. Rudich
To cite this version:
E. Dinar, I. Taraniuk, E. R. Graber, S. Katsman, T. Moise, et al.. Cloud condensation nuclei prop-erties of model and atmospheric HULIS. Atmospheric Chemistry and Physics Discussions, European Geosciences Union, 2006, 6 (1), pp.1073-1120. �hal-00300976�
ACPD
6, 1073–1120, 2006 CCN properties of HULIS E. Dinar et al. Title Page Abstract Introduction Conclusions References Tables Figures J I J I Back CloseFull Screen / Esc
Print Version
Interactive Discussion
EGU Atmos. Chem. Phys. Discuss., 6, 1073–1120, 2006
www.atmos-chem-phys.org/acpd/6/1073/ SRef-ID: 1680-7375/acpd/2006-6-1073 European Geosciences Union
Atmospheric Chemistry and Physics Discussions
Cloud condensation nuclei properties of
model and atmospheric HULIS
E. Dinar1, I. Taraniuk1, E. R. Graber2, S. Katsman1, T. Moise1, T. Anttila3, T. F. Mentel3, and Y. Rudich1
1
Department of Environmental Sciences, Weizmann Institute of Science, Rehovot 76 100, Israel
2
Institute of Soil, Water and Environmental Sciences, The Volcani Center, A.R.O., Bet Dagan 50 250, Israel
3
Institute for Tropospheric Chemistry, Research Center J ¨ulich, J ¨ulich Germany
Received: 22 December 2005 – Accepted: 4 January 2006 – Published: 7 February 2006 Correspondence to: Y. Rudich (yinon.rudich@weizmann.ac.il)
ACPD
6, 1073–1120, 2006 CCN properties of HULIS E. Dinar et al. Title Page Abstract Introduction Conclusions References Tables Figures J I J I Back CloseFull Screen / Esc
Print Version
Interactive Discussion
EGU Abstract
Humic like substances (HULIS) have been identified as a major fraction of the or-ganic component of atmospheric aerosols. These large multifunctional compounds of both primary and secondary sources are surface active and water soluble. Hence, it is expected that they could affect activation of organic aerosols into cloud droplets.
5
We have compared the activation of aerosols containing atmospheric HULIS extracted from fresh and slightly aged smoke particles and from daily pollution particles to ac-tivation of size fractionated fulvic acid from an aquatic source (Suwannee River fulvic acid), and correlated it to the estimated molecular weight and measured surface ten-sion. A correlation was found between CCN-activation diameter of SRFA fractions and
10
number average molecular weight of the fraction. The lower molecular weight frac-tions activated at lower critical diameters, which is explained by the greater number of solute species in the droplet with decreasing molecular weight. The three aerosol-extracted HULIS samples activated at lower diameters than any of the size-fractionated or bulk SRFA. By considering estimated number average molecular weight (MN),
mea-15
sured surface tension (ST) and activation diameters, the K ¨ohler model was found to account for activation diameters, provided that accurate physico-chemical parameters are known.
1. Introduction
Atmospheric aerosol play important roles in numerous atmospheric processes such as
20
cloud formation, modification of cloud properties, heterogeneous chemistry, and visibil-ity degradation, all of which affect climate forcing and air quality (IPPC, 2001; Andreae et al., 2005; Hansen et al., 2005; Kaufman et al., 2005; Koren et al., 2005; Lohmann and Feichter, 2005). Understanding and predicting aerosol particles’ climatic effects requires knowledge of their hygroscopic properties at sub and super saturation
con-25
ACPD
6, 1073–1120, 2006 CCN properties of HULIS E. Dinar et al. Title Page Abstract Introduction Conclusions References Tables Figures J I J I Back CloseFull Screen / Esc
Print Version
Interactive Discussion
EGU the major part of the inorganic aerosol fraction, their hygroscopic behavior has been
widely investigated and has been incorporated in modeling studies of simplified pure salts or aerosols composed of two or more IOS species (Heintzenberg, 1989; Clegg et al., 1998; Ansari and Pandis, 1999; Brechtel and Kreidenweis, 2000; Martin et al., 2003; Schlenker et al., 2004; Kreidenweis et al., 2005; Topping et al., 2005). Recent
5
field measurements, however, indicate that the mass fraction of organic compounds in fine atmospheric aerosols ranges from ∼20 to 90 wt% (depending on the location and source) (Saxena and Hildemann, 1996; Jacobson et al., 2000; Roberts et al., 2001; Putaud et al., 2004; Kanakidou et al., 2005). Laboratory and modeling studies em-phasize the importance of this organic fraction for particle properties, and hence their
10
role in various atmospheric processes (Shulman et al., 1996; Laaksonen et al., 1998; Cooke et al., 1999; Lohmann et al., 2000; Chung and Seinfeld, 2002; Rudich, 2003; McFiggans et al., 2005; Mircea et al., 2005). The effects of the organic fraction on aerosol-water vapor interactions depend mainly on three parameters: 1) solubility in water, 2) extent of dissociation in aqueous solution, and 3) effect on surface tension
15
(ST).
Several studies have focused on the effect of organic aerosol on cloud droplet nu-cleation (where aerosol particles act as cloud condensation nuclei (CCN)) and on par-ticles’ hygroscopic growth (Facchini et al., 1999; Brooks et al., 2004; Gysel et al., 2004; Ervens et al., 2005). A recent modeling study by Ervens et al. (2005) showed
20
that surface-active compounds with molecular weight higher than 200 AMU have the greatest potential to increase the cloud number concentration (more so at low updraft velocities), and hence the greatest potential to alter cloud properties. CCN activation studies of hydrophilic or hydrophobic multiple component organic-inorganic mixtures (including mixed and coated particles) have resulted in both positive and negative
ef-25
fects on activation depending on the specific system investigated (Cruz and Pandis, 1998; Raymond and Pandis, 2003; Shantz et al., 2003; Bilde and Svenningsson, 2004; Abbatt et al., 2005).
thou-ACPD
6, 1073–1120, 2006 CCN properties of HULIS E. Dinar et al. Title Page Abstract Introduction Conclusions References Tables Figures J I J I Back CloseFull Screen / Esc
Print Version
Interactive Discussion
EGU sands of individual species (Saxena and Hildemann, 1996), each contributing only a
small mass fraction towards the overall organic matter. Due to its importance in CCN activation, the organic fraction in atmospheric aerosols is frequently classified on the basis of water solubility, with the water soluble organic carbon (WSOC) fraction mak-ing up the major portion of atmospheric organic matter (Saxena and Hildemann, 1996;
5
Facchini et al., 1999; Zappoli et al., 1999).
More than 4 decades ago, Went (1960) suggested that photochemical oxidation of primary volatile and semivolatile organic compounds can produce secondary polymers of high carbon content that may be involved in cloud droplet and haze particle forma-tion. Recent studies of rural and urban particles (Hildemann et al., 1996; Havers et
10
al., 1998; Decesari et al., 2001; Samburova et al., 2005), fogwater (Facchini et al., 2000; Krivacsy et al., 2000; Herckes et al., 2002; Cappiello et al., 2003), marine par-ticulate samples (Tervahattu et al., 2002), and biomass burning aerosols (Hoffer et al., 2004, 2005) concluded that 20 to 70 wt% of the WSOC fraction consists of high molecular weight (HMW) polycarboxylic acids (Graber and Rudich, 2006). These
com-15
pounds, consisting of a heterogeneous mixture of structures containing aromatic, phe-nolic and acidic functional groups (Decesari et al., 2001; Krivacsy et al., 2001; Varga et al., 2001; Kiss et al., 2002; Mayol-Bracero et al., 2002; Diallo et al., 2003; Gy-sel et al., 2004), have certain similarities to humic substances (HS) from terrestrial and aquatic sources. Therefore, these aerosol-associated compounds are referred
20
to in the atmospheric chemistry literature as HUmic-LIke Substances (HULIS). Accu-mulating evidence shows that HULIS may form in atmospheric particulate matter via photooxidation of primary biogenic and anthropogenic precursors, or may be directly emitted from soils, vegetation, biomass burning and soot automotive exhaust (Gao et al., 2004, 2004; Hoffer et al., 2004; Kalberer et al., 2004; Samburova et al., 2005).
25
Organic compounds in atmospheric aerosol particles alter the physical properties of aerosols substantially compared to pure IOS particles, mostly by reducing water uptake, and by retaining water to lower relative humidities (RH). These effects often result from their limited solubility and possible effects on ST, which depends upon their
ACPD
6, 1073–1120, 2006 CCN properties of HULIS E. Dinar et al. Title Page Abstract Introduction Conclusions References Tables Figures J I J I Back CloseFull Screen / Esc
Print Version
Interactive Discussion
EGU molecular size and structure (Saxena and Hildemann, 1996; Shulman et al., 1996;
Facchini et al., 2000). Many studies have focused on the effects of well-defined, small pure organic compounds on CCN activation (Cruz and Pandis, 1997; Corrigan and No-vakov, 1999; Giebl et al., 2002; Raymond and Pandis, 2002, 2003; Kumar et al., 2003; Bilde and Svenningsson, 2004; Abbatt et al., 2005; Abdul-Razzak and Ghan, 2005;
5
Hartz et al., 2005; VanReken et al., 2005). Some have also studied these properties for well-defined mass/molar ratio mixtures of pure organic-IOS particles (Brooks et al., 2002; Choi and Chan, 2002; Prenni et al., 2003; Raymond and Pandis, 2003; Pant et al., 2004; Henning et al., 2005). However, the role of ST on cloud droplet growth is still not well quantified, despite major efforts (Shulman et al., 1996; Facchini et al., 1999,
10
2000; Abbatt et al., 2005; Ervens et al., 2005), mainly due to poor chemical physical characterization of real organic compounds present in atmospheric aerosols.
Despite their widespread occurrence, studies on the CCN properties of HULIS are scarce. A few laboratory studies focused on the effect of pure humic substances (HS) and/or their combination with IOS upon sub saturation hygroscopic growth (Chan and
15
Chan, 2003; Brooks et al., 2004; Gysel et al., 2004; Svenningsson et al., 2005). To the best of our knowledge, there has been only one study of CCN activation of pure and mixed aerosols containing humic and fulvic acids (HA and FA, respectively) from commercial sources (Svenningsson et al., 2005), however, no such study has been performed on aerosols containing pure HULIS obtained from atmospheric samples.
20
In this study we present a comparison of critical diameters for droplet activation (Dc) under SS conditions of purified and size-fractionated commercial FA (Suwannee River Fulvic Acid, SRFA) of aquatic origin to those of FA-HULIS extracted from collected wood burning smoke and pollution particles. The goal is to relate activation properties under atmospherically-relevant SS conditions to chemical properties (mainly ST and
25
molecular weight) of the model HS and airborne HULIS. Finally, we investigate whether the existing modeling framework (using K ¨ohler theory for activation) can account for the experimental observations, and test the sensitivity of the predictions to the various physico-chemical parameters.
ACPD
6, 1073–1120, 2006 CCN properties of HULIS E. Dinar et al. Title Page Abstract Introduction Conclusions References Tables Figures J I J I Back CloseFull Screen / Esc
Print Version
Interactive Discussion
EGU 2. Experimental
2.1. Aerosol sampling and HULIS extraction
Aerosol particles (<10 µm, PM10) were collected on 20.3×25.4 cm QM-A Whatman quartz microfiber filters using a high volume sampler (flow rate 70 m3/h) on the roof of a four story building in a green open urban location (Weizmann Institute, Rehovot,
5
Israel). The filters were pre-baked at 450◦C in open aluminum foil envelopes, sealed and stored at −18◦C. Three samples were collected: 1) Fresh smoke particles (here-after called LBO-night) sampled throughout the night (26–27 May 2005) of an exten-sive, nation-wide wood burning event, with average PM10 mass concentration near the sampling location of 300–400 µg m−3 of smoke, 2) slightly aged wood burning smoke
10
particles (hereafter called LBO-day) sampled during the morning and early afternoon hours immediately following the nighttime fires (27 May 2005), with PM10 mass con-centrations of 60–180 (µg m−3). The LBO-day sample is dominated by smoke particles (as can be concluded from the high aerosol mass concentrations and the dark color of the collected particles), but could have undergone moderate processing via
photo-15
chemical reactions. 3) The third sample (called 3WSFA) was collected during daytime hours over a three week period (26 July to 16 August 2005), with average PM10 mass concentration of about 25 µg m−3. The sample contains the prevailing local photo-chemical pollution aerosol particles, and is assumed to represent aged particles. The atmospheric conditions during the 3 week period were relatively constant. All mass
20
concentrations were determined by the Israel Ministry of Environment.
HULIS of the fulvic acid type (FA-HULIS) were extracted from the filters and sep-arated from other aerosol components by an isolation procedure developed on the basis of the scheme used by the International Humic Substances Society (IHSS) for separating aquatic humic acid (HA) and FA (http://www.ihss.gatech.edu), and adapted
25
by us for air-borne particulate matter collected on quartz fiber filters. Briefly, filters are subjected to consecutive water and water-base extractions; FA-HULIS, by defi-nition soluble at any pH, were separated from other water soluble and base-soluble
ACPD
6, 1073–1120, 2006 CCN properties of HULIS E. Dinar et al. Title Page Abstract Introduction Conclusions References Tables Figures J I J I Back CloseFull Screen / Esc
Print Version
Interactive Discussion
EGU aerosol organic and inorganic species by preferential absorption onto an intensively
pre-cleaned XAD-8 resin (Supelco Inc.), followed by elution in a basic solution. The eluant was cation-exchanged on an H+-saturated cation-exchange resin (AG MP-50, Bio-Rad Laboratories) to produce protonated acids, and then dried. The freeze-dried samples are stored at room temperature in darkness under vacuum. 18 MOhm
5
Mill-Q water was used for all solutions throughout the study. 2.2. Size fractionation of Suwannee River Fulvic Acid
Suwannee River Fulvic Acid (SRFA, IHSS code 1R101F) of reference grade was ob-tained from the International Humics Substances Society (IHSS) and used as a model for atmospheric HULIS. SRFA was chosen because several previous laboratory studies
10
referred to it as representative of atmospheric HULIS (Fuzzi et al., 2001; Haiber et al., 2001; Mircea et al., 2002; Nenes et al., 2002; Chan and Chan, 2003; Abdul-Razzak and Ghan, 2004; Brooks et al., 2004; Rissman et al., 2004; Kiss et al., 2005; Sam-burova et al., 2005; Svenningsson et al., 2005). The SRFA was de-ashed and cleaned from low molecular weight organic acids and inorganic species by the procedure
de-15
scribed above. This was verified by ion chromatography analysis of the samples. Size fractionation of SRFA was performed by ultrafiltration (UF), providing a coarse subdivision of initially polydisperse material according to an effective size of molecules in solution. The nominal pore sizes of the ultrafiltration membranes do not correspond to the actual molecular mass of the fractionated fulvic material, due mainly to
molec-20
ular conformation and molecule-membrane charge interactions (Schafer et al., 2002), and further analysis is needed for molecular mass determination. The filtration proto-col yielded five size fractions of water-soluble material with nominal molecular weight ranges of 0.2–0.5 kDa, 0.5–1.0 kDa, 1–3 kDa, 3–10 kDa, and 10–30 kDa, denoted F1, F2, F3, F4, and F5, respectively. We estimated the mean molecular weight (MW) of
25
each fraction utilizing correlations available in the literature (see Sect. 2.6). A detailed description of the equipment and procedures used is given in Appendix A.
ACPD
6, 1073–1120, 2006 CCN properties of HULIS E. Dinar et al. Title Page Abstract Introduction Conclusions References Tables Figures J I J I Back CloseFull Screen / Esc
Print Version
Interactive Discussion
EGU 2.3. Atomized solutions
All compounds under investigation were prepared as aqueous solutions: 20–50 mg/L for ammonium sulfate (AS) and SRFA samples (bulk and fractions), and 10–20 mg/L for atmospheric HULIS samples. The solutions were atomized using a TSI constant output atomizer (TSI-3076) operating at 20 PSI (∼2 Standard Liters per Minute (SLM))
5
with dry particle-free pure nitrogen, generating a polydisperse distribution of droplets (mean diameter ∼0.3 µm).
2.4. Activation experiments
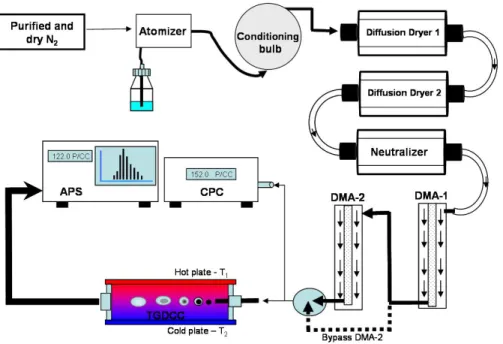
A schematic illustration of the experimental setup is shown in Fig. 1. The atomizer flow (0.6 SLM) entered a 10 L conditioning bulb (the rest of the flow was pumped out)
10
resulting in a conditioning time of ∼16 min before entering 3 silica gel column dryers (RH<3%). The dry polydisperse aerosol passed through a neutralizer (TSI 3012A) to obtain equilibrium charge distribution on the particles. The polydisperse charged dry particle flow entered a home-built Differential Mobility Analyzer (DMA-1) operating with 6 SLM dry (RH<3%) clean sheath flow and fixed at an applied voltage resulting in an
15
output of 0.6 SLM of size selected monodisperse aerosol flow. A second DMA (DMA-2, TSI-3080) operating as scanning mobility particle sizer (SMPS, coupled with a conden-sation particle counter (CPC, TSI-3022)) was used to verify the size distributions, and as an additional size selection step.
The size-selected monodisperse aerosol flow was then directed through a dilution
20
apparatus for precise control of particle number concentration and flow rate. Follow-ing dilution, the monodisperse flow was further separated; 0.3 SLM was directed to the CPC for determination of condensation nuclei (CN) number concentration, while the remainder (0.03–0.2 SLM) entered a home-built Thermal Gradient Diffusion Cloud Chamber (TGDCC) (Kumar et al., 2003).
25
The TGDCC’s top and bottom plates are held at 100% RH by wet 3 mm thick What-man filter papers. By adjusting a temperature gradient between the plates (the average
ACPD
6, 1073–1120, 2006 CCN properties of HULIS E. Dinar et al. Title Page Abstract Introduction Conclusions References Tables Figures J I J I Back CloseFull Screen / Esc
Print Version
Interactive Discussion
EGU temperature, at the center of TGDCC, was always 26.2◦C), effective humidity
condi-tions exceeding 100% RH were selected (Raymond and Pandis, 2002). The SS at the center of the chamber, where the selected particles (D<350 nm) are injected, can be varied between 0.05 to 2%. The aerosol flow was confined to the center of the TGDCC using a humidified nitrogen flow of 0.8–0.97 SLM (RH −100%), bringing the entire flow
5
(aerosol+sheath) to 1 SLM. The TGDCC is almost identical to that described by Ku-mar et al. (2003), the only difference being in the number and position of the injector holes. The original design had ten holes of 0.16 cm in diameter equally spread along the injector tube. We deduced that an injector with 16 holes of the same diameter, concentrated around the center of the tube, results in lower loss of activated particles
10
due to the direct trajectory to the exit. This setup resulted in lower water vapor deple-tion (the RH of the entering aerosol flow is <3%) for the same injector distance, and thus higher SS stability. At the exit of the TGDCC, the total flow was directed to an Aerodynamic Particle Sizer (APS, TSI-3321) which counted and sized particles above 0.5 µm, thus counting only particles that activated to droplets. To reduce droplet loss
15
and evaporation, the APS was placed very close to the chamber’s exit, and the RH in the APS was monitored.
The CN activation efficiency is the ratio between the CN concentration entering the TGDCC (determined by the CPC) to the droplet concentration measured by the APS. By changing the particles’ dry size, a plot of the percent of activated particles
ver-20
sus dry diameter is produced. It was previously shown that a sigmoidal fit adequately simulates these experiments and that the critical activation diameter (Dc) for a sym-metric distribution of particles is the diameter where half of the particles activate, or D50 (Cruz and Pandis, 1997). In all our experiments, the number density of particles in the TGDCC was between 10 and 100 particles cm−3. Activation experiments for
25
all SRFA samples (5 fractions and bulk) and airborne HULIS were carried out at three different SS conditions: 0.2, 0.52 and 1.03%. For each SS and sample, the injector position was adjusted to give 100% activation at large diameters, with the narrowest droplet size distribution. In general, the injector was set further back with decreasing
ACPD
6, 1073–1120, 2006 CCN properties of HULIS E. Dinar et al. Title Page Abstract Introduction Conclusions References Tables Figures J I J I Back CloseFull Screen / Esc
Print Version
Interactive Discussion
EGU SS setting, to allow a longer residence time in which particles could be activated. The
room temperature was always 3–5◦C below the average TGDCC temperature. 2.5. Surface tension measurements
Surface tension was measured using a Rame-Hart pendant drop tensiometer. ST is de-rived from image analysis of the drop shape. The time scale of the experiments ranged
5
from a few seconds to a few hours. The advantages of the pendant drop method are that there is minimal contact of the solution with any surface, and that very little material is required (1 ml of solution). To increase reproducibility and reliability, the instrument was isolated from vibrations and the droplet was held in a temperature and humidity controlled compartment. Surface tension measurements were taken automatically over
10
a preset period of time at a chosen frequency. Mill-Q water was used as a reference sample for all measurements. 3–5 droplets were measured for each concentration. 2.6. UV/VIS spectroscopy for molecular weight and aromaticity estimation
Correlations between absorbance and molecular weight of fulvic acids and aromaticity available in the literature were used for estimating the molecular weight and aromaticity
15
of the SRFA size fractions and HULIS extracted from the collected samples (Chin et al., 1994; Peuravuori and Pihlaja, 1997; Schafer et al., 2002). Sample absorbance was measured with a single-beam UV-VIS Spectrometer (Ultrospec 2100 pro, Biochrom Ltd.). Sample concentrations ranged from 0.010 to 0.014 gC/L, determined on the basis of elemental analysis. Elemental analysis of dry and ash-free samples was
per-20
formed with Carbo Erba EA-1108 Elemental Analyzer.
Absorbance values at 280 nm and 254 nm were used for calculating the molar ab-sorptivities (ε). The wavelength of 280 nm was chosen by Peuravuori and Pihalja (1997) and by Chin et al. (1994) because the π−π* electron transition for most aro-matic hydrocarbons, thought to be structural sub-units in humic substances, occurs
25
ACPD
6, 1073–1120, 2006 CCN properties of HULIS E. Dinar et al. Title Page Abstract Introduction Conclusions References Tables Figures J I J I Back CloseFull Screen / Esc
Print Version
Interactive Discussion
EGU wavelength, as the UV/VIS spectra of humic matter are broad. As a result, Schafer et
al. (2002) worked at 254 nm.
Molar absorptivities at 254 and 280 nm for SRFA and airborne FA fractions ranged from 156 to 507 Lmol−1cm−1 of OC and appeared to fall within the range reported by others for isolated humic fractions (Chin et al., 1994; Peuravuori and Pihlaja, 1997;
5
Schafer et al., 2002). Additional details on the derivation of the correlations and the definitions of number-averaged molecular weight (MN) and weight-averaged molecular weight (MW) are given in Appendix B.
2.7. Determination of acidity content of SRFA
The amount of carboxylic groups in the bulk SRFA and in the size-fractionated samples
10
was determined by potentiometric titrations of aqueous solutions with KOH using a Metler Toledo Automatic Titration instrument. SRFA and aerosol FA solutions in 0.05 M KCL (used to maintain a constant ionic strength) were stored under nitrogen. During titration to pH 10.0 in a nitrogen atmosphere, solutions were continuously de-aerated to eliminate dissolution of carbon dioxide and oxygen. The equivalence point of the
15
carboxylic groups was set at pH 8.0 (Swift, 1996).
3. Results
3.1. System validation
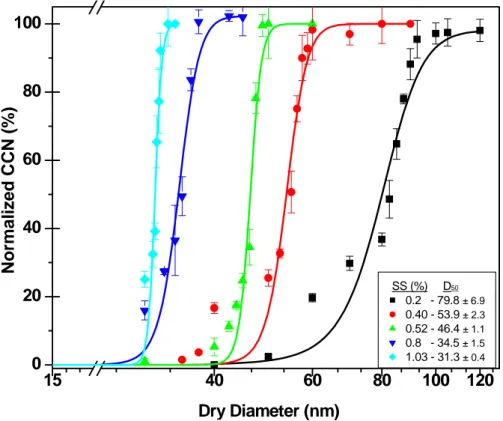
Ammonium sulfate (AS) was used for validating the system’s performance since its CCN activation at different SS conditions is well-known (Tang et al., 1995; Cruz and
20
Pandis, 1997; Corrigan and Novakov, 1999; Brechtel and Kreidenweis, 2000; Raymond and Pandis, 2002; Kumar et al., 2003; Kreidenweis et al., 2005). The system was validated using AS at five different SS conditions: 0.2, 0.4, 0.52, 0.8 and 1.03% SS. The obtained activation curves are presented in Fig. 2. A summary and comparison
ACPD
6, 1073–1120, 2006 CCN properties of HULIS E. Dinar et al. Title Page Abstract Introduction Conclusions References Tables Figures J I J I Back CloseFull Screen / Esc
Print Version
Interactive Discussion
EGU between our experimental results for activation diameters (D50) of AS to calculated
activation diameters using the K ¨ohler equation are given in Table 1. It is concluded that our measured D50 for all tested SS conditions are in good agreement with predicted and measured diameters.
While some studies with TGDCC employed large normalization factors (∼1.4) to
5
correct for 100% activation (Cruz and Pandis, 1997; Corrigan and Novakov, 1999; Brechtel and Kreidenweis, 2000; Kumar et al., 2003), our system does not require such high normalization factors. The normalization factor applied in all of our experiments did not exceed 1.06 in the lower limit and 0.98 in the upper limit. This correction results from loss of large droplets in the TGDCC (in the lower limit) and deviation error between
10
the CPC and the APS (mostly in the upper limit).
While the system is reliable and steady, there is a deviation from the sigmoidal fit at 10–30% activation in the low SS experiments (see Fig. 2 experimental curves of 0.2 and 0.4% SS). We attribute the activation bias at low SS and at small particle sizes to the non-ideal monodisperse size distribution produced by the DMA, as also invoked by
15
Kumar et al. (2003). This conclusion is further supported by the observation of a slight broadening of the distribution towards larger particle sizes in the monodisperse size spectra, which leads to faster activation of the “leaked” large particles compared to the majority of the size-selected particles. It is expected that this effect will be more severe at low SS conditions, where activation is lower. This effect diminished when two size
20
selection steps were used. A tandem size-selection setup was used when a sufficient number of particles remained after the first size selection.
3.2. Molecular weight, aromaticity and elemental composition
The SRFA samples and aerosol-derived FA average molecular weight and aromaticity (as percent of total weight carbon) were estimated using the correlations available
25
in the literature for UV/VIS spectroscopy for aquatic and terrestrial fulvic and humic acids. It should be kept in mind that such correlations have not been used previously for atmospheric HULIS. The results of UV/VIS absorption spectroscopy of the size
ACPD
6, 1073–1120, 2006 CCN properties of HULIS E. Dinar et al. Title Page Abstract Introduction Conclusions References Tables Figures J I J I Back CloseFull Screen / Esc
Print Version
Interactive Discussion
EGU fractionated samples are given in Table 2. The resulting average MN of the SRFA
fractions, estimated by the correlation provided by Schafer et al. (2002) ranged from 450 AMU to 740 AMU, with the bulk SRFA giving 570 AMU. The average MN of the FA-HULIS aerosol extracts are 610, 410 and 500 AMU for the LBO-night, LBO-day and 3WSFA samples, respectively. The number and average molecular size estimates
5
based on UV spectroscopy of the extracted HULIS are larger than previous estimates of the molecular sizes of atmospheric HULIS (Kiss et al., 2003).
A correlation between the nominal molecular weight cutoffs (NMWCO) of the mem-branes used for fractionation with the estimated MN and MW was observed. Likewise, aromaticity was seen to increase with increasing molecular weight, and with it, the
10
brown color of the sample. The bulk SRFA had a color similar to that of F4.
The results of the elemental analysis are shown in Table 3. In general, the oxygen to carbon molar ratio is above 0.5, with increasing O/C ratio as molecular weight in-creases. The obtained elemental content is consistent with values provided for bulk SRFA (http://www.ihss.gatech.edu). The H/C ratio decreases with increasing
molecu-15
lar weight, which is consistent with the higher aromaticity estimated from the UV ab-sorbance. Due to the small amounts of extracted HULIS, we were not able to conduct this analysis for the aerosol extracts.
3.3. Surface tension
Surface tension of 1 g/L aqueous solutions of the size fractionated SRFA samples and
20
the HULIS extracts after 90 min (ST90) equilibration (assumed herein to represent “ap-parent equilibrium”) is reported in Table 2. The most surface active of the SRFA frac-tions is F1 (lowest average MN of 440 AMU), with a ST90 of 57 dyne/cm. ST90 of the other fractions varies from a high of 63 for F2 (average MN of 520 AMU), to 60 for both F3 and F5 (average MN of 620 and 740 AMU, respectively). There was no clear
rela-25
tionship between ST90 and MW. The HULIS samples were substantially more surface active at the same 1 g/L concentration than even the smallest of the SRFA fractions, with ST90 values for HULIS extracted from fresh and aged smoke particles of 45 and
ACPD
6, 1073–1120, 2006 CCN properties of HULIS E. Dinar et al. Title Page Abstract Introduction Conclusions References Tables Figures J I J I Back CloseFull Screen / Esc
Print Version
Interactive Discussion
EGU 44 dyne/cm (LBO-night and LBO-day, respectively), and 56 dyne/cm for the 3 week
photochemical pollution samples (3WSFA). Greater surface activity for HULIS as com-pared with aquatic fulvic acids has been previously reported by Kiss et al. (2005) and Facchini et al. (2000).
3.4. SRFA acidity
5
The results of the titrations of SRFA are given in Table 4. It is concluded that the acidity content per carbon generally decreases with increase of molecular weight with the exception of the lowest average MNfraction (F1). From the titration curves we conclude that SRFA is a weak acid, and at atmospherically relevant concentrations (Facchini et al., 2000), dissociation in aqueous solution will be low. The average number of
10
carboxylic groups per molecule in each fraction can be estimated to range between ∼2 for F1 to ∼3 for F5, and ∼2.7 carboxylic groups per molecule for the bulk SRFA. These values are in the range obtained also by Ritchie and Perdue (2003) for SRFA and Tagliavini et al. (2005) for HULIS extracted from smoke particles in Brazil. Due to scarce amount of extracted and purified material, we were not able to repeat the acidity
15
measurements and elemental analysis measurements for the aerosol extracts. 3.5. CCN activity of size-fractionated SRFA
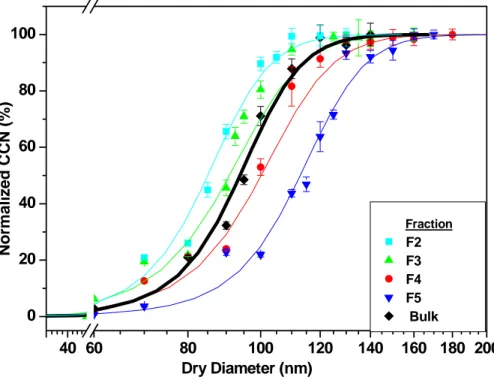
Table 5 shows the activation diameters of the SRFA fractions at three different super saturation conditions. Figure 3 presents the results of activation experiments carried out on SRFA fractions and bulk at a SS of 0.52%. Activation curves are qualitatively
20
similar to those of AS, and can be fit with a sigmoidal growth curve (Fig. 3). It can be seen that the lower molecular weight fractions activate more efficiently than higher molecular weight fractions (i.e. F1 compared with F5), and that the activation diameter increases as MN increases. Activation of bulk SRFA is interim between F3 and F4, consistent with results for estimated molecular weight, and the knowledge that SRFA
25
Sut-ACPD
6, 1073–1120, 2006 CCN properties of HULIS E. Dinar et al. Title Page Abstract Introduction Conclusions References Tables Figures J I J I Back CloseFull Screen / Esc
Print Version
Interactive Discussion
EGU ton et al., 2005). The same behavior is seen at all supersaturations (see Table 5).
Fractions 1 and 2 (MN of 440 and 520 AMU) exhibit almost identical growth and crit-ical activation diameters under the same conditions. Considering that aromaticity is inversely related to molecular weight, it can be stated that as aromaticity increases, activation decreases. The aromaticity trend is also consistent with the sample visible
5
color (discussed above). The emergent general pattern relating activation efficiency to chemical nature is that the browner the fraction, the higher the molecular weight and aromaticity, and the poorer the activation.
3.6. Activation of aerosol-extracted FA-HULIS
Activation experiments were carried out for the three aerosol extracts under the same
10
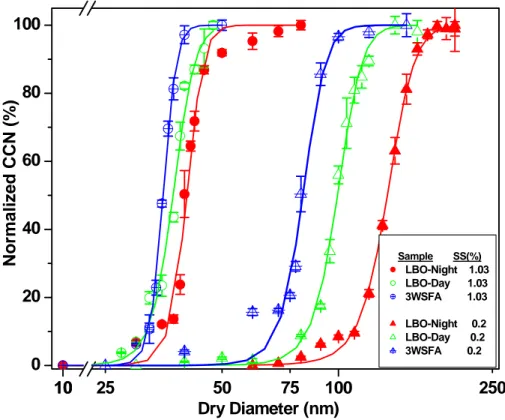
SS conditions as for SRFA samples (SS of 0.2, 0.52 and 1.03%). Due to the small dry mass of samples obtained for each of these samples (<6 mg), no size fractionation was possible for these samples. It was verified by ion chromatography (Falkovich et al., 2004, 2005) that the samples did not contain low molecular weight organic acids. Acti-vation diameters, obtained from a sigmoidal fit to the actiActi-vation curves, are tabulated in
15
Table 5. Figure 4 shows the activation curves of the three samples at SS of 0.2% and 1.03%. It can be seen that the daytime smoke sample (LBO-day) is more CCN-active than the extracts of the fresh nighttime smoke particles (LBO-night). This may suggest possible photochemical processing during day time, mainly by OH-radicals, ozone and possibly UV which leads to enhanced degradation of FA and a decrease of its average
20
molecular weight (Table 2). It is also conceivable that this sample contains some of the prevailing pollution particles. However, given the daily PM loadings at the site, and the dark color of the collected particles, it is unlikely that there was a major contribution of pollution particles to the collected smoke particles. This behavior is also supported by the MW estimated for these samples: 610 AMU for the fresh smoke sample, and
25
410 AMU for the slightly aged sample, and by the lower aromaticity of the daytime sample. The observed lower aromaticity may imply some processing by ozone and OH radicals. The day-time pollution particles sample (3WSFA) was significantly more
ACPD
6, 1073–1120, 2006 CCN properties of HULIS E. Dinar et al. Title Page Abstract Introduction Conclusions References Tables Figures J I J I Back CloseFull Screen / Esc
Print Version
Interactive Discussion
EGU CCN-active than the extracts from both of the smoke samples. However, the estimated
molecular weight (500 AMU) and aromaticity (15%) are higher than the day smoke sample. This may suggest that the HULIS formed in the photochemical pollution par-ticles are different than those in the smoke particles and direct comparison between them is not straightforward. It may also be that the correlations used to estimate MW
5
and aromaticity, based as they are on terrestrial and aquatic FA, are not appropriate for pollution-derived HULIS. Activation experiments for these HULIS samples at SS of 0.52% were also performed, resulting in the same pattern (see Table 2).
4. Discussion
4.1. Activation of model compounds in comparison to authentic HULIS
10
We have attempted to learn how the activation of aerosol-derived HULIS and model aquatic FA depends on their molecular weight, chemical properties and surface activity. There is a clear positive correlation between activation diameter of SRFA fractions and number average molecular weight (MN) of the fraction. Because fulvic acids do not dis-sociate significantly in dilute aqueous solution at the estimated droplet concentrations
15
(1–2 mmol/L (Kiss et al., 2005)), this activation trend can be explained by the simple fact that the lower the molecular weight, the greater the number of solute species in the droplet.
The three aerosol-extracted FA-HULIS samples activate at a lower diameter than any of the size-fractionated or bulk SRFA. At 1.03% SS, there is a 20 nm difference in the
20
activation diameter between the most active SRFA and the most CCN-active extract (Table 5). At SS more relevant to ambient SS, there is an even larger difference in ac-tivation properties between the aerosol HULIS samples and the most CCN-active frac-tion (F1). For example, at SS=0.2%, SRFA fractions 1–3 (MN=440, 520 and 600 AMU) activate at between 160 and 170 nm, while aerosol HULIS extracts (MN=410, 500, and
25
ACPD
6, 1073–1120, 2006 CCN properties of HULIS E. Dinar et al. Title Page Abstract Introduction Conclusions References Tables Figures J I J I Back CloseFull Screen / Esc
Print Version
Interactive Discussion
EGU 4.2. Modeling of activation based on the K ¨ohler Theory
The aim of the modeling efforts was to test if CCN activity of HULIS could be predicted from by the K ¨ohler equation using measured physical-chemical properties and whether surface tension reduction affects activation. The following form of the K¨ohler equation was applied (Seinfeld and Pandis, 1998; Kreidenweis et al., 2005):
5 ln(Swat)= DA p − B Dp3, A= 4MWwσsol RTρw , B= 6i nsMWw πρw . (1)
Here Swat is the saturation ratio of water over a droplet having a diameter Dp, MWw is the molecular weight of water, σsol is the droplet ST, R is the universal gas constant, T is the temperature, ρw is the water density, i is the van’t Hoff factor which accounts for non-ideal behavior of the solution (Pruppacher and Klett, 1980), and ns is the number
10
of solute molecules in the droplet. The last quantity can be written as ns=ms/MWs, where ms and MWs are the solute dry mass and its molecular weight, respectively. It should be noted that various individual compounds dissolved in the droplets are treated here as a single solute.
Given that the values of the required parameters are known, Eq. (1) can be di
fferenti-15
ated to obtain the number of solute molecules needed for droplet activation at a certain water saturation ratio S (Seinfeld and Pandis, 1998). Substituting the saturation ra-tios applied in the CCN measurements for S and converting the resulting numbers of moles to particle size, we obtain the so-called dry activation diameters which can be compared with the measured activation diameters D50 (given in Table 5). The choice
20
of the required parameters is discussed in the following.
The titration results show that the investigated FAs are weak acids, hence are not ex-pected to dissociate significantly in aqueous solution at atmospherically-relevant con-centrations. We neglect also other deviations from a non-ideal behavior. Accordingly, the value of i in Eq. (1) is set equal to unity, or was varied to check the sensitivity of
ACPD
6, 1073–1120, 2006 CCN properties of HULIS E. Dinar et al. Title Page Abstract Introduction Conclusions References Tables Figures J I J I Back CloseFull Screen / Esc
Print Version
Interactive Discussion
EGU activation to possible dissociation. To investigate whether FAs are sufficiently
surface-active to influence CCN activation, calculations were performed using two different values for the solution phase ST: that of water and that measured at the concentration of 1 g/L after 90 min of equilibration. This concentration is within the range of HULIS concentrations calculated for a droplet after activation (Kiss et al., 2005). Particle dry
5
density ρdryis set equal to 1.5 g cm−3(De Wit et al., 1993). The choice of the remaining parameter, MWs, is discussed in the next paragraph.
Individual compounds comprising a FA sample can be described with a continuous distribution and thus the total number of molecules in a sample, ntot, and its mass, mtot, are obtained by integrating over the size distribution:
10 ntot = MW+ Z MW− n(MW )d MW , mtot = MW+ Z MW− n(MW )MW d MW , (2)
where n(MW) is the distribution function and (MW−, MW+) is the molecule size range in the sample. In the K ¨ohler equation given by Eq. (1), all individual species in the sample are described by a single compound. Therefore MWs is an “effective” mole weight which relates the number of molecules present in the sample with the sample
15
total mass, i.e. ntot=mtot/MWs. Combining this equation with Eq. (2) yields:
MWs = MW+ R MW− n(MW )MW d MW MW+ R MW− n(MW )d MW (3)
Using the correlations (Chin et al., 1994; Peuravuori and Pihlaja, 1997; Schafer et al., 2002), it is possible to estimate the molecular weight, as described above. This is done by relating the UV peak absorbance h to the mass. Assuming that the proportionality
ACPD
6, 1073–1120, 2006 CCN properties of HULIS E. Dinar et al. Title Page Abstract Introduction Conclusions References Tables Figures J I J I Back CloseFull Screen / Esc
Print Version
Interactive Discussion
EGU constant does not depend significantly on the molecular size, we obtain the following
equation for MWs: MWs ≈ MW+ R MW− h(MW )d MW MW+ R MW− (h(MW )/MW )d MW = MWn, (4)
where h(MW) is the absorbance of species having a molar weight MW and MN is the number-averaged molecular weight. Equation (4) shows that MN serves as a proxy for
5
MWsin Eq. (1) when droplets contain a number of individual weakly or non-dissociating compounds.
4.2.1. Model calculations versus measurements
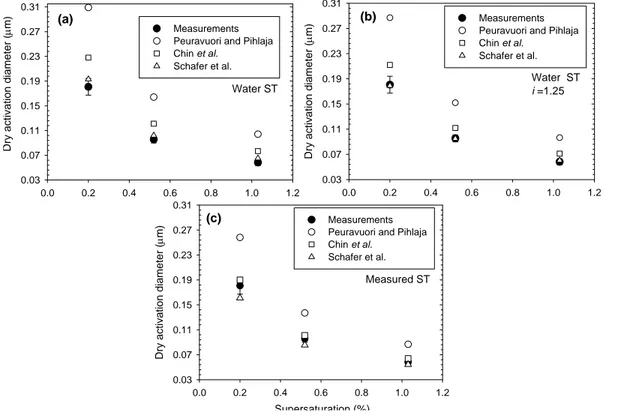
The dry activation diameters (Dcalc) were calculated using the above-described ap-proach and compared with the experimentally determined activation diameters D50.
10
Results are shown separately for the bulk- and size-fractionated samples in Figs. 5– 6, respectively. Several correlations between absorbance and MN were employed in this study to estimate the number-averaged molecular weights for both the bulk and size-fractionated samples (see Sect. 3.2). In order to find the one most consistent with CCN measurements, the K ¨ohler calculations were initially repeated using the molecular
15
weight estimates from each of the correlations. Figure 5a shows the calculated acti-vation diameter for the bulk sample using the three different UV absorbance-molecular weight correlations and assuming no dissociation of the acids (i.e. the van’t Hoff factor (i ) is unity), and a surface tension of water. It can be seen that the calculations over-predict the activation diameter by 10–100%, and that the correlation that most closely
20
reproduces the observed activation diameters for the bulk sample is that of Schafer et al. (2002), with that of Chin et al. (1994) being about 20%–30% less accurate. The correlation of Peuravuori and Pihalja (1997) yields significantly larger dry activation
di-ACPD
6, 1073–1120, 2006 CCN properties of HULIS E. Dinar et al. Title Page Abstract Introduction Conclusions References Tables Figures J I J I Back CloseFull Screen / Esc
Print Version
Interactive Discussion
EGU ameters, i.e. the molecular weight estimates for the bulk samples and the size-fractions
are too high to be commensurable with the CCN measurements. The discrepancies increase with the increasing molecular weight and supersaturation. This behavior is repeated in all calculations, hence we conclude that the MW estimates from the corre-lation of Schafer et al. (2002) are most suitable for our samples.
5
In Fig. 5b, the calculations are repeated, using the same correlations for MW esti-mates, and again setting the surface tension to that of water. In these calculations, however, it is also assumed that some dissociation of the FA occurs. Hence, i was var-ied to reach best agreement between the estimation based on the Schafer et al. (2004) correlation and the observations. It was found that i=1.25 reproduces a good
agree-10
ment with the observations. This van’t Hoff factor is consistent with the 20% disso-ciation which can be estimated from the titrations performed here. In Fig. 5c, i was set to unity, and the surface tension was set to the values measured in the labora-tory. This figure shows that the measured lower surface tensions can account for the overestimation of the activation diameter presented in Fig. 5a.
15
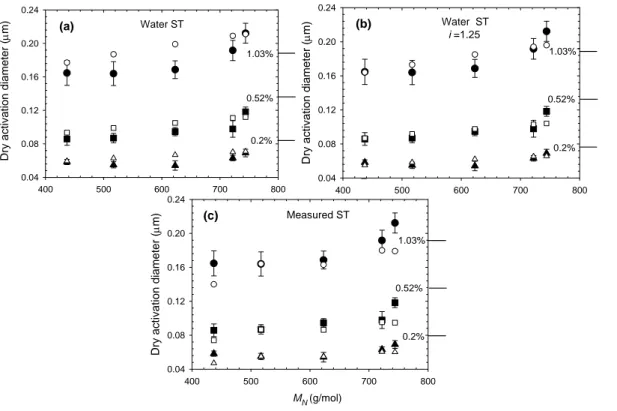
In Fig. 6, the same calculations are repeated for the different SRFA fractions, and for the three different supersaturations. In general, one can again conclude that setting the van’t Hoff factor to 1.25, or setting surface tension equal to measured values can better explain the observed activation diameters. Comparison of D50 for the fraction with average MN of 620 AMU and those for bulk samples shows that the latter size
20
range is the closest to the bulk sample in terms of the CCN activation, in agreement with the activation measurements.
With the behavior observed for the SRFA bulk and the fractions, it is possible to conclude that the surface tension does not play a major role in the activation of SRFA samples and that the activation is dominated by the concentration and the slight
disso-25
ciation of the SRFA. It should be noted that the STs measured at equilibrium might be substantially different compared with the instantaneous surface tension close to acti-vation. This is due to possible higher concentrations and to kinetic effects observed in the surface tension measurements which, considering the short timescale of the CCN
ACPD
6, 1073–1120, 2006 CCN properties of HULIS E. Dinar et al. Title Page Abstract Introduction Conclusions References Tables Figures J I J I Back CloseFull Screen / Esc
Print Version
Interactive Discussion
EGU activation, may have prevented the droplets from reaching an equilibrium ST value
dur-ing activation. The HULIS concentrations in the droplets at the onset of activation may exceed that of 1 g/L used for equilibrium ST measurements.
We performed an additional sensitivity study investigating the effect of the particle dry density ρdry for CCN activity predictions. The calculations (not illustrated by a figure)
5
showed that changing ρdryfrom 1.5 to 1.0 g cm−3increases Dcalcby approximately 10% and consequently, ρdryis of a secondary importance compared to Ms and σsol.
To summarize, the SRFA calculation results show that the CCN activation behav-ior of SRFA particles can be successfully predicted using the traditional K ¨ohler theory provided that the relevant physico-chemical properties are well characterized,
espe-10
cially surface activity, degree of dissociation, and statistical properties of the molecular weight distribution. However, we cannot uniquely determine the relative contribution of dissociation versus surface tension in the case of SRFA activation.
4.2.2. K ¨ohler calculations for FA extracted from aerosol particles
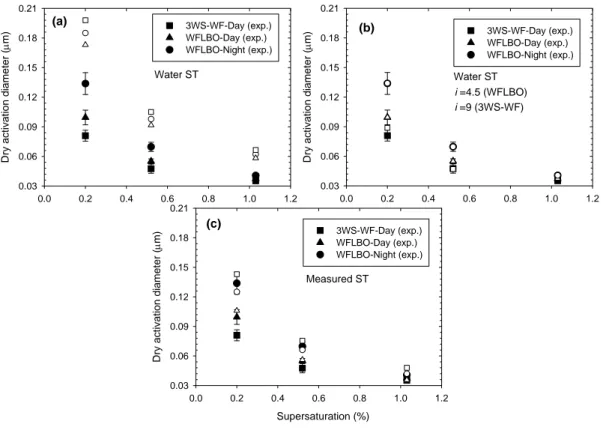
Figures 7a, b and c show the results of CCN activation calculations based on the K ¨ohler
15
theory together with variations in van’t Hoff factor and with ST measurements for the sample extracts. The same approach is applied as for the SRFA samples. The calcula-tions are performed for number molecular weights (MN) assuming that the correlations of Schafer et al. (2002) hold also for the atmospheric FA. In Fig. 7a, ST of water and i=1 were assumed. In Fig. 7b, the van’t Hoff factor was varied to obtain the best agreement
20
between the predicted and measured activation diameters, while surface tension was set to that of water. For the FA extracts from smoke samples (LBO-night and LBO-day) best agreement was achieved with a van’t Hoff factor equal to 4.5 and for the pollution-derived FA (3WSFA), a van’t Hoff factor of 9 had to be assumed in order to achieve a good agreement between calculated measured activation diameters. In Fig. 7c, a van’t
25
Hoff factor of 1, and the measured ST values were used. It can be seen that using the measured ST values, activation diameters can be very well predicted, even if i=1
ACPD
6, 1073–1120, 2006 CCN properties of HULIS E. Dinar et al. Title Page Abstract Introduction Conclusions References Tables Figures J I J I Back CloseFull Screen / Esc
Print Version
Interactive Discussion
EGU is assumed. Considering that HULIS molecules may consist of 3 or more carboxylic
groups per molecule (Tagliavini et al., 2005) , then a van’t Hoff factor of 4.5 could be reasonable if the HULIS was fully dissociated. This is not anticipated to be the case for these weak acids at atmospherically relevant concentrations. Unfortunately, we did not have enough material to determine an acid titration curve for the HULIS extracts,
5
and therefore cannot estimate either pK or degree of dissociation for atmospherically relevant concentrations. However, it is extremely unlikely that a van’t Hoff factor could be as high as 9. Therefore, at least for the 3WSFA sample (and to smaller extent the LBO samples), surface tension may play an important role, or possibly, our molecular weight estimates are inadequate.
10
A dry density of 1.5 g/cm3was assumed in all calculations. Changing the dry density to 1.0 g cm−3increases the predicted activation diameters by 13%, resulting in a worse fit to the data (analysis not shown).
4.3. Atmospheric implications
To our knowledge, this is the first study on the CCN activity of HULIS extracted from
15
sampled particles. We can, however, compare the CCN activity of the bulk SRFA mea-sured here with those obtained by Svenningsson et al. (2005), who meamea-sured the ac-tivation diameters of bulk SRFA. The acac-tivation experiments carried out by Svennings-son et al. (2005) were conducted by selecting a particular aerosol size and scanning super saturation conditions in the CCN spectrometer. As a result, their experiments
20
can not be directly compared with this work. However, for atmospherically relevant SS conditions of 0.2% and 0.5%, the activation diameters of bulk SRFA (180 and 90 nm, respectively) obtained in both studies agree very well.
While we have found that the fractions of SRFA with the lower molecular size activate to droplets at smaller diameters than the bulk SRFA, water soluble FA-HULIS extracted
25
from fresh and slightly aged smoke particles and from air pollution particles activate to cloud droplets more effectively than even the SRFA fraction with the lowest molec-ular weight. For these water soluble organic molecules, activation can be reasonably
ACPD
6, 1073–1120, 2006 CCN properties of HULIS E. Dinar et al. Title Page Abstract Introduction Conclusions References Tables Figures J I J I Back CloseFull Screen / Esc
Print Version
Interactive Discussion
EGU well predicted by the K ¨ohler model, provided that the molecular weight, the amount of
dissociation and the surface tension can be estimated. The calculations suggest that surface tension is more important than dissociation for the activation of the extracted HULIS (assuming the inferred MW estimates). It can also be concluded from Fig. 7c, that the 3WSFA sample behaves differently than the smoke samples, and as a result,
5
the calculation of its activation diameters gives the worst result, compared to that of the LBO-Night and LBO-Day samples.
The activation of the airborne HULIS is qualitatively similar to that of fulvic acid from an aquatic source often used as a model system in laboratory studies, i.e.; Suwan-nee River fulvic acid. However, we found that HULIS derived from 3 different aerosol
10
sources (fresh smoke, aged smoke, and photochemical pollution) are more CCN ac-tive, more surface active than SRFA and generally less aromatic. The measured activa-tion diameters also suggest that chemical aging of these organic species may improve their CCN abilities due to oxidation of larger molecular species to smaller ones (com-pare LBO-day with LBO-night). It is still unclear whether the FA-HULIS from smoke
15
aerosols can be directly compared with those from pollution particles, such that more samples and studies of this sort are needed. It is also clear that standard isolation and chemical characterization methods of HULIS must be adopted for enabling future interpretation and comparison of results from different studies.
By size-fractionating the SRFA sample and measuring the surface tension of the
20
samples, we demonstrated that the activation of SRFA to droplets depends on the physico-chemical parameters (molecular weight, surface tension) of these complex or-ganic species, but we were not always able to show this to the same extent for the aerosol-derived HULIS, as there was not enough material for detailed chemical analy-sis. However, it seems plausible to conclude from the results shown here that surface
25
tension does not play an important role in activation of SRFA, but plays a certain role in promoting activation of the aerosol-derived FA. Finally, the differences in CCN ac-tivation behavior between even the smallest FA fractions and HULIS extracted from aerosol suggest that the materials are not as similar as previously believed.
ACPD
6, 1073–1120, 2006 CCN properties of HULIS E. Dinar et al. Title Page Abstract Introduction Conclusions References Tables Figures J I J I Back CloseFull Screen / Esc
Print Version
Interactive Discussion
EGU A major knowledge gap that still remains open concerns the physical-chemical and
hygroscopic properties of non-water soluble species. Synergetic hygroscopic effects with salts such as ammonium sulfate also need to be studied to assess the role of these species in real atmospheric aerosol particles.
Appendix A 5
Materials and equipment for fractionation procedure
Membranes
YM series Millipore membranes from regenerated cellulose of nominal molecular weight cutoffs (NMWCO) of 0.5, 1, 3, 10 and 30 kDa were used. A membrane of 200 Da NMWCO obtained from KOCH membrane systems was also employed (KOCH:
10
MPF-34). Prior to use, the membranes were flushed by 800 ml of water to remove preservative. When not in use, they were stored in 20% ethanol.
Filtration equipment
The set up consists of a feed cell (volume of 800 mL) and magnetically stirred filtration cell (Amicon, volume of 180 mL, membrane diameter 63 mm) pressurized with nitrogen
15
to 3 kg cm−2. Filtration was carried out at 23±2◦C. Filtration protocol
Sequential filtration beginning with the largest NMWCO membrane (30 kDa) and con-tinuing to the smallest (0.2 kDa) was carried out. A diafitration protocol (constant cell volume) was employed to avoid excessive aggregation in solution during the course of
20
ACPD
6, 1073–1120, 2006 CCN properties of HULIS E. Dinar et al. Title Page Abstract Introduction Conclusions References Tables Figures J I J I Back CloseFull Screen / Esc
Print Version
Interactive Discussion
EGU filled with water and pressurized. During each filtration stage, more than tenfold
vol-ume (1800 mL) of water passed the filtration cell, washing it from species which could pass through the membrane. The filtrate was collected and concentrated to 150 mL in the filtration cell on the membrane with the next (smaller) NMWCO, followed by wash-ing with 1800 mL water. The retentate was freeze-dried and stored in the dark under
5
vacuum. The filtrate with species of NMW<200 Da was discharged. Obtained fractions were periodically tested by ion chromatography to assure absence of low molecular weight organic acids and inorganic ions.
Appendix B
Chin et al. (1994) reported a molar absorptivity (ε) of 389 Lmol−1cm−1 of OC for bulk
10
SRFA at 280 nm. We measured an absorptivity of 306 Lmol−1cm−1of OC at 280 nm, which, considering batch diversity and differences in instrumentation, is not substan-tially different from the previous result.
Additionally, Chin et al. (1994) correlated absorbance at 280 nm for a variety of dif-ferent humic and fulvic acids with aromaticity (measured as % of carbon in aromatic
15
structures) determined by 13C NMR spectroscopy, and number-averaged molecular weight (MN) determined by size exclusion chromatography (SEC) and vapor-pressure osmometry. The relationship between aromaticity and absorbance obtained was:
Aromaticity(%)= 0.05 × ε + 6.74, R2= 0.90 (B1)
A later study correlating absorbance at 280 nm with aromaticity determined by 13C
20
NMR for various humic samples and size fractionated humic samples, reported a sim-ilar equation (Peuravuori and Pihlaja, 1997):
Aromaticity(%)= 0.057 × ε + 3.001, R2= 0.84 (B2)
The maximum difference between the estimations does not exceed 30% for HS where absorptivities range between 100 and 500 Lmol−1cm−1of OC.
ACPD
6, 1073–1120, 2006 CCN properties of HULIS E. Dinar et al. Title Page Abstract Introduction Conclusions References Tables Figures J I J I Back CloseFull Screen / Esc
Print Version
Interactive Discussion
EGU A good correlation (R2=0.97) between weight-averaged molecular weight and
mo-lar absorptivity at 280 nm was found by Chin et al. (1994). They did not develop an equation for number-averaged molecular weight (MN), and we used their data (Table 1, p. 1856) for regression analysis. The resulting relationship is not as good (R2=0.83) as that for weight-averaged molecular weight (MW) but is a useful, semi-predictive tool:
5
MN(Da)= 1.33 × ε + 534, R2= 0.83 (B3)
Peuravuori and Pihlaja (1997) suggested a logarithmic equation:
log10(MN)= 0.003 × ε + 2.452, R2= 0.77 (B4)
No correlation was proposed by Schafer et al. (2002), but using their published data (five samples), a relationship between molar absorptivity at 254 nm and MN (evaluated
10
on the basis of SEC analysis) can be obtained:
MN = 92.1 × ε + 253, R2= 0.72, n = 5 (B5)
Our absorptivities (ranging from 2.0 to 5.3 L mg−1m−1 of OC) are partially outside the narrow range of data (3.05–3.99 L mg−1m−1of OC) in the study of Schafer et al. (2002). The number average molecular weight, MN, represents the total weight of the
15
molecules present divided by the total number of molecules. Most thermodynamic measurements are based on number-average molecular weight, including the colliga-tive properties such as osmotic pressure and freezing point depression. It is calculated by: MN = ∞ P i=0 NiMi ∞ P j=0 Nj (B6) 20
where the number of molecules having a given molecular weight (Mi) is given by Ni, and Nj is the total number of molecules present.
ACPD
6, 1073–1120, 2006 CCN properties of HULIS E. Dinar et al. Title Page Abstract Introduction Conclusions References Tables Figures J I J I Back CloseFull Screen / Esc
Print Version
Interactive Discussion
EGU An alternative measure for the molecular weight of a polymer is the weight
av-erage molecular weight (MW). MW is a weighted average considering the mass of the molecules, so that heavier molecules have relatively more importance than lighter molecules. MW is calculated by:
MW = ∞ P i=0 NiMi2 ∞ P j=0 NjMj (B7) 5
The ratio of weight average to the number average molecular weight is MW/MN known as the polydispersity, an index of the distribution of molecular weights in the mixture. Knowledge of the molecular weight is essential for activation growth modeling, and we have used the three correlation equations in our modeling studies.
Acknowledgements. This work was supported by a grant from the Israel Academy of Sciences 10
(grant #162/05). Aerosol ambient concentrations were provided by the Israel Ministry of En-vironment. T. Anttila acknowledges financial support from the Helsingin Sanomat Centennial. Valuable help from J. Abbatt in the design of the cloud chamber is highly appreciated.
References
Abbatt, J. P. D., Broekhuizen, K., and Kumal, P. P.: Cloud condensation nucleus activity of 15
internally mixed ammonium sulfate/organic acid aerosol particles, Atmos. Environ., 39(26), 4767–4778, 2005.
Abdul-Razzak, H. and Ghan, S. J.: Parameterization of the influence of organic surfactants on aerosol activation, J. Geophys. Res., 109(D3), D03205, doi:10.1029/2003JD004043, 2004. Abdul-Razzak, H. and Ghan, S. J.: Influence of slightly soluble organics on aerosol activation, 20
J. Geophys. Res., 110(D6), D06206, doi:10.1029/2004JD005324, 2005.
Andreae, M. O., Jones, C. D., and Cox, P. M.: Strong present-day aerosol cooling implies a hot future, Nature, 435(7046), 1187–1190, 2005.
ACPD
6, 1073–1120, 2006 CCN properties of HULIS E. Dinar et al. Title Page Abstract Introduction Conclusions References Tables Figures J I J I Back CloseFull Screen / Esc
Print Version
Interactive Discussion
EGU Ansari, A. S. and Pandis, S. N.: Prediction of multicomponent inorganic atmospheric aerosol
behavior, Atmos. Environ., 33(5), 745–757, 1999.
Bilde, M. and Svenningsson, B.: CCN activation of slightly soluble organics: the importance of small amounts of inorganic salt and particle phase, Tellus Ser. B-Chem. Phys. Meteorol., 56(2), 128–134, 2004.
5
Brechtel, F. J. and Kreidenweis, S. M.: Predicting particle critical supersaturation from hy-groscopic growth measurements in the humidified TDMA. Part II: Laboratory and ambient studies, J. Atmos. Sci., 57(12), 1872–1887, 2000.
Brooks, S. D., DeMott, P. J., and Kreidenweis, S. M.: Water uptake by particles containing humic materials and mixtures of humic materials with ammonium sulfate, Atmos. Environ., 10
38(13), 1859–1868, 2004.
Brooks, S. D., Wise, M. E., Cushing, M., and Tolbert, M. A.: Deliquescence be-havior of organic/ammonium sulfate aerosol, Geophys. Res. Lett., 29(19), 1917, doi:10.1029/2002GL014733, 2002.
Cappiello, A., De Simoni, E., Fiorucci, C., Mangani, F., Palma, P., Trufelli, H., Decesari, S., 15
Facchini, M. C., and Fuzzi, S.: Molecular characterization of the water-soluble organic com-pounds in fogwater by ESIMS/MS, Environ. Sci. Technol., 37(7), 1229–1240, 2003.
Chan, M. N. and Chan, C. K.: Hygroscopic properties of two model humic-like substances and their mixtures with inorganics of atmospheric importance, Environ. Sci. Technol., 37(22), 5109–5115, 2003.
20
Chin, Y. P., Aiken, G., and Oloughlin, E.: Molecular-Weight, Polydispersity, And Spectroscopic Properties Of Aquatic Humic Substances, Environ. Sci. Technol., 28(11), 1853–858, 1994. Choi, M. Y. and Chan, C. K.: The effects of organic species on the hygroscopic behaviors of
inorganic aerosols, Environ. Sci. Technol., 36(11), 2422–2428, 2002.
Chung, S. H. and Seinfeld, J. H.: Global distribution and climate forcing of carbonaceous 25
aerosols, J. Geophys. Res., 107(D19), 4407, doi:10.1029/2001JD001397, 2002.
Clegg, S. L., Brimblecombe, P., and Wexler, A. S.: Thermodynamic model of the system H+-NH4+-Na+-SO42–NB3–Cl–H2O at 298.15 K, J. Phys. Chem. A, 102(12), 2155–2171, 1998.
Cooke, W. F., Liousse, C., Cachier, H., and Feichter, J.: Construction of a 1 degrees×1 degrees 30
fossil fuel emission data set for carbonaceous aerosol and implementation and radiative impact in the ECHAM4 model, J. Geophys. Res., 104(D18), 22 137–22 162, 1999.
ACPD
6, 1073–1120, 2006 CCN properties of HULIS E. Dinar et al. Title Page Abstract Introduction Conclusions References Tables Figures J I J I Back CloseFull Screen / Esc
Print Version
Interactive Discussion
EGU laboratory study, Atmos. Environ., 33(17), 2661–2668, 1999.
Cruz, C. N. and Pandis, S. N.: A study of the ability of pure secondary organic aerosol to act as cloud condensation nuclei, Atmos. Environ., 31(15), 2205–2214, 1997.
Cruz, C. N. and Pandis, S. N.: The effect of organic coatings on the cloud condensation nuclei activation of inorganic atmospheric aerosol, J. Geophys. Res., 103(D11), 13 111–13 123, 5
1998.
De Wit, J. C. M., Vanriemsdijk, W. H., and Koopal, L. K.: Proton Binding To Humic Sub-stances.1. Electrostatic Effects, Environ. Sci. Technol., 27(10), 2005—2014, 1993.
Decesari, S., Facchini, M. C., Matta, E., Lettini, F., Mircea, M., Fuzzi, S., Tagliavini, E., and Putaud, J. P.: Chemical features and seasonal variation of fine aerosol water-soluble organic 10
compounds in the Po Valley, Italy, Atmos. Environ., 35(21), 3691–3699, 2001.
Diallo, M. S., Simpson, A., Gassman, P., Faulon, J. L., Johnson, J. H., Goddard, W. A., and Hatcher, P. G.: 3-D structural modeling of humic acids through experimental characterization, computer assisted structure elucidation and atomistic simulations. 1. Chelsea soil humic acid, Environ. Sci. Technol., 37(9), 1783–1793, 2003.
15
Ervens, B., Feingold, G., and Kreidenweis, S. M.: Influence of water-soluble organic carbon on cloud drop number concentration, J. Geophys. Res., 110(D18), D18211, doi:10.1029/2004JD005634, 2005.
Facchini, M. C., Decesari, S., Mircea, M., Fuzzi, S., and Loglio, G.: Surface tension of atmo-spheric wet aerosol and cloud/fog droplets in relation to their organic carbon content and 20
chemical composition, Atmos. Environ., 34(28), 4853–4857, 2000.
Facchini, M. C., Fuzzi, S., Zappoli, S., Andracchio, A., Gelencser, A., Kiss, G., Krivacsy, Z., Meszaros, E., Hansson, H. C., Alsberg, T., and Zebuhr, Y.: Partitioning of the organic aerosol component between fog droplets and interstitial air, J. Geophys. Res., 104(D21), 26 821– 26 832, 1999.
25
Facchini, M. C., Mircea, M., Fuzzi, S., and Charlson, R. J.: Cloud albedo enhancement by surface-active organic solutes in growing droplets, Nature, 401(6750), 257–259, 1999. Falkovich, A. H., Graber, E. R., Schkolnik, G., Rudich, Y., Maenhaut, W., and Artaxo, P.:
Low molecular weight organic acids in aerosol particles from Rondonia, Brazil, during the biomass-burning, transition and wet periods, Atmos. Chem. Phys., 5, 781–797, 2005, 30
SRef-ID: 1680-7324/acp/2005-5-781.
Falkovich, A. H., Schkolnik, G., Ganor, E., and Rudich, Y.: Adsorption of organic compounds pertinent to urban environments onto mineral dust particles, J. Geophys. Res., 109(D2),