HAL Id: hal-01575426
https://hal.archives-ouvertes.fr/hal-01575426
Submitted on 25 Aug 2017
HAL is a multi-disciplinary open access
archive for the deposit and dissemination of
sci-entific research documents, whether they are
pub-lished or not. The documents may come from
teaching and research institutions in France or
abroad, or from public or private research centers.
L’archive ouverte pluridisciplinaire HAL, est
destinée au dépôt et à la diffusion de documents
scientifiques de niveau recherche, publiés ou non,
émanant des établissements d’enseignement et de
recherche français ou étrangers, des laboratoires
publics ou privés.
Reservoir Characterization Using Inversion of a
Combine Set of Geodetic Data, from Salt to
Unconventional Exploitation
Severine Furst, Jean Chery, Bijan Mohammadi, Michel Peyret, Dominique
Dubucq, Antoine Jacq, Philippe Marchina
To cite this version:
Severine Furst, Jean Chery, Bijan Mohammadi, Michel Peyret, Dominique Dubucq, et al.. Reservoir
Characterization Using Inversion of a Combine Set of Geodetic Data, from Salt to Unconventional
Exploitation. 79th EAGE Conference and Exhibition 2017 , Jun 2017, Paris, France. pp.12 - 15,
�10.3997/2214-4609.201700987�. �hal-01575426�
Set of Geodetic Data, from Salt to Unconventional
Exploitation
S. Furst, J. Chéry, B. Mohammadi,
M. Peyret, D. Dubucq, A. Jacques, P. Marchina.
1
Introduction
The exploitation of natural resources in the subsurface is more challenging than ever. Two main issues concern (1) the optimization of reservoir exploitation and (2) the respect of environmental constraints (fauna and flora impacts, induced subsidence). During the prospection stage, oil and gas companies conduct geophysical surveys (seismic reflexion/refraction, borehole seismic, well logging) to estimate the potential of conventional and unconventional reservoirs. While extracting the resource, they can also monitor this extraction using similar surveys. These methodologies have provided stable and reliable results but they remain expensive and limited. To provide additional information about the consequences of extraction, geodetic surveys using GPS, InSAR and tilt measurements can be considered. Although geophysical and geodetic surveys provide numerous data, one can not directly deduce the required information for production optimization and hazard assessment. Geomechanical models are necessary to gather the collected data and therefore to characterize reservoirs and the risks associated to their exploitation.
Reservoir production implies injection and withdrawal of a substantial volume of fluid (Geertsma,
1973; Mossop and Segall,1999). By doing so, the reservoir is subject to volume changes and de-formation. The internal strain induces displacements in the surrounding medium. At the surface, uplift (increase of volume) or subsidence (decrease of volume) can be significant enough to be mea-surable by various instruments with different sensitivities. In order to prevent industrial damage and to assess the environmental impact of resource extraction, the surface deformation caused by a given production scenario must be accurately monitored and predicted. Several studies show the interest of inverting one type of geodetic data to monitor and characterize reservoirs (InSAR: e.g.
Vasco et al.(2008); tilt: e.g. Astakhov et al.(2012)).
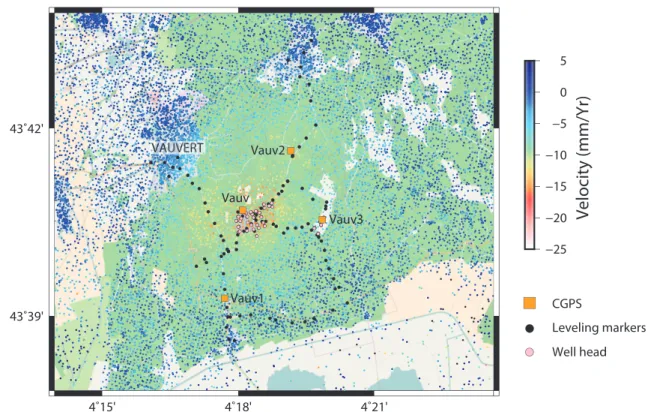
Dataset containing several types of data is seldom for geological reservoirs. For this reason, inversions of multiple datasets are yet uncommon. Our ongoing research aims at combining GPS, InSAR, levelling, tilt, borehole breakouts and gravimetric data from a mining exploitation in Vauvert, France, operated by KemOne (Figure1). From 8 to 12 wells are continuously extracting the salt from lower saliferous layer at a depth ranging from 2000 to 3000 m depth (Figure 2). This configuration provides a good analogous to conventional and non-conventional oil and gas reservoirs. Therefore, Vauvert site and its numerous available data (InSAR, levelling, pressure at wellhead, quantity of injected water, extracted brine with the saturation) appears to be an ideal case for data fusion and inverse problem.
Maisons and Raucoules (2006) used 16 SAR images between 1993-1999 to characterize the subsidence phenomenon observed in Vauvert. By assuming a constant deformation rate through time, they compared InSAR results to levelling data. Our approach intend to combine those data before the inversion. Although viscoelastic models (Bonafede and Ferrari,2009) could be considered in this study, we choose to only construct elastic models to approximate the salt reservoir. By making this assumption and working on Vauvert salt exploitation, we want to find the resolution capacity at depth of our geodetic dataset and to estimate its optimal distribution accordingly to the exploitation goal.
4˚15' 4˚18' 4˚21' 43˚39' 43˚42' −25 −20 −15 −10 −5 0 5
Ve
lo
city (mm/Yr)
Vauv1 Vauv2 Vauv3 Vauv VAUVERT CGPS Leveling markers Well headFigure 1: Distribution of InSAR data (mean velocity along the satellite Line Of Sight) over the site of the salt extraction. The color scale indicates the subsidence with warmer color for more significant subsidence. The bowl of subsidence is centered on the exploitation and has a diameter of about 8 km. Orange squares mark the position of continuous GPS, black dots the levelling markers and pink dots the well head.
2
Method and theory
Both analytical and numerical models can be considered to simulate the surface deformation. The former usually consider simple mathematical relations expressing the surface deformation induced by spherical (Geertsma, 1973; Mogi, 1958; Mossop and Segall, 1999), cylindrical (Yukutake and Tachinaka,1967) or ellipsoidal sources (Davis, 1986;Yang et al.,1988) but also due to shear and tensile faults (Okada,1985) and vertical pipes (Bonaccorso and Davis,1999). Besides, those models assume a homogenous and infinite half space and do not account for complex geometries which can only be treated using numerical models.
In this study, we focus on analytical models to simulate the volume change of a cavity due to salt extraction (Figure2). We develop a mathematical framework and computational implementation for combining and inverting geodetic data of various type (Figure1). Our approach consists in finding the relation between the surface deformation and the distribution of volumetric changes within the reservoir. The changes in volume can be isotropic or anisotropic depending of reservoir properties and fracturation. For this reason, we choose to construct two separate forward models: a superposition of (1) point sources (Mogi,1958;Mossop and Segall,1999) and (2) another built on a superposition of shear and tensile fractures (Okada,1985). Both models consider a semi-infinite elastic body subjected to a change of volume (Figure2). In order to discriminate between distinct sources we use a priori information available at the mining exploitation.
By solving an inverse problem, we aim at estimating the best plausible distribution of volume changes m explaining the observed data di (with i standing for GPS, InSAR, levelling or borehole
strain data).
di= Gim (1)
where Gi is a matrix representing the governing equations linking the model parameters to the
observed data, m and di being vectors. The main difficulty of this theory is the non-uniqueness of
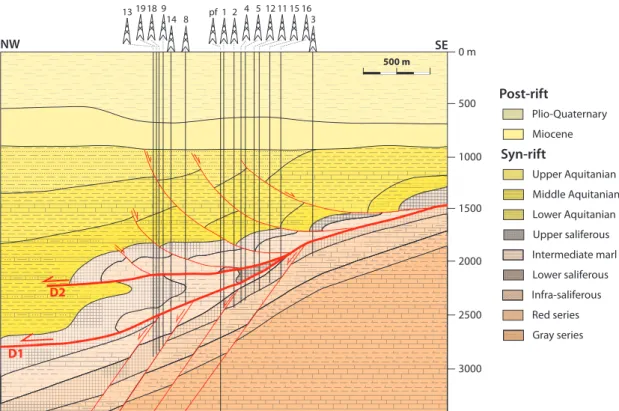
0 m 500 1000 1500 2000 2500 3000 Post-rift Plio-Quaternary Miocene Syn-rift Upper Aquitanian Middle Aquitanian Lower Aquitanian Upper saliferous Intermediate marl Lower saliferous Infra-saliferous Red series Gray series SE NW 500 m D1 D2
Figure 2: Cross-section of the geological structural scheme of the salt exploitation in Vauvert (from
Valette and Benedicto(1995)). The salt is mainly extracted from the lower saliferous layer.
the distance between the observed data d∗i and the predicted data from the forward model di(m),
namely the cost function J (m).
Ji(m) = kd∗i − di(m)k2σ−1 (2)
where the subscript σ−1 means that the L2-norm is weighted by the inverse of the covariance
matrix of the geodetic measurements. Individual cost functions are considered for each type of data (GPS, InSAR, tilt, levelling) and a weighting factor αi is attributed to each functional. The
final cost function corresponds to the linear sum of all the individual functional weighted by their associated αi such as:
J (p) =
4
X
i=1
αiJi (3)
Although we may mathematically optimize αi values for our site configuration, they may depend
on two other factors: the desired physical parameter (e.g. hydraulic fracture orientation) and the cost or quality goal of the operator. These latter factor can help refining the geodetic survey by estimating the best type of data but also their distribution over a selected area.
3
Conclusions
We implemented the above optimization approach by combining multiple geodetic data including Envisat and Sentinel InSAR, continuous and campaign GPS, twenty years of levelling and borehole strain data. Apart from inferring geodetic data to model the volume changes of the reservoir, we propose a suitable physical approach to link volume strain (Mossop and Segall, 1999) to pressure data, volume of injected water, extracted brine and saturation. We searched optimal weighting factors of the functional in order to optimize the geodetic survey. To access reservoir properties, the distribution and the type of data to consider could be supplied according to the issues of the exploited field.
4
Acknowledgements
The PhD of S. Furst is supported by the Total Company and the LabEx NUMEV project (n◦ ANR-10-LABX-20) funded by the "Investissements d’Avenir" French Government program, managed by the French National Research Agency (ANR).
References
Astakhov, D. K., Roadarmel, W. H., Nanayakkara, a. S., and Service, H. (2012). SPE 151017 A New Method of Characterizing the Stimulated Reservoir Volume Using Tiltmeter-Based Surface Microdeformation Measurements. (Mayerhofer 2010):1–15.
Bonaccorso, A. and Davis, P. M. (1999). Models of ground deformation from vertical volcanic con-duits with application to eruptions of Mount St. Helens and Mount Etna. Journal of Geophysical Research, 104:10531.
Bonafede, M. and Ferrari, C. (2009). Analytical models of deformation and residual gravity changes due to a Mogi source in a viscoelastic medium. Tectonophysics, 471(1-2):4–13.
Davis, P. M. (1986). Surface deformation due to inflation of an arbitrarily oriented triaxial el-lipsoidal cavity in an elastic half-space, with reference to Kilauea volcano, Hawaii. Journal of Geophysical Research, 91(B7):7429.
Geertsma, J. (1973). Land subsidence above compacting oil and gas reservoirs. Journal of Petroleum Technology, (June 1973):734–744.
Maisons, C. and Raucoules, D. (2006). Monitoring of slow ground deformation by satellite dif-ferential radar-interferometry . A reference case study . In Solution Mining Research Institute, Brussels.
Mogi, K. (1958). Relations between the eruptions of various volcanoes and the deformations of the ground surfaces around them.
Mossop, A. and Segall, P. (1999). Volume strain within The Geysers geothermal field. Journal of Geophysical Research, 104:29113–29131.
Okada (1985). Surface deformation due to shear and tensile faults in a half-space. International Journal of Rock Mechanics and Mining Sciences Geomechanics Abstracts, 75(4):1135–1154.
Valette, M. and Benedicto, A. (1995). Gravity thrust halotectonics in the extensional Camargue basin (Gulf of Lion margin, SE France). Bulletin de la Société Géologique de France, 166(2):137– 147.
Vasco, D. W., Ferretti, A., and Novali, F. (2008). Reservoir monitoring and characterization using satellite geodetic data: Interferometric synthetic aperture radar observations from the Krechba field, Algeria. Geophysics, 73(6):WA113.
Yang, X.-M., Davis, P. M., and Dieterich, J. H. (1988). Deformation from inflation of a dipping finite prolate spheroid in an elastic half-space as a model for volcanic stressing. Journal of Geophysical Research, 93(7):4249.
Yukutake, T. and Tachinaka, H. (1967). Geomagnetic variation associated with stress change wihin a semi infinite elastic earth caused by a cylindrical force source. Bulletin of the Earthquake Research Institute, 45:785–798.