HAL Id: hal-01675682
https://hal.archives-ouvertes.fr/hal-01675682
Submitted on 4 Jan 2018
HAL is a multi-disciplinary open access
archive for the deposit and dissemination of
sci-entific research documents, whether they are
pub-lished or not. The documents may come from
teaching and research institutions in France or
abroad, or from public or private research centers.
L’archive ouverte pluridisciplinaire HAL, est
destinée au dépôt et à la diffusion de documents
scientifiques de niveau recherche, publiés ou non,
émanant des établissements d’enseignement et de
recherche français ou étrangers, des laboratoires
publics ou privés.
eDOI: Exploratory Degree of Interest Exploration of
Multilayer Networks Based on User Interest
Antoine Laumond, Guy Melançon, Bruno Pinaud
To cite this version:
Antoine Laumond, Guy Melançon, Bruno Pinaud. eDOI: Exploratory Degree of Interest Exploration
of Multilayer Networks Based on User Interest. VIS 2017, Poster session, Oct 2017, Phoenix, United
States. �hal-01675682�
eDOI: Exploratory Degree of Interest
Exploration of Multilayer Networks Based on User Interest
Antoine Laumond* Guy Melanc¸on Bruno Pinaud University of Bordeaux
UMR CNRS 5800 LaBRI, France
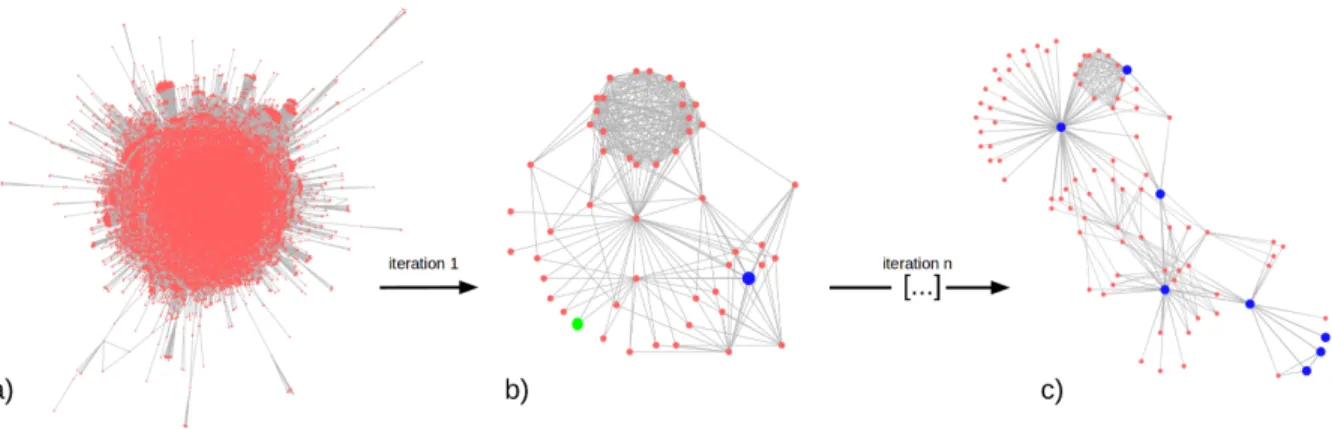
Figure 1: Example of the eDOI process. From a user query, the focus set is first composed by the blue nodes (a) from which a first subgraph of interest is computed. Green nodes selected by the user are added (b) to the focus set before the next iteration. At each iteration a new, increasingly relevant, subgraph is computed according to the actualized focus set. The process is repeated until the user gathers the targeted context of exploration (c).
ABSTRACT
The “zoom and filter” operations dear to the Shneiderman mantra are in reality not well specified in a data exploration context. There is a need to support users and suggest potential directions for ex-ploration, and automatically selects a subset of nodes of interest based on a minimum initial user input. Filtering the data additionally avoids visual cluttering, especially overplotting, often resulting from laying out large networks. This paper explores how the multilayer properties of networks can be used to design a DOI (Degree of In-terest) approach. Layers in a multilayer network bring nuances and must not be considered on an equal basis. We propose a method for extracting, expanding and displaying a sequence of sub-networks to guide users when exploring a multilayer network. Nodes and edges are selected based on an interest score computed for each node specifically taking the layer structure into account.
1 INTRODUCTION
Amongst our research projects, we are working with data experts in Digital Cultural Heritage and bioinformatics. Whatever the domain, the best data-structure to map the data is multilayer networks [2], i.e., networks where nodes are partitioned in layers according to some properties. For example, with Digital Cultural Heritage data, layers contain one type of nodes and represent interactions between institutions, persons, locations or resources which are represented by the nodes. For bioinformatics, we have the so-called “omics” layer (metabolomics, genomics, transcriptomics). Overall, layers bring nuances and must not be considered on an equal basis. The method we propose extracts, expands and displays a sequence of sub-networks to guide users when exploring a multilayer network.
*e-mails: firstname.lastname@u-bordeaux.fr
Nodes and edges are selected based on an interest score computed for each node specifically taking the layer structure into account.
The “zoom and filter” operations dear to the Shneiderman mantra are in reality not well specified in such a data exploration context where the high volume and high connectivity of the network make it very cluttered. There is a strong need to support users and sug-gests potential directions for exploration, and automatically selects a subset of interest based on a minimum initial user input. Filtering the data additionally avoids visual cluttering, especially overplot-ting. Our solution is an adapted and improved Degree-Of-Interest (DOI) [1, 3] based method to facilitate the visualisation and the navigation within multilayer networks.
In the remaining of the paper we briefly present the original DOI of Van Ham and Perer (Sect. 2) then, we detail how we handle navigation (Sect. 3), and finally how we take into account multi-layer aspects (Sect. 4).
2 THEORIGINALDOI METHOD
First published by Furnas [1] and later extended by Van Ham and Perer [3], DOI consists in computing a score of interest for each node of the network according to some criteria to extract a sub-network of interest.
From a user chosen node y (the focus node) and a user query z (e.g., a tag search), the DOI value for a node x is:
DOI(x|y, z) = α.API(x) + β .UI(x, z) + γ.D(x, y) where API (A PriorI) relates to the network topology, U I is the User Interestfor x based on z, and D a distance between nodes x and y. α, β , and γ are constants to modulate the weight of each member. API is often based on a centrality measure and does not need any information given by the user (so it can be computed “a priori”).U I uses a query z given by the user like a tag search, a proximity computation with some values of node attributes or anything else wanted by the user. U I reflects the user will and gives
a higher value to a node if it matches the user query well. D is a distance function between x and y. The higher the value, the closer xand y are. It is most often based on a shortest-path computation but any kind of distance calculation is possible.
As soon as DOI values are calculated for each node, a greedy algorithm builds the sub-network starting from the focus node. Then, its neighbours are put into a candidate list. The node from the candidate list with the highest DOI value is added to the sub-network and its neighbours are put into the list. This procedure is repeated until the desired number of nodes in the sub-network is reached. Edges connecting chosen nodes are also added to the sub-network.
Finally, we obtain a sub-network which gives users a clearer view on the initial network by only keeping interesting nodes/edges. However, in an exploration context where the user query may not be immediately optimal, this method does not offer the opportunity to use a previously computed sub-network and improve the user query. The sub-network can be considered as a one-shot resume of the initial network. Nevertheless, if the wanted information is not there or if the resulting sub-network lacks interest, the user has to restart the whole process from scratch from another focus node without any guarantee of getting a more interesting sub-network. Our method offers an iterative approach which allows to refine the user-query and the focus set which results in a series of sub-network. By construction, the generated sub-networks should be of increasing quality. As a consequence, the series of sub-network may be seen as a history of the user exploration process.
3 ANEXPLORATORYAPPROACH
In Van Ham and Perer work, users’ will is represented by the query zand the starting focus point y. To increase interactivity, users need to interact permanently with the data and not only at the start of the process. Moreover, choosing only one focus node may not be very relevant with multi-layer networks. Instead of a focus node, we use a focus set of nodes, called Y hereafter, and each sub-network is used to refine Y . Each generated sub-network is kept to form a trace of the exploration. Between each sub-network extraction, users can add new focus nodes by using the last generated sub-network to enhance the accuracy of their will. All sub-networks are always generated from the initial graph but the iterative refinement of the focus nodes set should increase the quality of the generated sub-networks.
Formally speaking, contrary to the original DOI measure, more importance is given to the focus nodes because both D and U I use them as parameters:
eDOI(x|y, z) = α.API(x) + β .U Iexp(x, z(Y )) + γ.Dexp(x,Y )
U Iexp(x, z(Y )) stands for the exploratory version of U I. The focus
set Y is now part of it via z which now uses Y to refine the score for each iteration. It means that users start with a query which is refined after each Y update. For example, in Digital Cultural Heritage, one wants to find nodes with a comparable associated resources coverage (e.g., equivalent number of pictures, radio/TV interviews, newspaper articles). In this case, z checks the documents currently used from Y and gives a score to each document x accordingly if it improves the type coverage whether it is a focus node or not.
Dexp is still a distance but computed on Y . It is based on a
centroid computation between x and each focus nodes of Y . Like the original D, a high score means that the elements are closed. It is still possible to use a shortest-path computation or another distance. A node inside the bounding box formed by Y has a high score and, as a consequence more chances to be selected. This bounding box defines a focal zone, a zone in the initial network where candidate nodes for the next sub-network have higher chances to be chosen. This centroid function needs to be carefully defined because users can move the focal zone when a new node is added in Y especially when the new selected node is on the periphery of the sub-network. The focal zone will therefore move and alter the next sub-network.
Moving the focal zone allows the user to easily navigate in the graph without any other specific interaction.
4 ANADAPTATION TOMULTILAYERNETWORKS
Multilayer networks are gaining interest since few years. They should not be analysed like single-layered networks, thus traditional analysis methods need to be updated. Therefore, eDOI deserves a special attention to layers and to inter-layer edges. A simple user query z cannot satisfy all layers in an equivalent manner at the same time. Layers need to be differentiate with a specific query related to each layer. However, if the membership to a layer brings information, edges between nodes belonging to different layers can also be semantically meaningful and must be treated separately. So, the previous formula needs to be enhanced:
eDOI(x|Y, L, z) = α.API(x)+β .U Imulti(x, z(Y, L(x)))+γ.Dexp(x,Y )
where L is a function returning the layer(s) of x. For each layer, a query can be defined according to the user’s strategy even if a node belongs to more than one layer. With the original DOI, each node are treated equivalently, i.e., scores associated to nodes have the same weight. If we have different user functions, to keep a fair comparison, standardization and normalization of the results are mandatory. Another solution is to sort elements based on the user function and work on the ranking instead of the values returned by the function. We are using this latter method.
Links between nodes belonging to different layers also deserve attention. The original DOI has a diffusion function, called a pos-terioriof the DOI process, to allow a very interesting node to give a percentage of its interest to its neighbourhood. This function is useful to avoid isolating an interesting node surrounded by non-interesting ones (the greedy extraction sub-network may miss it). This diffusion process can use a function which, according to the score of an edge, diffuses more or less of the interest. We basically use an U I function which, according to the layers of edge extremities and a user query z, gives a score to this edge to allow diffusion of a variable part of the interest and thus changes the importance of the inter-layer connections.
5 CONCLUSION
Our method, called eDOI, is currently under development and tested by data experts in Digital Cultural Heritage and soon with bioinfor-matics data. The available data fits perfectly with eDOI and allows us to have a meaningful field of experimentation. Preliminary results are promising and we are currently working on more use cases to illustrate more precisely the contributions of eDOI. We plan to de-velop and formalize more functions to support layers and inter-layer connections which are often closely linked to the data.
ACKNOWLEDGMENTS
This work was (partially) funded by the ANR grant BLIZAAR ANR-15-CE23-0002-01 and the FNR grant BLIZAAR IN-TER/ANR/14/9909176.
REFERENCES
[1] G. W. Furnas. Generalized fisheye views. In Proc. of the SIGCHI Conf. on Human Factors in Computing Systems, pp. 16–23. ACM, 1986. doi: 10.1145/22627.22342
[2] M. Kivel, A. Arenas, M. Barthelemy, J. P. Gleeson, Y. Moreno, and M. A. Porter. Multilayer networks. Journal of Complex Networks, (2):203–271, 2014. doi: 10.1093/comnet/cnu016
[3] F. Van Ham and A. Perer. “search, show context, expand on demand”: Supporting large graph exploration with degree-of-interest. IEEE Trans. on Visualization and Computer Graphics, 15(6):953–960, 2009.