Publisher’s version / Version de l'éditeur:
Human and Ecological Risk Assessment, 10, December 6, pp. 1155-1171, 2004-12-01
READ THESE TERMS AND CONDITIONS CAREFULLY BEFORE USING THIS WEBSITE.
https://nrc-publications.canada.ca/eng/copyright
Vous avez des questions? Nous pouvons vous aider. Pour communiquer directement avec un auteur, consultez la
première page de la revue dans laquelle son article a été publié afin de trouver ses coordonnées. Si vous n’arrivez pas à les repérer, communiquez avec nous à PublicationsArchive-ArchivesPublications@nrc-cnrc.gc.ca.
Questions? Contact the NRC Publications Archive team at
PublicationsArchive-ArchivesPublications@nrc-cnrc.gc.ca. If you wish to email the authors directly, please see the first page of the publication for their contact information.
NRC Publications Archive
Archives des publications du CNRC
This publication could be one of several versions: author’s original, accepted manuscript or the publisher’s version. / La version de cette publication peut être l’une des suivantes : la version prépublication de l’auteur, la version acceptée du manuscrit ou la version de l’éditeur.
For the publisher’s version, please access the DOI link below./ Pour consulter la version de l’éditeur, utilisez le lien DOI ci-dessous.
https://doi.org/10.1080/10807030490887203
Access and use of this website and the material on it are subject to the Terms and Conditions set forth at
Human health risk assessment of naturally occurring radioactive materials in produced water - a case study
Chowdhury, S.; Husain, T.; Veitch, B.; Bose, N.; Sadiq, R.
https://publications-cnrc.canada.ca/fra/droits
L’accès à ce site Web et l’utilisation de son contenu sont assujettis aux conditions présentées dans le site LISEZ CES CONDITIONS ATTENTIVEMENT AVANT D’UTILISER CE SITE WEB.
NRC Publications Record / Notice d'Archives des publications de CNRC: https://nrc-publications.canada.ca/eng/view/object/?id=2d173d14-8213-4f40-a621-c5d1dea4c175 https://publications-cnrc.canada.ca/fra/voir/objet/?id=2d173d14-8213-4f40-a621-c5d1dea4c175
Human health risk assessment of naturally occurring radioactive materials in produced water – a case
study
Chowdhury, S.; Husain, T.; Veitch, B.; Bose, N.; Sadiq, R.
NRCC-47659
A version of this document is published in / Une version de ce document se trouve dans: Human and Ecological Risk Assessment, v. 10, no. 6, Dec. 2004, pp. 1155-1171
Doi:10.1080/10807030490887203
Human Health Risk Assessment of Naturally Occurring Radioactive
Materials in Produced Water – A Case Study
1
Shakhawat Chowdhury, 1Tahir Husain,* 1Brian Veitch, 1Neil. Bose and 2Rehan Sadiq
1
Faculty of Engineering & Applied Science Memorial University of Newfoundland
St. John’s, NL, A1B3X5, Canada.
2
Institute for Research in Construction National Research Council (NRC)
Ottawa, ON, K1A 0R6, Canada.
*Corresponding author:
Faculty of Engineering and Applied Science Memorial University of Newfoundland
NL, A1B 3X5, Canada Phone: (709) 737-8781
Fax: (709) 737- 4042 E-mail: thusain@engr.mun.ca
ABSTRACT
Human health effects from naturally occurring radioactive materials (NORM) in produced water are of concern due to their bioavailability and bioaccumulation characteristics in finfish and shellfish species used for human consumption. Being chemically similar to calcium, radium concentrates mostly in bones, shells and exoskeletons. Previous studies have been based on the whole-body bioaccumulation of radium in fish where the distribution of radium in bone/exoskeleton and the edible parts of fish were not considered separately and thus the predicted risks were relatively high. In this paper, the distribution of radium in the non-edible and edible parts of fish and the probability of exposure to a produced water plume have been studied in order to characterize human health risks. A probabilistic hydrodynamic model has been incorporated in this study. Using the concentration distribution approach, the mean cancer risks to humans were predicted in the range of 8.6×10⁻⁷ to 9.5×10⁻⁷, which were 2.6 to 2.7 times less than the risks predicted by using the whole body concentrations. The exceedence probability of maximum permissible human health cancer risk of 1×10⁻⁴ is close to zero. At a risk level of 1×10⁻⁶, the exceedence probability is 21% while in the whole body concentration approach it is between 45 to 49%. In this study, no effect on fish from exposure to NORM components in produced water was found.
Key words: Produced water, human health risk, NORM, Monte Carlo simulations, dilution
INTRODUCTION
Produced water, which is extracted during oil and gas production, includes formation water, injected water, small volumes of condensed water, and any chemical added down hole or during the oil/water separation process (USEPA 1993). Produced water is the highest volume waste generated in association with oil and gas production operations. Despite treatment before discharge to satisfy regulatory limitations on oil content, produced water contains a certain amount of Naturally Occurring Radioactive Materials (NORM) such as 226Ra and 228Ra. NORM are difficult to remove from produced water, which make the assessment of their effects on human health important to the oil and gas producing industries.
Several studies have been carried out to assess human health risk in terms of the likelihood of cancer as a result of NORM contaminated seafood ingestion (Hamilton et al. 1992; Meinhold and Hamilton 1992; Meinhold et al. 1996). These previous studies did not consider the concentration distributions in different organs such as the bone/exoskeleton and flesh of fish and thus predicted a relatively high risk from this source; although the predicted risks by the previous studies were below the regulatory permissible limits. Meinhold et al. (1996) predicted potential cancer risk from 226Ra and 228Ra in produced water for open bays in Louisiana where the exposure probability for fish and the organ-based distributions of radium were not considered.
Four different radioisotopes of radium (223Ra, 224Ra, 226Ra and 228Ra) exist in nature. The half-lives of 223Ra, 224Ra, 226Ra and 228Ra are 11.4 days, 3.7 days, 1600 years and 5.75 years respectively (USEPA 1999). Due to their short half-lives, 223Ra and 224Ra do not play a significant role in risk assessment. Produced water may contain radium components in addition to metals, polycyclic aromatic hydrocarbons (PAHs), volatile organic carbons (VOCs) and
process chemicals. Two isotopes of radium, 226Ra and 228Ra are of most concern as they are leachable and mobile because of their high solubility in water (Vegueria et al. 2002) and they may bioaccumulate in food organisms (Hamilton et al. 1992). Radium isotopes probably make up the bulk of nuclide activity in produced water (Snavely et al. 1989). The isotope 226Ra emits mostly alpha particles at energies of 4.6 and 4.78 MeV and a small amount of gamma rays at energy of 0.186 MeV whereas 228Ra emits beta particles at energy of 0.055 MeV (Neff 2002). The rate of radioactive decay of a radioisotope (activity) is measured in Curies (Ci) or the International System (SI) unit of Bequerels (Bq). The convenient unit of picoCurie (pCi = 10-12 Ci) will be used in this study.
Stephenson and Supernaw (1990) reported 226Ra and 228Ra in the ranges of 4 to 584 pCi/l and 18 to 586 pCi/l for produced water outfalls in the Gulf of Mexico. The Continental Shelf Associates Inc. reported similar ranges of 226Ra and 228Ra in produced water from open bays in Louisiana (CSA 1993). The average activities of 226Ra and 228Ra in the Gulf of Mexico (GOM) were reported as 262 ± 156 and 277 ± 146 pCi/l respectively (Stephenson 1992). Radium activity from two oil fields in Brazil has been found to be less than that of the Gulf of Mexico (Vegueria
et al. 2002). Produced water in the Gulf of Mexico has a higher radium activity than that present
in produced water from open bays in Louisiana (Stephenson 1992; Meinhold et al. 1996). The activity of radium in produced waters from other offshore locations in the world is usually much lower than that in produced water from platforms in the Gulf of Mexico.
Radionuclides can accumulate in the soft tissue and bones of marine species (Mulino and Rayle 1992). The concentration factor, which is defined as the ratio of concentration in an organ or organism to the concentration in the media, varies depending on type of fish and organ such as
concentration factors of 226Ra and 228Ra in bone is higher than that of muscle for Sole, Ray, Sardine, Mackerel, Oil fish, Oyster, Clam, Green mussel and Snail (Iyengar 1984; Iyengar et el. 1980; Neff 2002). Radium is chemically similar to calcium and concentrates in bones, shells and exoskeletons (Meinhold and Hamilton 1992). Studies on three fish species suggest that radium is mostly accumulated in bones and least in flesh (Meinhold and Hamilton 1992). Concentration factors of radium content based on the whole organism overestimate the level of radium in the edible portion (Iyengar 1984). A minimum of 40% of the total radium in a fish is accumulated in bones and approximately 6% in edible flesh (Neff 2002). Several species of lake fish also bioaccumulate radium to higher concentrations in bone than in the muscles (Neff 2002).
The distribution of radium in the edible and non-edible part of a fish was not taken into account for human health risk assessment in some previous studies and thus those previous studies have predicted relatively high risks. Meinhold et al. (1996) employed Monte Carlo simulations for assessing human health risks from radium and lead in produced water, but radium distribution in different organs (bones, flesh, exoskeleton, shell) of a fish and uncertainty associated with hydrodynamic modeling were not taken into consideration. A methodology for human health risk assessment from NORM components in produced water is discussed in this paper by presenting an example that evaluates discharge scenarios of produced water from an offshore oil platform. The uncertainty associated with model inputs and coefficients, including the uncertainty from an error term, have been considered. This human health risk assessment methodology is discussed in the following sections.
HUMAN HEALTH RISK ASSESSMENT METHODOLOGY
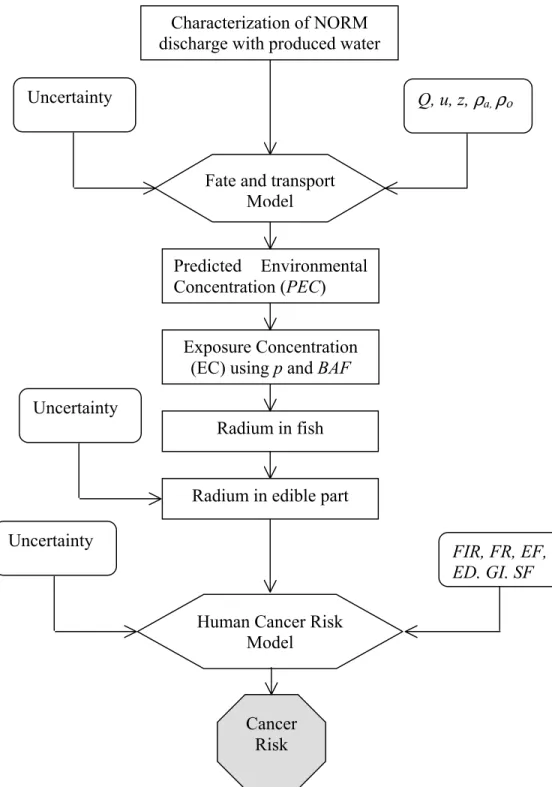
The human health risk assessment methodology for fish consumption consists of three main phases: (1) prediction of exposure concentration for the fish; (2) assessment of radium concentration in the edible part of the fish and (3) characterization of the cancer risk in humans. These phases are discussed in the following sections. The framework for human health risk assessment is presented in Figure 1.
PHASE 1. PREDICTION OF EXPOSURE CONCENTRATION FOR FISH
This study considers a hypothetical discharge scenario for produced water from an offshore platform with the objective of providing a methodology, in which relevant information for potential produced water discharge from an offshore platform was collected from various sources. The hypothetical platform was designed for a capacity of treating 0.212 m3/s of produced water. Assuming the location of the site to be on the Grand Banks, Newfoundland, the ambient environmental conditions were defined on the basis of limited available data (DFO 1999; Petro-Canada 1996; Mukhtasor 2001). The ambient water depth for the location is about 95 m. During winter, the water column is uniformly cold and at other times it is a two-layer system in which the top layer becomes most stratified in August. This top layer has a thickness of 15m (approximately) and can be considered as the depth of the mixing layer. The current speed in that location follows a lognormal (-3.29, 0.96) distribution (Mukhtasor 2001) where the parameters –3.29 and 0.96 represent the natural log of the median and the standard deviation of current speed respectively. The depth above the discharge dominates the dilution and dispersion of produced water plume. The depth of the discharge port for this study was assumed to be 11m below the water surface. The density gradient was assumed to be 0.025.
Dilution model
Upon discharge of a buoyant effluent into the marine environment, it dilutes and disperses so that the pollutant concentration decreases as the effluent moves farther away from the discharge point. Mukhtasor (2001) developed a probabilistic dilution model as follows:
(
0.13 0.02)
( )(
0.46 0.02)
exp(
0.22 0.04)
(
0,0.092)
03 . 0 1 3 . 0 2 N l z l z z u Q S b b + ± − ± + ± = ± − (1) whereS = the initial (centerline) dilution (dimensionless);
Q = the outfall discharge rate;
u = ambient current velocity (m/s);
N (0, 0.092) = mode residual (ε), normally distributed with mean and standard deviation 0 and 0.092 respectively; and
lb = buoyancy length scale determined as:
l Q g u b a o a = − 3 ρ ρ ρ (2) where
g = the gravitational acceleration;
ρo = effluent density (kg/m3).
The plume rises in the near field region and surface impingement takes place in the region known as the control volume that connects the near and far fields (Mukhtasor 2001). The dilution model components, such as plume width and thickness at the end of control volume, length of control volume and other related terms can be found elsewhere (Akar and Jirka 1994; Doneker and Jirka 1990; Wright et al. 1991; Huang et al. 1996; Mukhtasor 2001)
Exposure concentration (EC)
It is unrealistic to assume that a migratory fish stays in the produced water affected area throughout the whole exposure period. The USEPA (1999a) determines the exposure probability as the ratio of the affected zone to the zone under study. An area of 100 m radius around the discharge port was used by USEPA (1999a) for human health risk assessment purposes. As radium is soluble in water, an assumption of 100% bioavailability has been used in this study for a conservative calculation. The exposure concentration has been calculated as (USEPA 1999a):
Cexp=Cw× p × BAF (3)
where
Cexp = exposure concentration for fish;
Cw = predicted environmental concentration (PEC) using fate and transport models;
p = exposure probability; and
PHASE 2. PREDICTION OF RADIUM IN THE EDIBLE PART OF FISH
The growth of a fish continues throughout its whole life irrespective of its location, and therefore the growth and other physical changes (e.g. change in lipid and bone content) during the exposure period have an effect on the accumulation of contaminants. Using the whole fish bioconcentration factor, the total radium in fish is predicted as:
t rad C BCF W
W = exp× × (4)
where,
Wrad = total radium accumulated in fish (pCi);
Wt = weight of fish (kg);
Cexp = calculated using equation (3); and
BCF = whole fish bioconcentration factor for radium.
Meinhold and Hamilton (1992) determined bioconcentration factors for whole fish in the range of 2 to 100. Meinhold et al. (1996) used a lognormal distribution for bioconcentration factor in
whole fish with mean 30.4 and standard deviation 28 for human health risk assessment from NORM components based on the data provided by Meinhold and Hamilton (1992).
The edible part of fish was calculated as the sum of moisture and lipid content as documented by the USEPA (1996) and shown in Table 1. These data revealed that the edible parts of a fish are in the range of 64-87% with a mean value of 78%, which results a lognormal (4.36, 0.063) distribution for the edible part of fish.
The average concentration of 226Ra in bone is 5.0 to 7.9 times higher than that of the soft tissues in a fish (Iyengar 1984). In lake trout and whitefish, this ratio varies between 1.7 to 9.2 and 3.1 to 34.3 respectively (Clulow et al. 1998). The average concentration of 226Ra in the shell of mussels is 9.3 times higher than that of the soft tissues (Neff 2002). The concentration factors for edible and non-edible parts are shown in Table 2. For Crustaceans (marine), the ratio of concentration factors between non-edible and edible parts varies within 0.6 to 22.9 while for White sucker, the ratio is 149.4 (Table 2). The ratio of concentration factors between non-edible and edible parts has a geometric mean of 9.9, minimum ratio of 1 and the maximum of 150, which follow a lognormal (2.3, 1.2) distribution. The concentration factors in the edible and non-edible parts of a fish also follow lognormal distributions (Table 2). The equation for concentration distribution was developed using mass balance assuming no loss of radium in fish as: rad radned t raded t C x W C W W x× × +(1− )× × = , and rad raded t raded t C x W y C W W x× × +(1− )× × × = ⇒
[
]
t rad raded W y x x W C × − + = ) 1 ( (5) whereCraded = radium concentration in edible part of fish (pCi/kg)
Cradned = radium concentration in non-edible part of fish (pCi/kg)
Wt = weight of fish (kg)
x = edible fraction of a fish
y = Cradned/Craded
Using the value of Wrad from equations 4 and 5 can be rewritten as:
[
x x y]
BCF C Craded ) 1 ( exp − + × = (6)PHASE 3. CHARACTERIZATION OF CANCER RISK
The total human intake of radium was calculated as:
3 10− × × × × × × =C FIR EF ED FR GI IT raded (7) where
IT = total intake radium intake (pCi)
Craded = radium concentration in edible part of fish (pCi/kg)
FIR = daily fish ingestion rate (g/day)
EF = exposure frequency (days/yr)
ED = exposure duration (yrs)
FR = fraction of contaminated fish ingested
10 -3 = conversion factor for g/kg
Fish ingestion rate (FIR)
USEPA (1999a) used 177 g/day as the 99th percentile fish ingestion for human health risk assessment. Meinhold et al. (1996) derived a lognormal (3.455, 0.622) distribution for fish
caught near an open bay platform in Louisiana. The use of a lognormal distribution was suggested by USEPA (1996) for human health risk assessment in long-term basis.
Fraction of contaminated fish ingested (FR)
Throughout the exposure period, it is unrealistic to assume that all the fish ingested are from the contaminated site. A study by USEPA (1997) for the age group 1-20 year old shows that 123 g/day marine fish was ingested from a total of 219g/day fish ingestion. In 1992, a survey of restaurants shows an average of 889 dishes out of 1500 total each week was served with seafood (Schultz et al. 1996). The available data (USEPA 1996, 1997; Schultz et al. 1996;
Dellenbarger et al. 1993) suggest that marine fish ingestion is almost 50% of the total fish
ingestion. The total fish ingested from marine sources may not be exposed to a produced water plume and thus the use of 50% of the total ingested fish, as the contaminated fish will still provide a conservative prediction of cancer risk.
Exposure frequency (EF)
The USEPA (1989, 1991, 1998) recommended the exposure period for all exposure pathways as 350 days/year. In this recommendation, a minimum of 2 wk/yr absence from the exposure has been assumed.
Exposure duration (ED)
The US EPA Office of Solid Waste (OSW) recommends the use of a default reasonable maximum exposure (RME) for risk assessment. The US EPA OSW recommends the exposure
duration for subsistence fisher and adult resident as 30 years (USEPA 1998).
Gastrointestinal absorption factor (GI)
The fraction of chemical that is absorbed by blood from the intestinal tracts is known as the gastrointestinal absorption factor (GI). The GI factors for NORM components from USEPA
(1999) have been considered in this study.
The cancer risk was calculated as:
SF I
CRRAD = T × (8)
where
CRRAD = cancer risk from radionuclides
IT = total radium intake (pCi)
SF = slope factor (pCi)-1
The total cancer risk was calculated using probabilistic summation concept assuming independence in occurrence of individual risks as:
B A B A R R R R Risk Cancer Total = + − × (9)
where,
RA = cancer risk from 226Ra
RB = cancer risk from 228Ra
Various parameters used in this study are tabulated with their respective distributions in Table 3.
RESULTS AND DISCUSSION
The data of NORM components in produced water is sparse. The mean and standard deviations of 226Ra and 228Ra concentrations in produced water from different platforms were documented by Stephenson (1992); Mulino et al. (1992); Hart et al. (1996); Vegueria et al.
(2002); Meinhold et al. (1996) and Wiedeman (1996). No statistical distribution could be
established for 226Ra and 228Ra concentrations in produced water based on the data from the Gulf of Mexico. In this study, three cases were considered for 226Ra and 228Ra concentrations in the Gulf of Mexico (GOM) as the risk from NORM components would be the highest in this region because the produced water in the Gulf of Mexico has the highest concentrations of NORM components than any other known offshore oil field (Neff 2002).
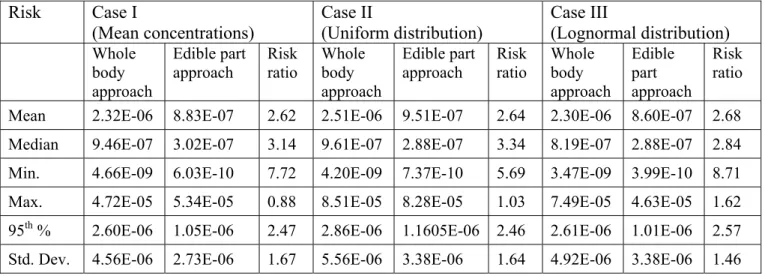
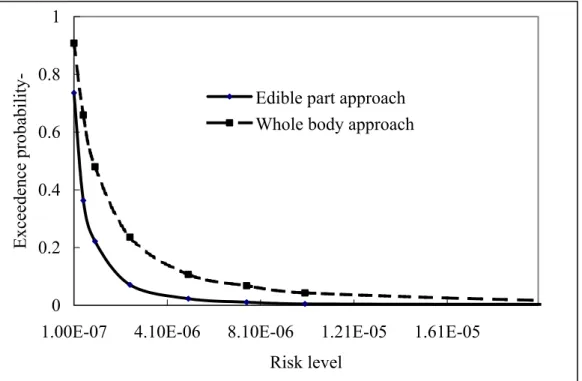
In Case I, the mean concentrations of 226Ra and 228Ra were used to analyze the cancer risk scenario (Table 3). The probability of risk exceedence for case I is plotted in Figure 2. Case II represents uniform distributions of 226Ra and 228Ra as quoted in Table 3 and the probability of risk exceedence for case II is plotted in Figure 3. Lognormal distributions of 226Ra and 228Ra were used for Case III and Figure 4 shows the probability of risk exceedence for case III. In all the three figures, the probability of cancer risk exceedence is more in the whole body approach. The results of all cases and their risk ratios are shown in Table 4. The mean risks in the whole
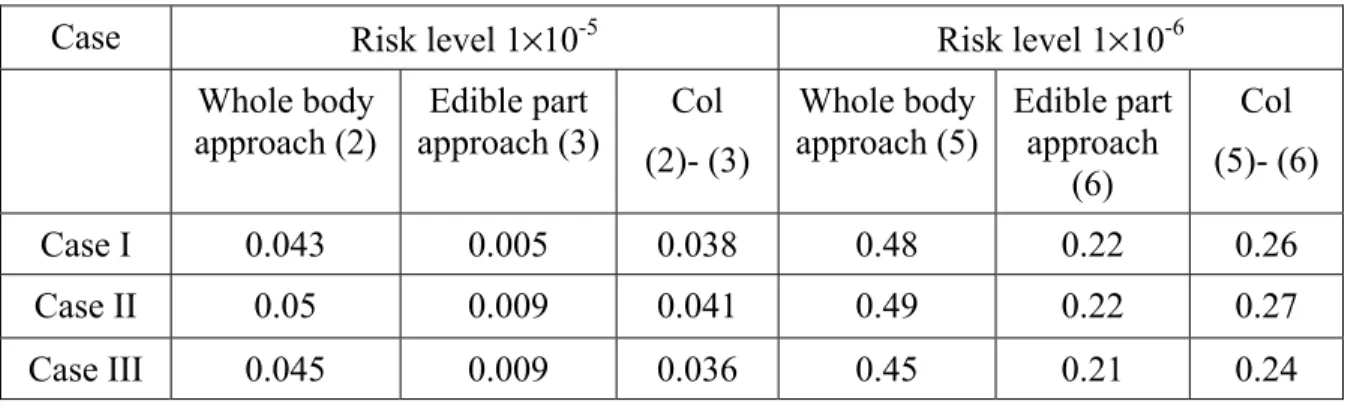
body approach are 2.62-2.68 times the risk in the edible part approach. The 95th percentile risks for the whole body approach have been predicted as 2.46-2.57 times the risks in the edible parts approach (Table 4). The USEPA accepts an individual lifetime cancer mortality risks less than 1×10⁻⁴ to 1×10⁻⁶ (Federal Register 1991). The exceedence probability of maximum acceptable risk (1×10⁻⁴) was close to zero for all the cases. The exceedence probability of the risk level 1×10⁻⁵ and 1×10⁻⁶ is presented in Table 5. At a risk level of 1×10⁻⁵, the whole body approach predicts 3.6-4.1% more exceedence probability than those of the edible part approach (Table 5; Figures 2-4). The whole body approach predicts 24-27% higher exceedence probability than those of the edible part approach at a risk level of 1×10⁻⁶ (Table 5). The mean and 95th percentile risks for uniform distributions of NORM components in produced water were highest in both the edible part and whole body approaches compared to the other two cases (Table 4). If the data for NORM components is not available, uniform distributions of NORM components can be employed for a conservative risk calculation. The concentrations of 226Ra and 228Ra in the produced waters from Gulf of Mexico are the highest (Stephenson 1992; Neff 2002) and the human health cancer risk from those concentrations has been predicted as minimal through fish ingestion pathway (Figures 2-4); therefore no or negligible risk to human health is expected from NORM components in produced water. The predicted mean risks for whole body approach were lower than those of Meinhold et al. (1996). This may be due to the following causes:
higher dilution factor for higher discharge depth and different ambient conditions
the probability of exposure (p) for fish to the produced water plume was considered in this
study like USEPA (1999)
the total risk was calculated using probabilistic summation concepts.
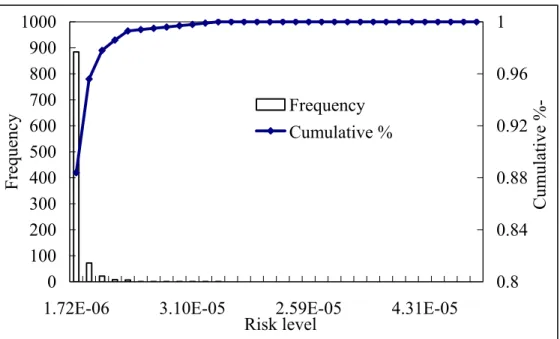
The frequency distributions of typical risk (Case I) are presented in Figures 5 and 6 for edible part and whole body approaches respectively. In Figure 5, approximately 88% of the cumulative frequency lies within a risk level of 3.4 ×10⁻⁶ while Figure 6 shows 64% frequency below a risk level of 3.1 ×10⁻⁶. The figures indicate lower risk in the edible part approach than those of the whole body approach. In the case of canned food ingestion, where both bones and muscles are packed together after processing (includes Tuna, Sardines), the whole fish ingestion concept may be used. In such cases, radium intake is comparatively more and thus higher risk prevails, although the predicted risk in the whole body approach is less than the regulatory limitations.
The skewness of the lognormally distributed concentration data (Case III) is more than Case I and Case II and the use of the largest values of exposure concentrations would provide the most conservative estimate. The maximum exposure concentrations to the continuously exposed marine organisms have been predicted as 24 and 15 pCi/l for 226Ra and 228Ra respectively. Continuous exposure of a migratory marine organism to produced water plume is an extremely rare case. A study on salmon embryos shows that the exposure to 821pCi/l irradiation for approximately 20 days has no impact on mortality (IAEA 1988). At open bays in Louisiana, Meinhold et al. (1996) predicted no effects to aquatic organisms from 226Ra and 228Ra discharged with produced water. In this study, the predicted exposure concentrations of 226Ra and 228Ra are well below the concentration that causes effects to the selected species. It is unlikely that any harmful effect to the marine fish will occur from exposure to produced water NORM components.
SUMMARY AND CONCLUSION
Several models are available for human health risk assessment purposes due to the substantial efforts devoted in the past to assess human health risk from NORM components in produced water. Those efforts usually employed whole body bioconcentration factors and unrealistic worst-case scenarios such as fish limited to the contaminated zone throughout their life. Inter compartmental distribution of radium in bone/skeleton and edible parts of a fish were not taken into consideration and thus the cancer risk from NORM components was overestimated. An approach is presented here for human health risk assessment based on a discharge of produced water from an offshore platform. The approach consists of three main phases: prediction of exposure concentration for fish, estimation of radium concentration in the edible part of fish, and characterization of cancer risk. No or minimal effect to the marine fish is expected from NORM components in produced water. The approach can be applied to other waste effluent discharges like streams with radioactive materials and industrial effluent. A probabilistic analysis using Monte Carlo simulation was used to deal with uncertainty associated with the models and other parameters used in this study. The discussion reveals that the risk associated with NORM components in produced water is well below the allowable limit.
ACKNOWLEDGMENT
The authors acknowledge the financial support of the NSERC Strategic Project entitled
REFERENCES
Akar PJ and Jirka GG 1994. Buoyant Spreading Processes in Pollutant Transport and Mixing, Part 1: Lateral Spreading with Ambient Current Advection: Journal of Hydraulic Research 32(6): 815-831
Clulow FV, Mirka MA, Dave NK and Lim TP 1998. Radium-226 in water, sediments and fish from lakes near the city of Elliot Lake, Ontario. Environ. Pollut. 99: 13-28
CSA (Continental Shelf Associates). 1991. Measurement of Naturally Occurring Radioactive Materials (NORM) at Three Produced Water Outfalls. Prepared for Mid-Continent Oil and Gas Association, Baton Rouge, Louisiana, Jupiter, Florida.
Dellenbarger LA Schupp and Kanjilal B 1993. Seafood consumption in coastal Louisiana, Louisiana Department of Environmental Quality, Office of Water Resources, Baton Rouge, LA.
DFO (Department of Fisheries and Ocean). 1999. Oceanographic data. Available at http://www.mar.dfo-mpo.gc.ca/science/ ocean/welcome.html
Doneker RL and Jirka GH 1990. Expert System for Hydrodynamic Mixing Zone Analysis of Conventional and Toxic Submerged Single Port Discharges (CORMIX1). Rep. No. EPA/600/3-90/012, Washington, DC, USA
Federal Register. 1991. National Primary Drinking Water Regulations. United States Environmental Protection Agency. Radionuclides, 40 CFR Parts 141,142,56: 138:33050
Hamilton LD Meinhold AF and Nagy J 1992. Health Risk Assessment for Radium Discharges in Produced Water. In: Ray JP and Engelhardt FR (eds.), Produced Water Technological/ Environmental Issues and Solutions, pp 303-314. Plenum Press, New York
Huang H Proni J R and Tsai JJ 1996. Probabilistic Analysis of Ocean Outfall Mixing Zones. Journal of Environmental Engineering, 122(5):359-367
IAEA 1988. Assessing the Impact of Deep Sea Disposal of Low Level Radioactive Waste on Living Marine Resources. Technical Reports Series No. 288, International Atomic Energy Agency, Vienna
Iyengar MAR, Rajan MP, Ganapathy S and Kamath PR. 1980. Sources of Radiation Exposure in a low monazite environment. In: The Natural Radiation Environment III’ Symp. Proc. Houston, 1978; CONF-780422, Technical Information Center, Springfield, pp 1090-1106
Iyengar MAR 1984. Distribution in nature. In: The Behavior of Radium in Waterways and Aquifers. IAEA-TEC DOC 301, International Atomic Energy Agency, Vienna.
Meinhold AF and Hamilton LD 1992. Radium Concentration Factors and their use in Health and Environmental Risk Assessment. In: Ray JP and. Engelhardt FR (eds.), Produced Water Technological/Environmental Issues and Solutions, pp 293-302. Plenum Press, New York
Meinhold AF Holtzman S and DePhillips M 1996. Risk Assessment for Produced Water Discharges to Open Bays in Louisiana. In: Reed M and Johnsen S (eds.), Produced Water 2 Environmental Issues and Mitigation Technologies, pp 395-409. Plenum Press, New York
Mukhtasor 2001. Hydrodynamic Modeling Ecological Risk-based Design of Produced Water Discharge from an Offshore Platform. PhD Thesis. Memorial University of Newfoundland, pp 59-90.
Mulino MM and Rayle MF 1992. Produced Water Radionuclides Fate and Effects. In: Ray JP and Engelhardt FR (eds.), Produced Water Technological/Environmental Issues and Solutions, pp 343-354. Plenum Press, New York
Neff JM 2002. Bioaccumulation in Marine Organisms; Effects of Contaminants from Oil Well Produced Water. pp 191-202. Elsevier Science Ltd. Kidlington, Oxford 0X5 1GB, UK.
Petro-Canada 1996. Development Application. Terra Nova Development: Environmental Impact Statement, Prepared by Petro-Canada on behalf of the Terra Nova Proponents. St John’s, Newfoundland, Canada.
Swanson SM 1983. Levels of Ra226, Pb210 and total uranium in fish near a Saskatchewan uranium mine and mill. Health Physics 45:67
Schultz FE, Stephen E, Steimle, Mulino MM, Francis JC and Redmann DH 1996. Distribution of Finfish Caught Near Oilfield Structures Along Coastal Louisiana and Texas. In: M. Reed and S. Johnsen (eds.), Produced Water 2: Environmental Issues and Mitigation Technologies, pp 381-394. Plenum Press, New York.
Snavely ES Jr. 1989. Radionuclides in Produced Water; Production Department, American Petroleum Institute, Washington, DC.
Stephenson MT 1992. A Survey of Produced Water Studies. In: Ray JP and Engelhardt FR (eds.), Produced Water Technological/Environmental Issues and Solutions, pp 01-10. Plenum Press, New York
Stephenson MT and Supernaw IR 1990. Offshore Operators Committee 44 Platform Study Radionuclide Analysis Results, Offshore Operators Committee, New Orleans, Louisiana.
USEPA (U.S. Environmental Protection Agency). 1989. Risk Assessment Guidance for Superfund: Volume I. Human Health Evaluation Manual (Part A). OERR 9200 6-303-894.
OERR. Washington, DC, USA.
USEPA (U.S. Environmental Protection Agency). 1991. Risk Assessment Guidance for Superfund: Volume I—Human Health Evaluation Manual (Part B, Development of Risk-Based Preliminary Remediation Goals). EPA/540/R-92/003. Publication 9285.7-01B.
Washington, DC, USA.
USEPA (U.S. Environmental Protection Agency). 1993. Development Document for Effluent Limitations Guidelines and New Source Performance Standards for the Offshore Subcategory of the Oil and Gas Extraction Point Source Category. EPA-821-R-93-003. Office of Water, Washington, DC, USA
USEPA (U.S. Environmental Protection Agency). 1996. Exposure Factor Handbook; VOL. II; Food Ingestion Factors. EPA/600-p-95/002Bp, Washington, DC, USA.
USEPA (U.S. Environmental Protection Agency). 1997. Child Specific Exposure factors Hand Book, Intake of Fish and Shellfish; EPA/600/P-95/002Fa-c; US Environmental Protection Agency
USEPA (U.S. Environmental Protection Agency). 1998. Human Health Risk Assessment Protocol for Hazardous Waste Combustion Facilities; Vol. I, Chapter 6; EPA530-D-98-001A. Office of Solid Waste, USA.
USEPA (U.S. Environmental Protection Agency). 1999. Cancer Risk Coefficients for Environmental Exposure to Radionuclides. Federal Guidance Report No. 13.
EPA-402-R-99-001. Air and Radiation, Washington DC, USA
USEPA (U.S. Environmental Protection Agency) 1999a. Environmental Assessment of Proposed Effluent Limitations Guidelines and Standards for Synthetic-Based Drilling Fluids and other Non-Aqueous Drilling Fluids in the Oil and Gas Extraction Point Source Category; EPA
821-B-98-019, February 1999.
Vegueria SFJ, Godoy JM and Miekeley N 2002. Environmental Impact in Sediments and Seawater due to Discharges of Ba, 226Ra, 228Ra, V, Ni, and Pb by Produced Water from the Bacia de Campos Oil Field Offshore Platforms; Environmental Forensics 3:115-123
Wiedeman A 1996. Regulation of Produced Water by the U.S. Environmental Protection Agency. In: Reed M and Johnsen S (eds.), Produced Water2: Environmental Issues and Mitigation Technologies pp 27-41. Plenum Press, New York
Wright SJ, Roberts PJW, Zhongmin Y and Bradley NE 1991. Surface Dilution of Round Submerged Buoyant Jets, Journal of Hydraulic Research, 29(1): 67-89.
Table1. Moisture and lipid content in selected species (USEPA 1996) Species Moisture Content (%) Total Lipid Content (%) Category Comments
Anchovy, European 73.37 4.101 Finfish Raw
Bass, Stripped 79.22 1.951 Finfish Raw
Carp 76.31 4.842 Finfish Raw
Haddock 79.92 0.489 Finfish Raw
Halibut, Atlantic and Pacific 77.92 1.812 Finfish Raw
Halibut, Greenland 70.27 12.164 Finfish Raw
Herring, Atlantic & Turbot 72.05 7.909 Finfish Raw
Herring, Pacific 71.52 12.552 Finfish Raw
Mackerel, Atlantic 63.55 9.076 Finfish Raw
Ocean Perch, Atlantic 78.80 1.296 Finfish Raw
Pike, Northern 78.92 0.477 Finfish Raw
Salmon, Atlantic 68.5 5.625 Finfish Raw
Salmon, Chinook 73.17 9.061 Finfish Raw
Salmon, Coho 72.63 4.908 Finfish Raw
Salmon, Pink 76.35 2.845 Finfish Raw
Sardine, Atlantic 59.61 10.545 Finfish Canned in oil
Seatrout, mixed species 78.09 2.618 Finfish Raw
Trout, Rainbow 71.48 2.883 Finfish Raw
Trout, mixed species 71.42 5.901 Finfish Raw
Crab, Alaska King 79.57 N/A Shellfish Raw
Lobster, Northern 76.03 0.358 Shellfish Raw
52.86 10.984 Cooked, breaded
and fried Shrimp, mixed species
72.56 1.421
Shellfish
Canned
Mussel, Blue 80.58 1.538 Shellfish Raw
Oyster, Eastern 85.14 1.620 Shellfish Raw
78.55 0.989 Raw
Squid
64.54 6.763
Shellfish
Table 2. Concentration factors for edible and non-edible parts in a fish
(adapted from Swanson 1983; Iyengar 1984; Iyengar et al. 1980; Hamilton et al. 1992;
Meinhold and Hamilton 1992) Species (1) Radium Component (2) CF (flesh) (3) CF (bone, shell, skeleton) (4) Ratio (4)/(3) White sucker Ra 12 1793 149.4 Lake whitefish Ra 3 360 120 Lake trout Ra 1 10 10 Oyster Ra 50 500 10 Green mussel Ra 46 419 9.1 Snail (Petalla radiate) Ra 44 256 5.8 226 Ra 55 370 6.7 Sole 228Ra 21 160 7.6 226 Ra 130 610 4.7 Oil sardine 228 Ra 44 180 4.1 226 Ra 60 65 1.1 Ray 228 Ra -- 98 226 Ra 80 360 4.5 Prawn 228 Ra 56 300 -- Moluscs- marine 226Ra 44-63 156-500 2.5-11.4 Crustaceans- marine 228Ra 35-360 230-800 0.6-22.9 Crab 228Ra 35 800 22.9 Clam Ra -- 200 -- Moluscs Ra 2-240 -- --
Table 3. Input parameters and their characterization
Model parameters Characterization Reference Comments
Q (Effluent discharge rate
m3/sec)
0.212 Petro-Canada (1996)
u (Ambient current speed
m/sec)
LN (-3.29,0.96) Mukhtasor (2001)
z (Depth above discharge
m)
11 Mukhtasor (2001)
BCF (Whole fish
bioconcentration factor)
LN (2.99,0.92) Meinhold and Hamilton (1992); Meinhold et al.
(1996)
x (Edible part of fish %) LN (4.36,0.063) US EPA (1996)
y, (Concentration factor
ratio)
LN (2.29, 1.2) Swanson (1983); Iyengar (1984); Iyengar et al. (1980),
Hamilton et al. (1992);
Meinhold and Hamilton (1992)
FIR (Fish ingestion rate g/day)
LN (3.46, 0.62) Meinhold et al. (1996)
FR (Fraction of
contaminated fish ingested %) 50 US EPA (1997), Schultz et al. (1996); Dellenbarger et al. (1993). EF (Exposure frequency days/yr) 350 US EPA (1996)
ED (Exposure duration, yr) 30 US EPA (1996)
226
Ra input (pCi/l) 262 Stephenson (1992)
228
Ra input (pCi/l) 277 Stephenson (1992)
Case I
226
Ra input (pCi/l) U (4,584) Stephenson (1992)
228
Ra input (pCi/l) U (18, 586) Stephenson (1992)
Case II (Distribution was assumed for comparative purpose) 226
Ra input (pCi/l) LN (5.39, 0.6) Stephenson (1992)
228
Ra input (pCi/l) LN (5.49, 0.53) Stephenson (1992)
Case III
(Distribution was assumed for comparative purpose) LN: Lognormal distribution; U: Uniform distribution
Table 4. Risk results Risk Case I (Mean concentrations) Case II (Uniform distribution) Case III (Lognormal distribution) Whole body approach Edible part approach Risk ratio Whole body approach Edible part approach Risk ratio Whole body approach Edible part approach Risk ratio
Mean 2.32E-06 8.83E-07 2.62 2.51E-06 9.51E-07 2.64 2.30E-06 8.60E-07 2.68
Median 9.46E-07 3.02E-07 3.14 9.61E-07 2.88E-07 3.34 8.19E-07 2.88E-07 2.84
Min. 4.66E-09 6.03E-10 7.72 4.20E-09 7.37E-10 5.69 3.47E-09 3.99E-10 8.71
Max. 4.72E-05 5.34E-05 0.88 8.51E-05 8.28E-05 1.03 7.49E-05 4.63E-05 1.62
95th% 2.60E-06 1.05E-06 2.47 2.86E-06 1.1605E-06 2.46 2.61E-06 1.01E-06 2.57 Std. Dev. 4.56E-06 2.73E-06 1.67 5.56E-06 3.38E-06 1.64 4.92E-06 3.38E-06 1.46
Table 5. Probability of exceeding the maximum acceptable risk of 1×10⁻⁵ and 1×10⁻⁶
Case Risk level 1×10⁻⁵ Risk level 1×10⁻⁶
Whole body approach (2) Edible part approach (3) Col (2)- (3) Whole body approach (5) Edible part approach (6) Col (5)- (6) Case I 0.043 0.005 0.038 0.48 0.22 0.26 Case II 0.05 0.009 0.041 0.49 0.22 0.27 Case III 0.045 0.009 0.036 0.45 0.21 0.24
Characterization of NORM discharge with produced water
Fate and transport Model
Predicted Environmental Concentration (PEC)
Human Cancer Risk Model Uncertainty Uncertainty Cancer Risk Uncertainty FIR, FR, EF, ED, GI, SF
Radium in edible part Radium in fish Exposure Concentration
(EC) using p and BAF
Q, u, z, ρa, ρο
0 0.2 0.4 0.6 0.8 1
1.00E-07 4.10E-06 8.10E-06 1.21E-05 1.61E-05
Risk level
Exceedence
probability-Edible part approach Whole body approach
0 0.2 0.4 0.6 0.8 1
1.00E-07 4.10E-06 8.10E-06 1.21E-05 1.61E-05
Risk level
Exceedence
probability-Edible part approach Whole body approach
0 0.2 0.4 0.6 0.8 1
1.00E-07 4.10E-06 8.10E-06 1.21E-05 1.61E-05
Risk level
Exceedence
probability-Edible part approach Whole body approach
0 100 200 300 400 500 600 700 800 900 1000
1.72E-06 3.10E-05 2.59E-05 4.31E-05
Risk level Frequency 0.8 0.84 0.88 0.92 0.96 1 Cumulative %-Frequency Cumulative %
0 100 200 300 400 500 600 700 800 900 1000
1.53E-06 1.22E-05 2.74E-05 3.96E-05
Risk level Frequency 0 0.2 0.4 0.6 0.8 1 Cumulative %-Frequency Cumulative %