HAL Id: hal-03230566
https://hal.archives-ouvertes.fr/hal-03230566
Submitted on 20 May 2021
HAL is a multi-disciplinary open access
archive for the deposit and dissemination of
sci-entific research documents, whether they are
pub-lished or not. The documents may come from
teaching and research institutions in France or
abroad, or from public or private research centers.
L’archive ouverte pluridisciplinaire HAL, est
destinée au dépôt et à la diffusion de documents
scientifiques de niveau recherche, publiés ou non,
émanant des établissements d’enseignement et de
recherche français ou étrangers, des laboratoires
publics ou privés.
Wind tides and surface friction coefficient in
semi-enclosed shallow lagoons
Caroline Paugam, Damien Sous, Vincent Rey, Samuel Meulé, Vincent Faure,
Olivier Boutron, Emilie Luna-Laurent, Emmanuelle Migne
To cite this version:
Caroline Paugam, Damien Sous, Vincent Rey, Samuel Meulé, Vincent Faure, et al.. Wind tides and
surface friction coefficient in semi-enclosed shallow lagoons. Estuarine, Coastal and Shelf Science,
Elsevier, In press. �hal-03230566�
Wind tides and surface friction coefficient in semi-enclosed shallow
lagoons
Caroline Paugama, Damien Sousa,b, Vincent Reya, Samuel Meuléc, Vincent Faured, Olivier
Boutrone, Emilie Luna-Laurente, Emmanuelle Mignef
aUniversité de Toulon, Aix-Marseille Université, CNRS/INSU, IRD, Mediterranean Institute of Oceanography
(MIO), UM 110, Toulon, France
bUniversité de Pau et des Pays de l’Adour - E2S UPPA, SIAME - MIRA, Anglet, France cAix Marseille Univ, CNRS, IRD, INRAE, Coll France, CEREGE, Aix-en-Provence, France
dGIPREB Syndicat Mixte, Berre l’étang, France eTour-du-Valat, Arles, France
fSociété Nationale de Protection de la Nature (S.N.P.N.), Réserve Naturelle Nationale de Camargue, La
Capelière, Arles, France
Abstract
The present paper is specifically focused on enclosed or semi-enclosed basins where the wind is the dominant driver of water surface tilting, leading to the so-called wind tide contributing to water levels rise. Wind-induced free surface tilting is studied using the 1-D steady form of the depth-averaged shallow water (Saint-Venant) momentum equation which reflects the depth-averaged local balance between surface slope and wind stress. Two contrasted field sites, the Berre and Vaccarès lagoons, have been monitored providing water level data along a reference axis. This study highlighted the occurence of wind tides at the two field sites. The bimodal wind exposure ensured the robustness of the observations, with non-linear but symmetric behaviors patterns observed in winds from opposite directions. It is observed that the higher the wind speed, the steeper the slope of the free surface in accordance with the well known basic trend. In addition, a significant effect of depth is observed, with greater surface tilting in the shallower lagoon. The data analysis confirmed the robustness of such a simple approach in the present context. Using the additional assumption of constant, i.e. wind-independent, drag coefficients (CD) allowed a good match with the observations
for moderate wind speeds for both sites. However, the depth effect required the CDto be increased
in the shallower basin. Classical empirical wind-dependent CD parameterizations provide better
wind-tide predictions than the constant-CD approach in very strong wind conditions but totally
failed in predicting surface tilting in the shallower site, suggesting that physical parameters other than wind speed should be taken into account for the CD parameterization in very shallow lagoons.
1. Introduction
Coastal lagoons are complex systems, with high ecological and socio-economical stakes. Un-derstanding the dynamics of water level in coastal lagoons is of primary interest for neighbouring infrastructures, inhabited and cultivated areas. When widely connected to the open sea, the lagoon water levels are influenced by large scale variations of offshore level, such as astronomical tides or surges driven by low pressure and/or wind systems. An important process is associated to the direct effect of wind on the lagoon surface. The wind stress applied on the lagoon water surface induces a tilting of the whole water body, leading to the so-called wind tide. This effect can be important in many coastal lagoons which are often shallow and partially-enclosed basins and therefore may contribute to flooding of low-lying areas. The present paper is specifically dedicated to improve our physical understanding of wind tides in enclosed or semi-enclosed basins where the wind is generally the dominant driver of water surface tilting.
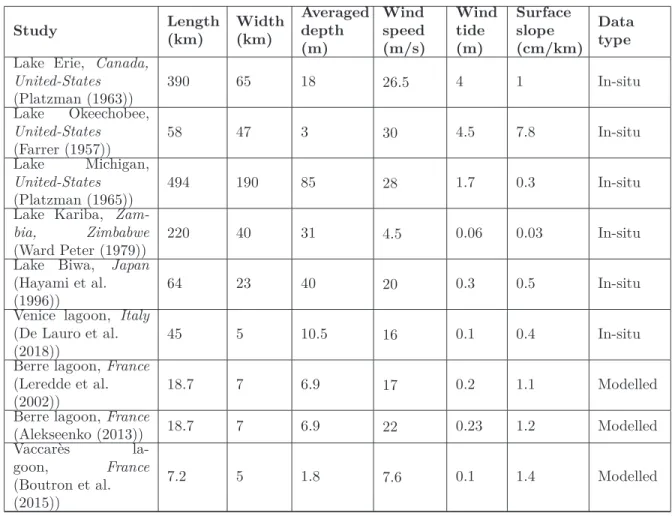
A series of studies have been carried out to quantify, understand and model wind tides in the field. Among them, we can cite Kenney (1979) in Lake Winnipeg in Canada , Hellström (1941); Platzman (1963); Keulegan (1953); Gillies (1959) in Lake Erie in Canada and the United-States, Farrer (1957); Kivisild (1954); Saville (1952) in Lake Okeechobee in the United-United-States, Harris (1957); Platzman (1965); Hugues (1965) in Lake Michigan in the United-States, Nomitsu (1935); Hayami et al. (1996) in Lake Biwa in Japan, Nomitsu (1935) in Lake Kariba in Zambia and Zimbabwe, De Lauro et al. (2018) in Venice lagoon in Italy or Metler et al. (1975) in Lake Balaton in Hungary. In order to provide estimates of the observed wind tide in relation to wind and basin features, some well-documented examples using in-situ and modelled data are summarized in table 1. A wide range of values is observed between the different sites, related to differences in basin dimensions, wind speed and other local features. Berre and Vaccarès lagoons in France have been selected in the present research work to specifically characterize wind tides in shallow water basins. It can be brought to attention that, for any motion at the basin scale such as the wind tide, most of coastal lagoons can be considered as shallow, i.e. where the typical horizontal length scale (wind tide wave length) is very large compared to the mean depth. The main dynamics can therefore be represented by the classical shallow water depth-averaged equations. An additional issue related to the shallowness is to assess the depth effect on the wind-wave development, which should in turn affect the sea state, the surface drag and therefore the wind tide amplitude. To address this issue, the two sites (the Berre and Vaccarès lagoons) have similar wind exposure but different levels of shallowness, allowing us to test the validity of surface drag parameterization developed in deep environments and to identify a potential depth-effect on surface drag and wind tide. First estimations of wind tide in Berre and Vaccarès lagoons presented in table 1 have been inferred from existing numerical modelling studies, non specifically devoted to wind tide and water tilting processes (Leredde et al., 2002; Alekseenko, 2013; Boutron et al., 2015).
A first theoretical prediction of wind-induced mean water level variations in shallow basin can be obtained by using the 1-D steady form of the depth-averaged shallow water (Saint-Venant) momentum equation (equation 1) (Hellström, 1941). This equation reflects the depth-averaged local balance between surface slope and wind stress.
∂ζ ∂x =
τ ρwgh
Study Length(km) Width(km) Averaged depth (m) Wind speed (m/s) Wind tide (m) Surface slope (cm/km) Data type
Lake Erie, Canada,
United-States (Platzman (1963)) 390 65 18 26.5 4 1 In-situ Lake Okeechobee, United-States (Farrer (1957)) 58 47 3 30 4.5 7.8 In-situ Lake Michigan, United-States (Platzman (1965)) 494 190 85 28 1.7 0.3 In-situ
Lake Kariba,
Zam-bia, Zimbabwe
(Ward Peter (1979))
220 40 31 4.5 0.06 0.03 In-situ
Lake Biwa, Japan (Hayami et al.
(1996)) 64 23 40 20 0.3 0.5 In-situ
Venice lagoon, Italy (De Lauro et al. (2018))
45 5 10.5 16 0.1 0.4 In-situ
Berre lagoon, France (Leredde et al.
(2002)) 18.7 7 6.9 17 0.2 1.1 Modelled
Berre lagoon, France
(Alekseenko (2013)) 18.7 7 6.9 22 0.23 1.2 Modelled Vaccarès la-goon, France (Boutron et al. (2015)) 7.2 5 1.8 7.6 0.1 1.4 Modelled
Table 1: Examples of studies on wind tides in enclosed and semi-enclosed basins
Where ζ is the free surface elevation (m), x is the spatial component in the wind direction (m),
h the average water depth (m), ρw the water density (kg.m−3) and g the acceleration of gravity
(m.s−2). The wind stress τ (N.m−2) is generally inferred from a quadratic drag law (equation 2).
τ = ρaCDVe2 (2)
where CD is the dimensionless surface drag coefficient, ρa the air density (kg.m−3) and Ve is
the x-component of the wind 10 meters above sea level (m.s−1).
Equation 1 shows that wind tide, i.e. the wind-induced variation of mean water level, is expected to increase with increasing basin length, increasing wind speed and decreasing water depth. A common simplification is to assume a spatially-uniform wind over the considered basin, leading to a constant stress for a uniform bathymetry. The water surface is consequently linear with a constant slope S (equation 3).
S = ∂ζ ∂x =
∆ζ
L (3)
Where L is the basin length (m) in the wind direction i.e. the fetch and ∆ζ the surface tilting (m).
points are required to characterize the surface tilting and to analyse its dependency on wind features and basin parameters. The validity of such simple conceptual framework in real cases will be discussed later on.
A key parameter in equation 1 is the surface drag coefficient CD which integrates a wide range
of small-scale processes related to wave development, surface roughness and atmospheric boundary layer stability into a single bulk quantification of the energy transfer from the wind to the water mass. CD can be inferred from macroscopic estimation of the momentum relating the wind and
the surface tilting (equation 1) or obtained by local measurements of the turbulent stress. A typical order of magnitude for CD is 1.2.10−3 (Pugh and Woodworth, 2014) but it is known to
be affected by a number of processes and the definition of an universal parameterization remains an active challenge. The main trend is that CD increases with surface roughness which increases
with wind speed due to wave development (Powell et al., 2003). Various empirical wind-dependent formulations have been proposed for CD (Wu, 1969, 1980; Garratt, 1977; Babanin and Makin,
2008). A decrease in CD for extreme wind speed (higher than 33 m.s−1) was found because the sea
surface roughness becomes saturated Powell et al. (2003). These formulations all assume that the drag coefficient is constant in space, i.e. that the length scale for surface roughness development is negligible compared to the basin scale. Moreover, the depth effect is also neglected, which presupposes that the surface roughness in not affected by depth.
Most of the wind tide studies and CD parameterizations have been carried out in large scale
and/or deep basins. Despite their ubiquity and socio-ecological importance worldwide, smaller scale shallow lagoons remain sparsely documented. The question arises of the validity of the common CD
parameterization and related theoretical estimation of wind tide through equation 1 in the context of shallow lagoons. In order to address this issue with generalizable observations, the present study is based on the comparative analysis of long-term water level data in two semi-enclosed basins geographically close and exposed to similar wind conditions but with different morphological configurations. Field sites and methods are presented in Section 2. In-situ data are presented and compared with existing formulations in Section 3, while the processes involved and the overall validity of the theoretical framework are discussed in Section 4.
2. Field experiments
2.1. Field sites
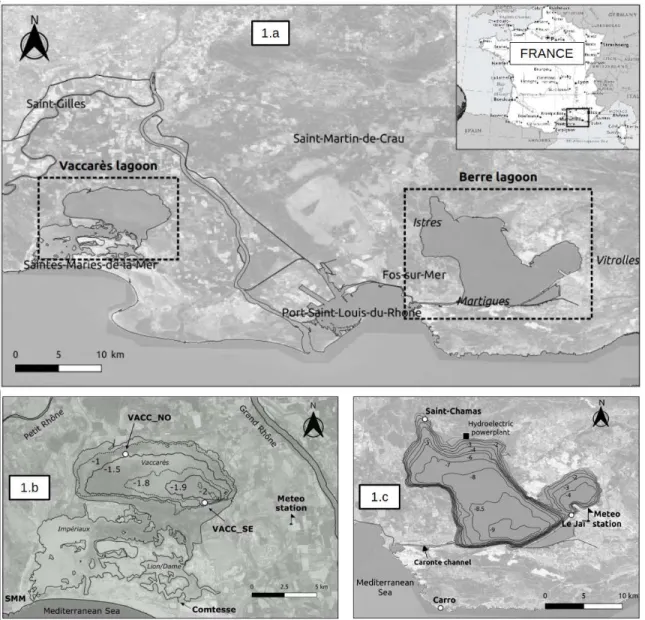
The Berre and Vaccarès lagoons (figure 1) are shallow coastal lagoons located in the eastern part of the Gulf of Lion, on the Mediterranean coast of France. This region is characterized by intense and frequent wind events. The dominant wind forcing is from N to NW with strong winds associated with an anticyclonic regime and canalized through the Rhône and Aude valleys (Mistral and Tramontane). The region is also exposed to wind from nearly opposite directions, coming from east/south-east, during low pressure and wet conditions. In both regimes, mean speed during wind events ranges between 11 and 14 m/s, with maxima over 20 m/s (Ullmann, 2008). This bimodal and strong wind exposure makes this area a well-suited environment for studying wind-driven processes. In the present study, the Berre and Vaccarès lagoons have been monitored to understand the effect of morphology, depth and wind exposure on the mean water level dynamics. Both sites are exposed to the same synoptic wind patterns with local adaptations but show differences in terms
of size and depth : Vaccarès lagoon is shorter, wider and shallower than Berre lagoon, enabling us to study the depth-effect on the response to wind events. Main morphological characteristics of the study sites are summarized in table 1 and depicted in figures 1.b and 1.c . Numerical studies have been recently carried out to describe water mass circulation at both sites, mainly for water quality issues (Boutron et al., 2015; Alekseenko, 2013). These studies provides first estimates of the surface tilting for selected wind conditions using common wind stress parameterization but dedicated long-term in-situ documentation was still required to properly assess the wind tide development over a wide range of wind conditions.
Figure 1: Maps of field sites in south-eastern France (1.a), Vaccarès (1.b) and Berre (1.c) lagoons, bed elevation in NGF referential (official levelling network in metropolitan France).
Berre lagoon is situated in an urbanized and industrial area and flooding is a major problem. Moreover, the EDF hydroelectric plant at Saint-Chamas sporadically discharges large quantities of fresh water and silt into Berre lagoon at high volumes, up to more than once the volume of the lagoon per year. Berre lagoon can be classified as a choked coastal lagoon (Mahapatro et al., 2013)
with a restricted communication with the sea via the Caronte channel, a channel with a maximum width of about 200 meters, 6 km long and with a bathymetry between 7 and 10 m., see figure 1.c and further details in Section 2.2.2.
Vaccarès lagoon is located in the national nature reserve of the Camargue and is therefore preserved and not urbanized. The communication with the sea is more complex than in Berre lagoon because Vaccarès lagoon communicates mainly with the Impériaux system and also with Lion/Dame lagoons according to Boutron et al. (2015) (figure 1.b). Communication with the sea of the entire hydrosystem is controlled at Saintes-Marie-de-la-Mer (SMM) by 13 manual sluice gates of relatively moderate size (1 to 1.2 m), see Section 2.2.2 for additional information.
2.2. Data and instrumentation 2.2.1. Wind data
Wind data for Berre lagoon were provided from March 2019 to August 2020 by three-hourly wind measurements at the Marignane meteorological station (Météo-France), see figure 1.c. These observational data are obtained from the international surface observation messages (SYNOP) cir-culating on the global telecommunication system (GTS) of the World Meteorological Organization (WMO). Wind data for Vaccarès lagoon were provided from July 2019 to August 2020 by hourly wind measurements at the Tour-du-Valat station (Météo-France), see figure 1.b. For both wind data sources, the average wind speed data are the average over the last 10 minutes before the selected time with a sampling period of 1 minute. In addition, these meteorological stations also provide gust velocity data defined as extreme speed values over a period of 1 minute measured over the previous 10 minutes. Due to the proximity and the absence of significant local reliefs be-tween measurement stations and measurement sites, the recovered wind data at Tour-du-Valat and Marignane stations are considered very representative of the wind forcing encountered at Vaccarès and Berre lagoons, respectively. Finally, at Berre, the three-hourly wind measurements are directly synchronized with our three-hourly water level measurements described below while at Vaccarès the hourly wind data are further averaged over three hours to get the synchronicity.
Wind statistics during both measurement campaigns are depicted in figure 2. Two dominant wind regimes are observed: NW or NNW winds (mistral) and SE winds. Strong wind conditions can be observed at both studied sites with wind speeds that can be higher than 20 m/s.
The mistral is generally more western and faster at Berre lagoon (Marignane station) than at the Vaccarès lagoon (Tour-du-Valat station). This difference is explained by the location of the Marignane station, about 60 km to the east of Tour-du-Valat station and therefore closer to the mouth of the Rhône valley through which the mistral is channeled (Jacq et al., 2005; Obermann-Hellhund and Ahrens, 2018).
2.2.2. Water level data
Measurement setup
Water level in Vaccarès lagoon was monitored at two distinct stations from July 2019 to August 2020. The measurements were carried out by two pairs of piezometers (Keller DCX-22AA) deployed in the north-west (VACC_NO station) and the south-east (VACC_SE station) parts of the lagoon to provide long-term pressure and temperature measurements both in the air and in the water. Station locations depicted in figure 1.b were determined based on prevailing wind conditions but
Figure 2: Wind roses for Vaccarès (Tour-du-Valat station, hourly data over 13 months) and Berre (Marignane station, tree-hourly data over 17 months) lagoons. Wind roses show the the occurrence of wind directions as well as their speeds for both sites : in Vaccarès lagoon main wind directions are NNW and SE up to 20 m/s, and in Berre lagoon, NW winds over 20 m/s and SE up to 20 m/s.
constrained by the shallow bathymetry and private properties that prevented direct access to the shoreline. Sampling period at both station is 10 min.
Water level data in Berre lagoon are provided by HTM-NET network (https://htmnet.mio.osupytheas.fr), a network of instruments providing long term air and water pressure and temperature
measure-ments along the French south-east Mediterranean coast (Rey et al., 2020). The data used for the present study was recorded from March 2019 to August 2020 with a similar setup as for Vaccarès, i.e. two pairs of piezometers (Keller PAA-36Xiw CTD). The two Berre lagoon stations were located at Saint-Chamas and Le Jaï harbours (see figure 1.c), i.e. roughly in the dominant wind axis, to provide pressure and temperature data every 2 minutes.
For both sites, stations were repeatedly positioned using a RTK DGPS and the processing was carried out using the Bernesse GNSS Software (Dach et al., 2015) with data from the permanent Geodesic Network (RGP) of IGN. The vertical positioning uncertainty is estimated at approximately 20 mm.
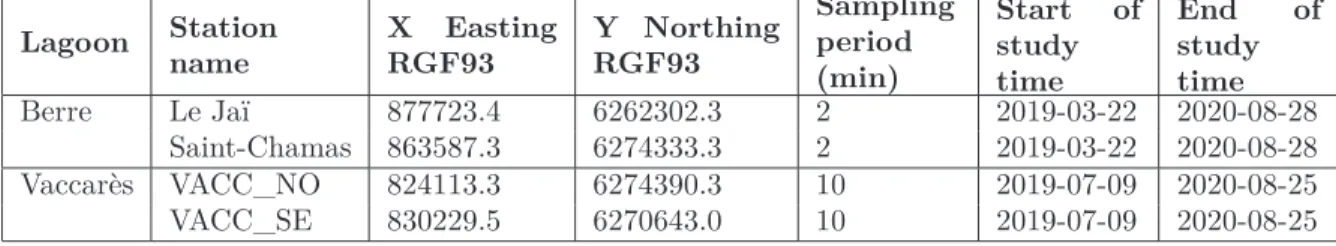
Measurement station information for Vaccarès and Berre lagoons is summarized in table 2.
Lagoon Station name X Easting RGF93 Y Northing RGF93 Sampling period (min) Start of study time End of study time Berre Le Jaï 877723.4 6262302.3 2 2019-03-22 2020-08-28 Saint-Chamas 863587.3 6274333.3 2 2019-03-22 2020-08-28 Vaccarès VACC_NO 824113.3 6274390.3 10 2019-07-09 2020-08-25 VACC_SE 830229.5 6270643.0 10 2019-07-09 2020-08-25 Table 2: Stations information in Berre and Vaccarès lagoons: names, locations and data acquisition parameters
Water level calculation
The pressure difference between air and water offers the means to determine the water level variation, based on the assumption of hydrostatic pressure (equation 4):
ζ = ∆P ρwg
(4) with ∆P = Pwater− Pair the local pressure difference.
The sea water density is calculated using the UNESCO seawater equation of state (UNESCO, 1979), using measured temperature and constant salinity (37.5 PSU). Considering the natural variability of lagoon salinity (15 to 45 PSU), this implies a water level computational bias lower than 0.2 cm, which corresponds to the precision of the pressure measurements (Rey et al., 2020).
Level forcings
Apart from the wind, the water levels at the two sites are affected by different forcings. In Berre lagoon, water level variations of the Mediterranean sea are transmitted through the Caronte channel. Large-scale sea level fluctuations due to atmospheric pressure systems are slow enough to be fully and uniformly transmitted within the Berre lagoon. At a smaller time-scale, the micro-tidal oscillations of the open sea level are observed to propagate within the lagoon. A typical tidal range of 20 cm is attenuated through the canal and is approximately equal to 5 cm within the lagoon. A tidal phase shift of 40 min is observed between the two stations and the result is a water level variation of 0.4 cm between the stations at a given time. Seiching oscillations have been observed at the Berre lagoon: the seiching period along the NW-SE axis is approximately 100 minutes and has a maximum amplitude of 8 cm (Paugam et al., 2020). The EDF hydroelectric power station released few liquid inflows during the study period, these discharges have a uniform impact on water level throughout the lagoon.
In Vaccarès lagoon, no tidal signal is observed within the lagoon due to very restricted SMM floodgates system and intermittent communication between the lagoon hydrosystem and the open sea. However, the lagoon water level can show significant variations due to several processes. Most importantly, the mean water level at Vaccarès is strongly controlled by evaporation and precipitation. It is estimated on the basis of historical data that the average annual precipitation is in the order of 600 mm/yr and the average annual evaporation 1500 mm/yr. The mean water level in the hydrosystem is also impacted by human interventions.
• The SMM floodgates system is used to control the salinity of the hydrosystem and to en-hance biological exchanges. The degree of communication depends on the number of opened valves (up to 13) and on the opening duration which are empirically defined and not properly monitored. Overall, the exchanged fluxes being small and attenuated by the Imperial and Lion/Dame systems, the influence on the Vaccarès lagoon water level is slow and limited. • Discharges of water from agricultural channels can also impact the lagoon level. No proper
monitoring is available, but the inflows involved are small compared to the lagoon volume. Each of the factors listed here can affect the Vaccarès lagoon water level, but the mass fluxes involved are low enough to drive a uniform action throughout the lagoon, i.e. they will not affect the 3h-averaged free surface slope calculation described below.
Water level measurement uncertainties
• Pressure transducer error: 0.2 cm;
• The use of a constant salinity for sea water density calculation: 0.2 cm; • Tidal time shift in Berre lagoon between the two stations: 0.4 cm; • Vertical positioning: 2 cm.
Considering the measurement and calculation biases mentioned above, the maximum error is approximately 2.8 cm in Berre lagoon and 2.4 cm in Vaccarès lagoon.
2.3. Data processing
To study the free surface tilting, the 3h-averaged water levels ζ at the south-east station (ζSE)
and the north-west station (ζN W) are used for both sites. The 3hrs averaging time window was
chosen as a compromise to be small enough to resolve the typical time scale of well-established wind events but long enough to remove the water level variations caused by seiching.
Wind tides are studied at both sites using the same method. The free surface tilting ∆ζ is defined as the difference between ζSE and ζN W:
∆ζ = ζSE− ζN W (5)
The sign convention is therefore that if the north-west water level is lower than the south-east level, the free surface tilting will be positive which correspond to NW (mistral) wind events.
Assuming that both wind forcing and bathymetry are spatially uniform, the deformation of the free surface is assimilated to a linear slope S, simply calculated in practice using the water level difference ∆ζ between two distinct measurement points separated by a distance L (equation 7).
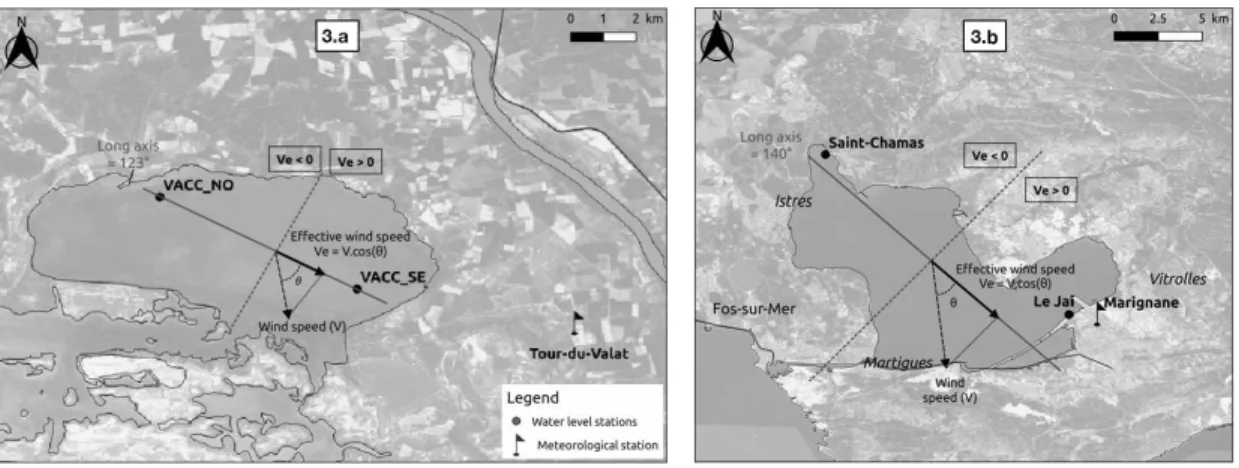
The slope of the free surface is dimensionless but, for the sake of simplicity, it will be expressed in the following in cm (vertical) per km (horizontal). The distance L is defined along given reference axes (figure 3). In Vaccarès lagoon, the reference axis directly corresponds to the straight line between the 2 stations (figure 3.a), oriented at 123° True North: LV accarès = 7.2 km. In Berre
lagoon, the reference axis follows the long axis of the basin oriented at 140° (figure 3.b). The distance L is therefore calculated between the orthogonally-projected locations of Saint-Chamas and Le Jaï stations on the reference axis: LBerre= 18.7 km.
Following Keulegan (1953) and Gillies (1959), the effective wind speed Ve, i.e. the projected
wind component on the reference axis, is computed as follows
Ve= V × cos(θ) (6)
with V the raw wind speed and θ the angle between the wind direction and the reference axis.
Ve is therefore positive in case of NW wind and negative for SE winds (figure 3).
The simplest approach used in the following analysis is to consider a constant CD value at each
site. It can be deduced combining equations 3 and 1 with the quadratic drag law of equation 2, a simple linear dependence is obtained between S and Ve2
h
S = αV
2
e
Figure 3: Determination of the effective wind speed Veby projecting the wind component along Vaccarès (3.a) and
Berre (3.b) lagoons reference axis
where the surface drag coefficient CDcan be inferred from the α regression coefficient as follows
CD= αg
ρw
ρa
(8) As mentioned in section 2.2.2, the mean water depth h is assumed to be spatially-uniform but may vary with time under the influence of a range of forcings. The spatial-uniformity assumption (i.e. assuming a flat horizontal bed) induces error in the CDdetermination lower than 2% compared
to the calculations performed assuming a linear sloping bed with the typical slopes for the two sites. The bottom elevation is defined as the averaged elevation along the transect throughout the reference axis of the lagoon. The time-varying water depth h is obtained, for each 3h-burst, by subtracting the fixed bed elevation from the spatially-averaged but time-varying free surface elevation < ζ >=ζSE+ζN W
2 .
3. Results
3.1. Field conditions
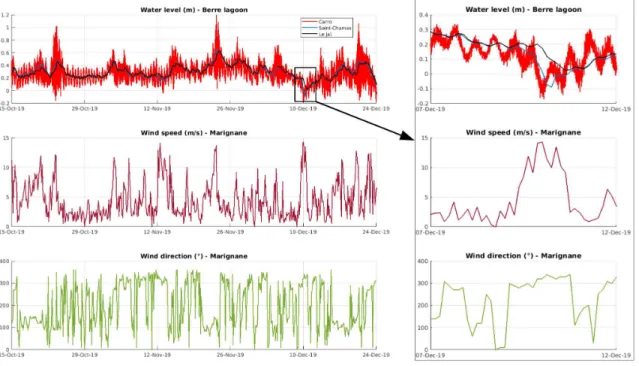
Figures 4 and 5 show the time-evolution of the 3-hour average water levels of the two stations and associated wind speeds and wind directions at Marignane station and Tour-du-Valat station for Berre and Vaccarès lagoons respectively. A NW wind event is detailed on these figures for the two sites. Water level data from Carro station outside of Berre lagoon provided by HTM-NET network is also presented in figure 4, the station is located 1n figure 1.c. The span of the experiments ensured to cover a wide range of conditions at both lagoons, with several strong wind events in both main directions (NW and SE).
Fluctuations of the mean water level at the two sites shown in figures 4 and 5 suggest that in Vaccarès, the mean water level follows a seasonal trend, with higher/lower levels during win-ter/summer seasons. These seasonal fluctuations have been driven by the combination of various mechanisms described previously, but are not directly related to the wind forcing. Mean water level fluctuations are also observed in Berre lagoon but, in contrast with Vaccarès, the Berre lagoon water level is affected by day to week-scale fluctuations of the open sea level transmitted through
the Caronte channel. The semi-diurnal tidal oscillations are attenuated of about 75%. Longer water level fluctuations at Carro related to synoptic meteorological wind-pressure systems are also transmitted in the lagoon.
Recorded water level data near the lagoon boundaries reveal the expected wind tide dynamics: northwestern/southeastern water levels are lower during NW/SE wind conditions. The magnitude in water level difference between the stations increases with the wind speed.
Figure 4: Water levels (NGF referential) and wind data in Berre lagoon and Carro station from October 2019 to December 2019. Note that the complete dataset cover a longer period from March 2019 to August 2020. The right plots represent a 5-days mistral event.
3.2. Wind tides analysis
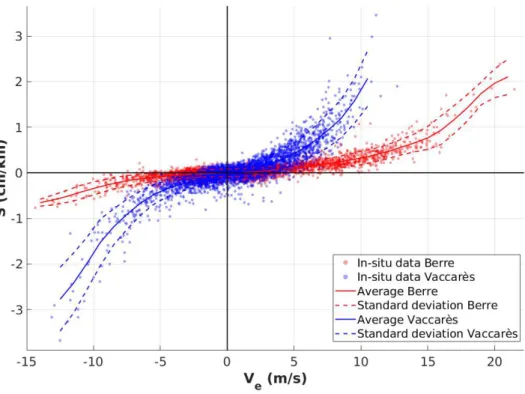
Figure 6 depicts the dependency of the surface slopes on effective wind speed for the two sites. The wind speed ranges are not perfectly symmetric at Berre, with stronger wind events being observed in NW wind conditions. The direct relationship between wind forcing and surface slope osberved in figure 6 confirms that the wind is a major driver of mean surface slope in both systems. In weak wind conditions, slopes of the free surface are very low. Increase of wind speed induces a non-linear increase in the slope. For the same winds, the slope is higher in Vaccarès lagoon due to the shallower depth. Maximum values recorded for the two sites are summarized in table 3. Maximum observed slopes are 3.5 cm/km corresponding to a surge of 13 cm in Vaccarès lagoon and 2.2 cm/km corresponding to a surge of 20 cm in Berre lagoon. The slope development appears symmetric in case of NW or SE wind events: for a 10 m/s effective wind speed, the slope is approximately 2 cm/km in Vaccarès lagoon and 0.5 cm/km in Berre lagoon.
Overall, the orders of magnitude of observed slopes are in good agreement with existing mod-elling studies in the Berre (Leredde et al., 2002) and Vaccarès (Boutron et al., 2015) lagoons (table 1). The observed slope values are generally higher than most of the existing field observations (table 1), in relation with the shallow depths in Berre and Vaccares lagoon. The only exception is
Figure 5: Water levels (NGF referential) and wind data in Vaccarès lagoon from October 2019 to January 2020. Note that the complete dataset cover a longer period from July 2019 to August 2020. The right chart represents a mistral event
the extreme value measured at Lake Okeechobee (Farrer, 1957) which associated a very long and shallow basin exposed to violent storm winds.
Studied site Maximum slope during NW winds (cm/km) Associated wind speed (m/s) Maximum slope during S-E wind event (cm/km) Associated wind speed (m/s) Berre lagoon 2.4 20.4 0.8 14.4 Vaccarès lagoon 3.5 11.1 3.6 12.5
Table 3: Maximum surface slopes during NW and SE wind events and associated wind speeds Figure 7 depicts the relationship between S and Ve2
h . For both sites, the overall trend is well
linear, which confirms the validity of the idealized approach assuming spatially uniform wind stress and depth. Coefficients of determination are high for both sites: R2
Berre= 0.87 and R
2
V accarès =
0.91. Using a linear regression, values of α (equation 7) are determined: αBerre= 2.45 × 10⁻² and
αV accarès = 3.12 × 10⁻². Related surface drag coefficients using equation 8 are CD = 2.01 × 10⁻³
and CD= 2.56 × 10⁻³ for Berre and Vaccarès lagoons, respectively. The possible causes for such a
difference in surface drag coefficients are discussed later in Section 4.
Considering the quality of the linear regression, the idealized constant-CD, i.e. wind-independent,
approach provides rather robust orders of magnitude for wind tide prediction. The CD wind
de-pendency can be assessed by testing three well-known empirical wind-dependent CD formulations
against the present in-situ dataset.
First, Wu (1969) proposed equations 9 and 10 for low (1 m.s−1 < V < 15 m.s−1) and strong
Figure 6: Measured surface slopes S versus effective wind speed Ve, the average is a solid line and the error margins
are dotted lines. Berre and Vaccarès lagoon data are in red and blue dots, respectively.
CD= 0.5V
1
2 × 10⁻³ (9)
CD= 2.6 × 10⁻³ (10)
The second formulation has been proposed by Garratt (1977) from observational data:
CD= (0.75 + 0.067V ) × 10−3 (11)
Thirdly, a study of wind trend and gustiness on sea drag made by Babanin and Makin (2008) in Lake George, Australia, enabled them to propose formulation 12.
CD= 1.92 × 10⁻⁷V3+ 9.6 × 10⁻⁴ (12)
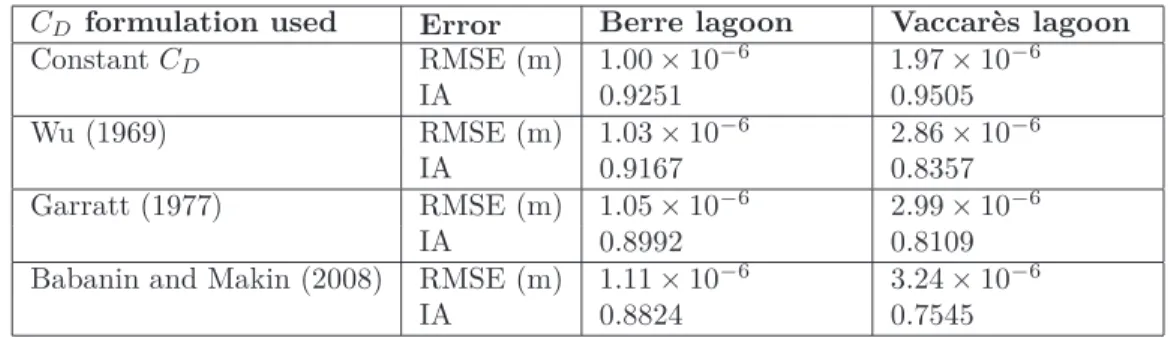
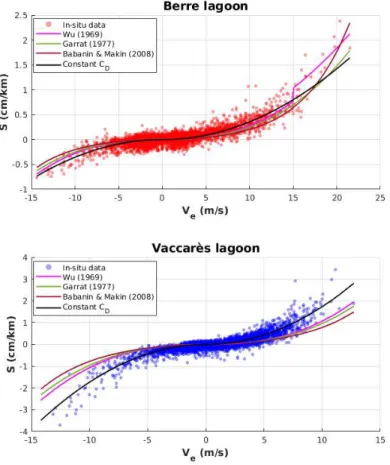
Figure 8 and table 4 compare the predictive performances of the constant and three wind-dependent CD formulations against the in-situ data. Root mean squared error (RMSE) and index
of agreement (IA) (Willmott (1981)) are used to quantify the prediction errors in table 4
In Berre lagoon, slopes are correctly predicted using a constant CD for wind speeds below
15 m.s−1 but are underestimated for higher wind speeds observed in NW conditions, similarly
to the prediction from Garratt’s wind-dependent formulation (equation 11). Such extreme wind conditions are better described by the equation 12 CD formulation, but the latter shows a poorer
formu-Figure 7: S versus Ve2
h in Berre (upper chart) and Vaccarès (bottom chart) lagoons. The in-situ data are points, the
linear regressions are lines. R2, α and n are the linear determination coefficient, the linear slope and the number of data points.
lation proposed by Wu (1969) shows intermediate performance. In Vaccarès, each of the three wind-dependent formulations significantly underestimate the wind tide, resulting in much poorer predictions than the constant CDapproach (table 4). This result highlights the fragility of existing
empirical wind-dependent formulations of surface drag coefficient, in particular when applied to very shallow lagoons. The depth-effect is therefore expected to not only directly affect the momentum balance, but also a range of surface processes affecting the drag.
CD formulation used Error Berre lagoon Vaccarès lagoon
Constant CD RMSE (m) 1.00 × 10⁻⁶ 1.97 × 10⁻⁶ IA 0.9251 0.9505 Wu (1969) RMSE (m) 1.03 × 10⁻⁶ 2.86 × 10⁻⁶ IA 0.9167 0.8357 Garratt (1977) RMSE (m) 1.05 × 10⁻⁶ 2.99 × 10⁻⁶ IA 0.8992 0.8109
Babanin and Makin (2008) RMSE (m) 1.11 × 10⁻⁶ 3.24 × 10⁻⁶
IA 0.8824 0.7545
Table 4: RMSE and IA of measured and predicted slopes using a constant value of CD and wind-dependent CD
Figure 8: S versus Ve: in-situ data are represented by dots and empirical formulations by solid lines.
4. Discussion
The present research work has provided a detailed field database on wind-induced free surface tilting, the so-called wind tides, in two shallow semi-enclosed basins. The measurements first confirmed the expected main trend: the higher the wind speed, the steeper the free surface slope. In addition, a significant effect of depth is observed, with greater surface tilting in the shallower lagoon. From these observations, the 1-D steady depth-averaged momentum balance was used to estimate the surface friction coefficient based on the assumptions of a flat horizontal bed and a spatially-uniform wind stress. The data analysis confirmed the robustness of such a simple approach in the present context. However, the parameterization of the surface drag coefficient remains a tricky issue. The existing wind-dependent parameterizations provided satisfactory agreement at the deeper site but showed systematic underestimations of the wind tide at the shallower site. A simple constant CD provided slightly better performance, but required to use different values for
different depths. These observations suggested that additional physical parameters should be taken into account for the drag coefficient parameterization in very shallow lagoons. To provide further insight on the wind tide physics, discussion points are organised in four main topics: the wave field, the sloping bathymetry, the wind unsteadiness and the currents.
4.1. Wave field
The sea state influence on surface drag has been widely studied, mainly in the context of open ocean and moderate wind speed. Air-sea interactions are very complex at small scales because multiple mechanisms affect sea drag simultaneously (Babanin and Makin, 2008). The effect of the wave field structure on surface drag can be accounted for through wave age (Janssen, 1989; Donelan, 1982; Donelan et al., 1993; Uz et al., 2002; Young and Verhagen, 1996; Smith et al., 1992; Babanin and Makin, 2008; Kudryavtsev et al., 2014; Stewart, 1974; Oost, 1998; Oost et al., 2002) or wave steepness parameters (Hsu, 1974; Taylor and Yelland, 2001). Studies have shown that the drag coefficient value is higher in windy seas, with short and steep waves, than in fully developed seas associated with longer waves (Young and Verhagen, 1996; Smith et al., 1992; Babanin and Makin, 2008; Kudryavtsev et al., 2014; Uz et al., 2002). This effect should be accounted for in enclosed basins, where limited fetch conditions will affect the wind stress: short basins are expected to show higher wind stress and drag coefficient.
The sea state is also strongly affected by the depth. Similarly to short fetch, a finite depth will increase surface drag compared to open ocean by inhibiting the development of long waves (Smith et al., 1992; Kudryavtsev and Makin, 2004; Babanin and Makin, 2008). In deep water con-dition, the wave age is defined as the ratio between the wind speed and the wave celerity. The celerity (c) increases with the period (T ) of the waves : c = 1.56 × T . Waves are considered to reach their maximum period (unlimited fetch) when their speed is approximately equal to the wind speed. By contrast, waves in shallow water conditions are non-dispersive, i.e. the limit of speed of the waves is c =√gh regardless of their frequency and therefore waves do not necessarily reach
the wind speed. This results in a depth-control of the wave field favoring shorter waves in shallow water.
Both shorter and shallower basins are therefore associated to shorter wave spectra, expected to enhance the surface drag. This latter mechanism has been confirmed in laboratory experiments, where reduction of the short wind-wave spectra caused a decrease of the wind stress by as much as 20-30% at a given wind speed (Uz et al., 2002). Taken together, these observations are in line with our observation of a higher drag coefficient for the shallower and shorter lagoon (Vaccarès lagoon).
4.2. Sloping bathymetry
By contrast to most studies performed in unidirectional wind conditions, our sites are exposed to two opposite wind directions. Such configuration allowed to question the role played by a sloping bathymetry on the wind tide amplitude, in direct connection with the previous analysis of depth effect.
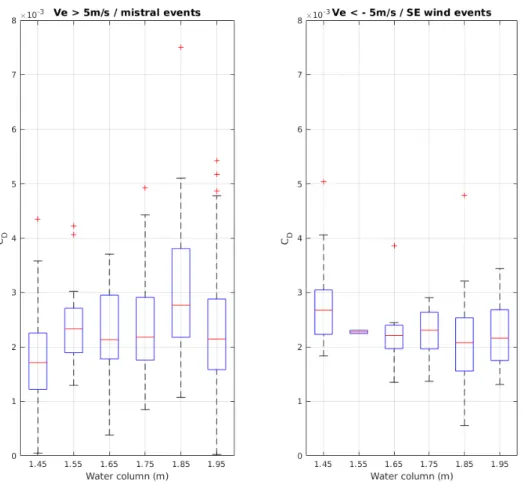
Figure 9 depicts CD boxplot diagrams for Vaccarès lagoon. The presented data is focused
on significant wind events, with wind speed greater than 5 m.s−1, and separated into NW (left
panel) and SE (right panel) wind directions. For great depths, the surface drag coefficients are in the same range for both wind directions. By contrast, for low depths (less than 1.5 m), a measurable difference is observed, with CD in SE wind conditions being higher than in NW wind
conditions by about 30 %. While finer data and/or a wave propagation model would be necessary to provide a comprehensive description of the involved physics, the hypothesis can be raised that, for a given average depth over the studied transect, the bottom slope may play a role in the wave development. In SE wind conditions, the depth decreases along the fetch, forcing the wave
to propagate in shallower conditions, therefore limiting the spectrum development toward lower frequencies, constraining the propagation speed and finally resulting in higher surface drag. By contrast, in NW wind conditions, the depth increases along the fetch, allowing the waves to get longer and to propagate faster, resulting in a relatively lower surface drag than in the opposite wind direction. This effect can be assumed to be stronger at the lowest depths where the bottom slope induces stronger relative variation of depth along the transect. This explains that the difference in CD in opposite wind direction is only observed for the lower recorded depths in figure 9. It
should be borne in mind that this bottom slope effect on CD strictly relates to a modification of
the wave field development while the direct bottom slope effect on the momentum balance remains very slight in the present context, as discussed in Section 2.3.
Figure 9: Boxplot of CD versus the water column in Vaccarès lagoon in case of NW wind events (left chart) and
SE wind events (right chart). Red lines represent medians, blue polygons contain 25-75% of the data, dashed line boundaries contain 10-90% of the data, and red crosses represent extreme points.
4.3. Wind unsteadiness
Wind gusts are generally expected to affect the drag coefficient : high drag coefficients oc-curs when conditions are strongly non-stationary (Drennan et al., 1999; Babanin and Makin, 2008). Uz et al. (2002) and Kudryavtsev and Makin (2004) highlighted that when the wind forcing is mod-ulated in time, the wind stress tends to be higher under decreasing wind than under increasing wind
at a given wind speed. These processes are mainly related to the delayed response of short wind-wave spectra to varying wind forcing. In the present study, no effect of wind gusts on the wind tide were identified. Further experiments with local and high frequency wind and wave measurements are required to better understand the surface drag response to wind unsteadiness.
4.4. Currents
The simplified depth-averaged momentum balance equation used for the present analysis ignores the potential effect of currents on wind tide development. In realistic configurations, the wind stress at the water surface drives a complex three-dimensional balance between free surface slope related to barotropic pressure gradients and a variety of horizontal and vertical circulations depending on the basin morphology and boundary conditions (Csanady, 1973; Orlić et al., 1994), not to mention baroclinic effects. In shallow water, the bottom stress can significantly contribute to the momentum balance, with an increasing effect in shallowing depth or rough bed conditions (Tickner, 1957). Keeping our idealized 1D depth-averaged approach, a first estimate can be provided by introducing an additional term for bottom friction τb/ρwgh in equation 1. This term is usually quadratic:
τb = ρwCbU2 where Cb is the bottom friction and U the current velocity. Typical orders of
magnitude for U can be extracted from the numerical studies performed in Vaccarès (Millet et al., 2010) and Berre lagoons (Alekseenko et al., 2013). In Vaccarès lagoon, a current of 0.08 m/s was predicted during a 8 m/s NW wind event while for Berre lagoon, a 20 m/s NW wind event led to a mean current of 0.12 m/s. Considering a classical value for bottom friction of 0.002 for a smooth sandy bottom (Hsiao S. V. and Shemdin O. H., 1978), the bottom friction term is expected to contribute less than 3% of the free surface slope in Vaccarès/Berre lagoons. This confirms the validity of the initial assumption of a negligible effect of current on wind tide in the present context. A more comprehensive knowledge of the full 3D wind-induced circulation system will be necessary to assess more precisely the role of bottom friction and circulation patterns on the wind tide dynamics (De Marchis et al., 2012).
5. Conclusions
Wind tides are responsible for water level variations and can lead to damaging flooding in low-lying areas. The wind effect is greater in semi-enclosed or enclosed basins and further amplified at shallow depth. The present study is based on a long-term survey of water levels in two shallow coastal lagoons located in the eastern part of the Gulf of Lion, France: Berre lagoon and Vaccarès lagoon. The two field sites were selected owing to their similar wind exposure but different mor-phology and bathymetry. A wide range of wind conditions have been encountered, reaching up to 20 m.s−1. The free surface tilting was studied using two stations deployed along the main axis of
the wind forcing.
The observations showed the expected trend: the higher the wind speed, the steeper the free sur-face slope. They also confirmed that, in shallow lagoon, the 1-D steady depth-averaged momentum balance provides a very satisfactory description of the involved physics. However, the parameter-ization of the surface drag coefficient CD remains an unresolved issue. Existing wind-dependent
parameterization of CDprovided drastic underestimations of the wind tides, up to a factor three for
our shallower site. These findings emphasize the need for a better understanding of the depth-effect on wave development in finite depth and consequently on the surface drag coefficient prediction.
By contrast, the role played by wind gustiness and water circulation on the wind tide amplitude appeared to be negligible compared to wind and depth effects.
Future research work is planned at both sites, with high-resolution high-frequency measure-ments of water levels and currents with the aim of better understanding the wind tide dynamics. Particular attention will be paid on wave field development and the related surface drag coefficient together with the 3D circulation patterns aiming to characterize more finely their contribution in the momentum balance in shallow lagoons, in order finally to improve our ability to predict wind tides.
Acknowledgments
HTM-NET observational network has received recurrent co-financing since 2013 from CNRS/INSU for the national program SOERE, from ILICO-DYNALIT and also from the Toulon Provence Méditerranée (TPM) urban community.
Météo-France is thanked for providing the wind data at the Tour-du-Valat and Marignane meteorological stations.
The support is aknowledged of the Departmental Council of the Bouches-du-Rhône (CD13) for station siting permits, SHOM for their collaboration, Tathy Missamou and Jean-Luc Fuda from the Mediterranean Institute of Oceanography (MIO) for the installation and the maintenance of the stations, Didier Mallarino from the OSU Pythéas institute for the HTM-NET website maintenance and Météo-France for meteorological data.
The Tour-du-Valat foundation and the Camargue National Nature Reserve are acknowledged for their help in installing and maintaining the Vaccarès lagoon stations.
References
Alekseenko, E., Jan. 2013. Modélisation numérique de l’hydrodynamique de l’Etang de Berre: Ap-plication à la recolonisation d’herbiers aquatiques. thesis, Ecole centrale de Marseille, publication Title: http://www.theses.fr (in french).
URL http://www.theses.fr/2013ECDM0016
Alekseenko, E., Roux, B., Sukhinov, A., Kotarba, R., Fougere, D., Apr. 2013. Coastal hydrody-namics in a windy lagoon. Computers & Fluids 77, 24–35.
URL http://www.sciencedirect.com/science/article/pii/S0045793013000571
Babanin, A. V., Makin, V. K., 2008. Effects of wind trend and gustiness on the sea drag: Lake George study. Journal of Geophysical Research: Oceans 113 (C2), _eprint: https://agupubs.onlinelibrary.wiley.com/doi/pdf/10.1029/2007JC004233.
URL https://agupubs.onlinelibrary.wiley.com/doi/abs/10.1029/2007JC004233
Boutron, O., Bertrand, O., Fiandrino, A., Höhener, P., Sandoz, A., Chérain, Y., Coulet, E., Chau-velon, P., Oct. 2015. An Unstructured Numerical Model to Study Wind-Driven Circulation Pat-terns in a Managed Coastal Mediterranean Wetland: The Vaccarès Lagoon System. Water 7, 5986–6016.
Csanady, G. T., Oct. 1973. Wind-Induced Barotropic Motions in Long Lakes. Journal of Physical Oceanography 3 (4), 429–438.
URL https://journals.ametsoc.org/doi/abs/10.1175/1520-0485%281973%29003%3C0429%3AWIBMIL%3E2.0.CO%3B2 Dach, R., Lutz, S., Walser, P., Fridez, P., 2015. Bernese gnss software version 5.2. user manual,
astronomical institute.
URL https://doi.org/10.7892/boris72297
De Lauro, E., De Martino, S., Falanga, M., Riente, M. A., Oct. 2018. Far-field synoptic wind effects extraction from sea-level oscillations: The Venice lagoon case study. Estuarine, Coastal and Shelf Science 210, 18–25.
URL https://www.sciencedirect.com/science/article/pii/S0272771418300064
De Marchis, M., Ciraolo, G., Nasello, C., Napoli, E., 2012. Wind- and tide-induced currents in the Stagnone lagoon(Sicily). Environ Fluid Mech 12, 81–100.
Donelan, M. A., 1982. The dependence of the aerodynamic drag coefficient on wave parameters. Proc. First Int. Conf. on Meteorol. and Air-Sea Interaction of the Coastal Zone, 381–387Publisher: Amer. Meteor. Soc.
URL https://ci.nii.ac.jp/naid/80001732326/
Donelan, M. A., Dobson, F. W., Smith, S. D., Anderson, R. J., Sep. 1993. On the Dependence of Sea Surface Roughness on Wave Development. Journal of Physical Oceanography 23 (9), 2143–2149.
URL https://journals.ametsoc.org/doi/abs/10.1175/1520-0485(1993)023%3C2143:OTDOSS%3E2.0.CO;2 Drennan, W. M., Graber, H. C., Donelan, M. A., Aug. 1999. Evidence for the Effects of Swell and
Unsteady Winds on Marine Wind Stress. Journal of Physical Oceanography 29 (8), 1853–1864, publisher: American Meteorological Society.
URL https://journals.ametsoc.org/doi/full/10.1175/1520-0485%281999%29029%3C1853%3AEFTEOS%3E2.0.CO%3B Farrer, L. A., Jan. 1957. Wind tides on lake Okeechobee. Coastal Engineering Proceedings 1 (6), 7,
number: 6.
URL https://icce-ojs-tamu.tdl.org/icce/index.php/icce/article/view/1872
Garratt, J. R., Jul. 1977. Review of Drag Coefficients over Oceans and Continents. Monthly Weather Review 105 (7), 915–929.
URL https://journals.ametsoc.org/doi/abs/10.1175/1520-0493%281977%29105%3C0915%3ARODCOO%3E2.0.CO%3B2 Gillies, D. K., 1959. Winds and water levels on Lake Erie. Roy. Meteorol. Sot. Can. Branch Publ
9 (1), 12–94.
Harris, D. L., 1957. The Effect of a Moving Pressure Disturbance on the Water Level in a Lake. In: Redfield, A. C., Miller, A. R., Groves, G. W., Harris, D. L., Reid, R. O., Marks, W., Chase, J. (Eds.), Interaction of Sea and Atmosphere: A Group of Contributions. Meteorological Monographs. American Meteorological Society, Boston, MA, pp. 46–57.
Hayami, Y., Fujiwara, T., Kumagai, M., 1996. Internal Surge in Lake Biwa Induced by Strong Winds of a Typhoon. Japanese Journal of Limnology (Rikusuigaku Zasshi) 57 (4-2), 425–444. Hellström, B. M. ., 1941. Wind effects on lakes and rivers. Vol. Handlingar 158 of
Ingeniorsvetenskaps-akademien.
Hsiao S. V., Shemdin O. H., 1978. Bottom Dissipation in Finite-Depth Water Waves. Coastal Engineering, 434–448.
URL https://ascelibrary.org/doi/abs/10.1061/9780872621909.026
Hsu, S. A., Jan. 1974. A Dynamic Roughness Equation and Its Application to Wind Stress Determination at the Air-Sea Interface. Journal of Physical Oceanography 4 (1), 116–120, publisher: American Meteorological Society.
URL https://journals.ametsoc.org/doi/abs/10.1175/1520-0485(1974)004%3C0116%3AADREAI%3E2.0.CO%3B2 Hugues, L. A., 1965. The prediction of surges in the southern basin of lake Michigan. Monthly
Weather Review 93 (5), 292–296.
Jacq, V., Albert, P., Delorme, R., 2005. Le mistral, en 1925 et aujourd’hui : Le mistral - quelques aspects des connaissances actuelles. La Météorologie 50, 30–38 (in french).
URL https://doi.org/10.4267/2042/34821
Janssen, P. A. E. M., Jun. 1989. Wave-Induced Stress and the Drag of Air Flow over Sea Waves. Journal of Physical Oceanography 19 (6), 745–754, publisher: American Meteorological Society.
URL https://journals.ametsoc.org/doi/abs/10.1175/1520-0485(1989)019%3C0745:WISATD%3E2.0.CO;2 Kenney, B. C., 1979. Lake surface fluctuations and the mass flow through the narrows of
Lake Winnipeg. Journal of Geophysical Research: Oceans 84 (C3), 1225–1235, _eprint: https://agupubs.onlinelibrary.wiley.com/doi/pdf/10.1029/JC084iC03p01225.
URL https://agupubs.onlinelibrary.wiley.com/doi/abs/10.1029/JC084iC03p01225 Keulegan, G. H., 1953. Hydrodynamic Effects of Gales on Lake Erie. In: Journal of Research of the
National Bureau of Standards. Vol. 50. pp. 99–109.
Kivisild, H. R., 1954. Wind effect on shallow bodies of water with special reference to lake Okee-chobee: Kungliga Tekniska Högskolans handlingar.
Kudryavtsev, V., Chapron, B., Makin, V., 2014. Impact of wind waves on the air-sea fluxes: A coupled model. Journal of Geophysical Research: Oceans 119 (2), 1217–1236.
URL https://agupubs.onlinelibrary.wiley.com/doi/abs/10.1002/2013JC009412
Kudryavtsev, V. N., Makin, V. K., Apr. 2004. Impact of Swell on the Marine Atmospheric Boundary Layer. Journal of Physical Oceanography 34 (4), 934–949, publisher: American Meteorological Society.
URL https://journals.ametsoc.org/doi/full/10.1175/1520-0485%282004%29034%3C0934%3AIOSOTM%3E2.0.CO%3B Leredde, Y., Dekeyser, I., Devenon, J.-L., 2002. T-S Data Assimilation to Optimise Turbulent
Viscosity: An Application to the Berre Lagoon Hydrodynamics. Journal of Coastal Research 18 (3), 555–567.
Mahapatro, D., Panigrahy, R., Panda, S., et al., 2013. Coastal lagoon: present status and future challenges. International Journal of Marine Science 3.
Metler, W., Bogárdi, I., Duckstein, L., 1975. Effect of wind waves and wind tides on the optimum control of large lakes. Water Resources Research 11 (3), 397–404, _eprint: https://agupubs.onlinelibrary.wiley.com/doi/pdf/10.1029/WR011i003p00397.
URL https://agupubs.onlinelibrary.wiley.com/doi/abs/10.1029/WR011i003p00397 Millet, B., Robert, C., Grillas, P., Coughlan, C., Banas, D., Jan. 2010. Numerical modelling of
vertical suspended solids concentrations and irradiance in a turbid shallow system (Vaccares, Se France). Hydrobiologia 638 (1), 161–179.
URL https://doi.org/10.1007/s10750-009-0038-9
Nomitsu, T., 1935. Surface fluctuations of Lake Biwa caused by the Muroto Typhoon. Mem. Coll. Sci. Kyoto Imp. Univ., A 18 (5), 221–238.
Obermann-Hellhund, A., Ahrens, B., 2018. Mistral and tramontane simulations with changing resolution of orography. Atmospheric Science Letters 19 (9), e848.
Oost, W., Komen, G., Jacobs, C., Van Oort, C., Jun. 2002. New evidence for a relation between wind stress and wave age from measurements during ASGAMAGE. Boundary-Layer Meteorology 103 (3), 409–438.
URL https://doi.org/10.1023/A:1014913624535
Oost, W. A., Mar. 1998. The KNMI HEXMAX stress data – a reanalysis. Boundary-Layer Meteo-rology 86 (3), 447–468.
URL https://doi.org/10.1023/A:1000824918910
Orlić, M., Kuzmić, M., Pasarić, Z., Jan. 1994. Response of the Adriatic Sea to the bora and sirocco forcing. Continental Shelf Research 14 (1), 91–116.
URL https://www.sciencedirect.com/science/article/pii/0278434394900078
Paugam, C., Meulé, S., Sous, D., Faure, V., Rey, V., 2020. Évolutions du niveau d’eau en bassin semi-fermé forcées par le niveau de la mer et le vent : exemple de l’étang de Berre. Paralia, Le Havre (in french).
Platzman, G. W., 1963. The Dynamical Prediction of Wind Tides on Lake Erie. In: Platzman, G. W. (Ed.), The Dynamical Prediction of Wind Tides on Lake Erie. Meteorological Monographs. American Meteorological Society, Boston, MA, pp. 1–44.
URL https://doi.org/10.1007/978-1-940033-54-9_1
Platzman, G. W., 1965. The prediction of surges in the southern basin of lake Michigan. Monthly Weather Review 93 (5), 275–281.
Powell, M. D., Vickery, P. J., Reinhold, T. A., Mar. 2003. Reduced drag coefficient for high wind speeds in tropical cyclones. Nature 422 (6929), 279–283.
Pugh, D. T., Woodworth, P., 2014. Sea-Level Science: Understanding Tides, Surges, Tsunamis and Mean Sea-Level Changes, cambridge u. press Edition. Vol. 68.
URL https://physicstoday.scitation.org/doi/10.1063/PT.3.2753
Rey, V., Dufresne, C., Fuda, J.-L., Mallarino, D., Missamou, T., Paugam, C., Rougier, G., Taupier-Letage, I., 2020. On the use of long term observation of water level and temperature along the shore for a better understanding of the dynamics: Example of Toulon area, France. Ocean Dynamics 70, 913–933.
Saville, T., Jun. 1952. Wind set-up and waves in shallow water. United States, Beach Erosion Board, Engineer Research and Development Center (U.S.)Accepted: 2016-03-16T15:42:15Z Publisher: United States, Beach Erosion Board.
URL https://erdc-library.erdc.dren.mil/jspui/handle/11681/3362
Smith, S., Anderson, R., Oost, W., 1992. Sea surface wind stress and drag coefficients: The hexos results. Boundary-Layer Meteorol 60, 109–142.
URL https://link.springer.com/article/10.1007/BF00122064
Stewart, R. W., Mar. 1974. The air-sea momentum exchange. Boundary-Layer Meteorology 6 (1), 151–167.
URL https://doi.org/10.1007/BF00232481
Taylor, P. K., Yelland, M. J., Feb. 2001. The Dependence of Sea Surface Roughness on the Height and Steepness of the Waves. Journal of Physical Oceanography 31 (2), 572–590.
URL https://journals.ametsoc.org/doi/full/10.1175/1520-0485%282001%29031%3C0572%3ATDOSSR%3E2.0.CO%3B Tickner, E. G., May 1957. Effect of bottom roughness on wind tide in shallow water. This Digital
Resource was created from scans of the Print ResourceAccepted: 2016-03-16T15:42:52Z Publisher: United States, Beach Erosion Board.
URL https://erdc-library.erdc.dren.mil/jspui/handle/11681/3464
Ullmann, A., May 2008. Surcotes dans le Golfe du Lion et conditions atmosphériques: variabilité contemporaine et future (1900-2100). phdthesis, Université de Provence - Aix-Marseille I (in french).
URL https://tel.archives-ouvertes.fr/tel-00305449
UNESCO, 1979. Ninth report of the joint panel on oceanographyc tables and standards. Technical papers in Marine Sciences 30.
Uz, B. M., Donelan, M. A., Hara, T., Bock, E. J., Feb. 2002. Laboratory Studies Of Wind Stress Over Surface Waves. Boundary-Layer Meteorology 102 (2), 301–331.
URL https://doi.org/10.1023/A:1013119313063
Ward Peter, R. B., 1979. Seiches, tides, and wind set-up on Lake Kariba. Limnology and Oceanography 24 (1), 151–157, _eprint: https://aslopubs.onlinelibrary.wiley.com/doi/pdf/10.4319/lo.1979.24.1.0151.
Willmott, C. J., Jul. 1981. On the Validation of Models. Physical Geography 2 (2), 184–194, pub-lisher: Taylor & Francis _eprint: https://doi.org/10.1080/02723646.1981.10642213.
URL https://doi.org/10.1080/02723646.1981.10642213
Wu, J., 1969. Wind stress and surface roughness at air-sea interface. Journal of Geophysical Research 74 (2), 444–455.
Wu, J., May 1980. Wind-Stress coefficients over Sea surface near Neutral Conditions—A Revisit. Journal of Physical Oceanography 10 (5), 727–740.
URL https://journals.ametsoc.org/doi/abs/10.1175/1520-0485(1980)010%3C0727%3AWSCOSS%3E2.0.CO%3B2 Young, I. R., Verhagen, L. A., Dec. 1996. The growth of fetch limited waves in water of finite depth.
Part 1. Total energy and peak frequency. Coastal Engineering 29 (1), 47–78.