Aerodynamic Performance Measurements
of a Film-Cooled Turbine Stage
by
Rory Keogh
B. Eng., Mechanical Engineering, University College Galway, (June 1989)
S.M., Aeronautics and Astronautics, Massachusetts Institute of Technology, (February 1998)
Submitted to the Department of Aeronautics and Astronautics in partial fulfillment of the requirements for the degree of
Doctor of Philosophy
at the
Massachusetts Institute of Technology
February 2001
@
Massachusetts Institute of Technology. All rights reserved./
Department of Aeronautics and Astronautics November 29, 2000MASSACHUSETTSINRUTE OF TECHNOLOGY
SEP 112001
Dr. Gerald R. Guenette Principal Research Engineer, Committee Chairman
()
Professor Alan H. Epstein R. C. Maclaurin Pfissor of Aeronautics and AstronauticsProfessor Jack L. Kerrebrock Professor of Aeronautics and Astronautics, Emeritus
Professor Nesbitt W. Hagood Associate Professor of Aeronautics and Astronautics Chairman, Department Graduate Committee
Aero
AM-r Certified by. Certified by. Certified by Accepted by.Aerodynamic Performance Measurements
of a Film-Cooled Turbine Stage
by
Rory Keogh
Submitted to the Department of Aeronautics and Astronauticson November 29, 2000, in partial fulfillment of the requirements for the degree of Doctor of Philosophy
Abstract
The goal of this research is to measure the aerodynamic performance of a film-cooled turbine stage and to quantify the loss caused by film-cooling. A secondary goal of the research is to provide a detailed breakdown of the losses associated with film-cooling for the turbine stage being tested.
The experimental work was carried out at the MIT Blowdown Turbine Facility using a highly loaded turbine stage. The Blowdown Turbine Facility is a short duration test facility capable of testing turbine stages under fully scaled conditions for a test duration of 0.5 seconds. The facility was modified to enable the measurement of the turbine mass flow and shaft torque. These newly developed measurement techniques, along with previously developed total pressure and temperature instruments, have enabled the measure-ment of the stage isentropic efficiency. A highly loaded turbine stage (without film-cooling) was designed, fabricated, and tested using the newly developed measurement techniques. The turbine stage was then modified to incorporate vane, blade and rotor casing coolant manifolds using precision electrical discharge machining. The film-cooling hole geometry was created using a laser drilling process to produce the required 43,000 cooling holes. The film-cooled stage was then tested over a range of operating conditions (pressure ratios and corrected speeds) and over a range of coolant-to-mainstream mass flow and temperature ratios. The loss due to film-cooling is defined as the difference in performance between the film-cooled turbine and an ideal turbine with the same velocity triangles and airfoil Mach number distributions. However, there is no uncooled turbine geometry that will produce the same flow conditions as the film-cooled turbine stage, and consequently, there is no experimental baseline that can be tested to determine the loss due to film-cooling. A meanline velocity triangle model of the turbine stage was developed using published correlations and loss models to estimate the performance of this ideal stage. The model was calibrated against the baseline test results without coolant and it was then used to estimate the loss due to film-cooling.
The estimated loss due to film-cooling was 3.0% at the design point, which corresponds to 0.3% per percent of coolant. The estimated repeatability (U9 5) for the efficiency measurement of the uncooled
tur-bine geometry is ± 0.14%. Based on this measurement repeatability, the net effect of a design change can be determined with an uncertainty of just ±0.1% if four measurements are repeated for each design configuration. The estimated measurement uncertainty for the film-cooled stage efficiency is 0.55% and for back-to-back measurements the uncertainty is 0.45%.
Thesis Supervisor: Dr. Gerald R. Guenette Title: Principal Research Engineer
Acknowledgments
I would like to express my gratitude to Dr. Gerald R. Guenette for his guidance and direction throughout the course of this research. I also wish to thank Professor Alan H. Epstein for his guidance, and for being a great teacher and mentor; to Professor Jack L. Kerrebrock who's guidance and feedback is gratefully acknowledged.
I would also like to thank all the members of the 'pit crew' who contributed to the success of this research. They include; Chris Spadaccini, Jason Jacobs, Ldo Grdpin, and Yi Cai. Also a special thanks to James Letendre, Viktor Dubrowski, and Bill Ames for their invaluable assistance in running this experiment; to Mariano Hellwig and Tom Ryan for their instrumentation assistance; to Holly Anderson for all the money. I wish to thank all the Engineers of Alstom Power (formerly ABB) who contributed to this research, especially Dr. Thomas P. Sommer. Also all of the vendors, without who's efforts this work would not have succeeded; Laser Services Inc., Johnson Precision Inc., Peterson Machine Corp., and Mal Tool.
In addition would like to thank the students of the Gas Turbine Laboratory who have made my experience here an enjoyable one, especially; Zolti, Luc, Amit, Adam, Asif, John, Bret, Jinwoo, and Duncan; also a special thanks to Lori Martinez for improving the atmosphere for all of the students at the Lab; and to Dr. Choon Tan for all of the insightful discussions over the past five years.
Finally I'd like to thank my family for all of their support, especially my wife Glenna for her forbearance while I pursued my dreams.
Contents
1 Introduction 21
1.1 Motivation . . . . 21
1.2 Previous Work . . . . 24
1.3 Objective and Approach . . . . 26
1.4 Thesis Outline . . . . 27
2 Blowdown Turbine Test Facility 29 2.1 Introduction.. . . .. . .. . . . .. . .. . . . .. . . . .. . 29
2.2 Facility Configuration . . . . 29
2.2.1 Introduction . . . . 29
2.2.2 Supply Tank and Fast Acting Valve . . . . 32
2.2.3 Turbine Test Section . . . . 32
2.2.4 Downstream Translator . . . . 32
2.2.5 Eddy Current Brake Torque Meter . . . . 33
2.2.6 Critical Flow Venturi Nozzle . . . . 35
2.2.7 Coolant Feed System . . . . 35
2.3 Film-Cooled Turbine Stage Design . . . . 36
2.3.1 Introduction . . . ... . . . .. . 36
2.3.2 Film-Cooled Nozzle Guide Vane . . . . 37
2.3.3 Film-Cooled Rotor Blade . . . . 37
2.3.4 Film-Cooled Rotor Tip casing . . . . 38
2.4 Test Procedures . . . . 39
2.5 Facility Scaling and Setting Run Conditions . . . . 40
2.6 Instrumentation . . . . 40
2.6.1 Introduction . . . . 40
2.6.2 Total Temperature Instrumentation . . . . 41
2.6.5 Shaft Power Measurement . . . . 43
2.6.6 Turbine Mass Flow Measurement . . . . 43
2.7 Data Acquisition . . . . 46
2.8 Instrument Calibration . . . . 46
2.8.1 Pressure Transducer Calibration . . . . 46
2.8.2 Power Measurement System Verification Tests . . . . 48
2.9 Summary . . . . 50
3 Experimental Results and Data Reduction 51 3.1 Introduction. . . . .. .. . . . .. . . . . 51
3.2 Baseline Turbine Test Results . . . . 52
3.2.1 Baseline Test Data Reduction Procedures . . . . 52
3.2.2 Turbine Performance Map . . . . 69
3.2.3 Turbine Inlet Temperature . . . . 76
3.3 Film-Cooled Test Results . . . . 77
3.3.1 Film-Cooled Data and Data Reduction . . . . 77
3.3.2 Film-Cooled Turbine Performance Map . . . . 82
3.3.3 Inlet Temperature Test Matrix . . . . 88
3.4 Summary . . . . 88
4 Dissection of Film-Cooled Turbine Isentropic Efficiency 91 4.1 Background . . . . 91
4.2 Discussion . . . . 93
4.3 Summary . . . . 96
5 Performance of an Ideal Uncooled Turbine Stage 97 5.1 Introduction . . . . 97
5.2 Analytical Approach . . . . 98
5.2.1 Boundary Layer Calculations . . . . 99
5.2.2 Coolant Injection Loss -Mixing Model Analysis . . . . 104
5.2.3 Meanline Velocity Triangle Model . . . . 107
5.3 Loss Predictions . . . .111
5.3.1 Profile Losses . . . .111
5.3.2 Endwall Losses . . . . 114
5.4 R esults . . . . 118
5.4.1 Corrected Mass Flow . . . . 118
. . . . 12 6 . . . . 126 5.5 Summary . . . .
6 Film-Cooling Loss Breakdown
6.1 Introduction. . . . .. . . . . . 6.2 Approach . . . .
6.2.1 Mainstream Coolant Mixing Loss
6.2.2 Coolant Pumping Loss . . . .
6.2.3 Coolant System Loss . . . .
6.3 Results . . . . 6.3.1 Coolant Manifold Calibrations
6.3.2 Comparison of Overall Results 6.3.3 Film-Cooling Loss Breakdown. 6.4 Summary . . . .
7 Concluding Remarks
7.1 Objective and Approach . . . .
7.2 Observations and Conclusions . . . .
7.3 Recommendations for Future Work . . . A Measurement Uncertainty
A.1 Pre-Test Uncertainty Analysis . . . . A.2 Post-Test Uncertainty Evaluation . .
B Appendix B
B.1 Multi Inflow Turbine Isentropic Exit Temperature C Trailing Edge Loss Model
161 . . . . 161 163 135 135 136 136 137 138 142 142 145 147 151 153 153 154 155 157 157 159 5.4.2 Isentropic Efficiency . . . . . . . .
List of Figures
1-1 Nozzle guide vane cooling schemes. . . . . 1-2 Simple Cycle Analysis. . . . . 1-3 Simple Cycle GT Yearly Revenue and Costs . . . . 2-1 MIT Blowdown Turbine Facility ...
2-2 Test Section Flow Path . . . . 2-3 Test Section Detail . . . . 2-4 Eddy Current Brake . . . .
2-5 CriticalFlow VenturiNozzle. . . . .
2-6 Coolant Feed System Schematic. . . . . 2-7 Film-Cooled Nozzle Guide Vane. . . . . 2-8 Film-Cooled Rotor Blade. . . . .
2-9 Eddy Current Brake Load Cell . . . .
2-10 Differential Pressure Transducer Calibration . . . . 2-11 Normalized Pressure Transducer Scale - PT45R3 . . . . 2-12 Normalized Rotor Inertia 'Run-to-Run' . . . . ..
3-1 3-2 3-3 3-4 3-5 3-6 3-7 3-8 3-9 3-10 3-11
Rotor Mechanical Speed . . . . Brake Torque . . . . Turbine vs. Brake Power . . . . Inlet Circumferential Temperatures . . . .
Inlet Radial Temperature Profile... Turbine Inlet Temperature . . . . Inlet and Outlet Pressures . . . . Nozzle and Turbine Mass Flow . . . . Downstream Temperatures . . . . Downstream Pressures . . . .
Corrected Mass Flow from Supply Tank fit to Nozzle Corrected Flow . . . . 22 24 25 30 31 33 34 35 36 37 37 43 47 48 49 54 55 55 56 57 57 58 60 61 62 63
3-12 Turbine Total-to-Total Pressure Ratio 3-13 Turbine Corrected Speed . . . . 3-14 3-15 3-16 3-17 3-18 3-19 3-20 3-21 3-22 3-23 3-24 3-25 3-26 3-27 3-28 3-29 3-30 3-31 3-32 3-33 3-34 3-35 3-36 3-37 3-38
3-39 Isentropic Efficiency vs. Coolant Mass Flo 3-40 Corrected Mass Flow vs. Coolant Mass Fl 3-41 Isentropic Efficiency vs. Turbine Inlet Tem 3-42 Isentropic Efficiency vs. Turbine Inlet Tem 4-1 Schematic Representation of a Multi-Flow 4-2 Schematic Representation of a Multi-Flow
w Ratio ow Ratio
perature perature
Cooled Turbine. . .
Cooled Turbine with a Carnot Cycle. 4-3 Schematic Representation of a Film-Cooled Turbine. . .
4-4 Lost Work Due to Thermal Mixing in a Cooled Turbine. . . . . . . . . 6 5
66 Turbine Corrected Mass Flow . . . .
Turbine Reduced Power . . . . Turbine Ideal and Measured Power . . . . Isentropic Efficiency . . . . Baseline Operating Points - 50% Tip Gap . . . . . Baseline Operating Points - Design Tip Gap . . .
Isentropic Efficiency Curve Fit - 50% Tip Gap Isentropic Efficiency Curve Fit - Design Tip Gap Isentropic Efficiency vs. Pressure Ratio . . . . Isentropic Efficiency vs. Corrected Speed . . . . . Corrected Mass Flow Curve Fit 50% Tip Gap . . Corrected Mass Flow Curve Fit Design Tip Gap Corrected Mass Flow vs. Pressure Ratio . . . . Corrected Mass Flow vs. Corrected Speed . . . .
Isentropic Efficiency vs. Turbine Inlet Temperature Cooling System Temperatures . . . . Cooling System Pressures . . . . Coolant Mass Flow . . . . Film-Cooled Operating Points . . . . Isentropic Efficiency vs. Operating Point . . . . Isentropic Efficiency vs. Pressure Ratio . . . . Isentropic Efficiency vs. Corrected Speed . . . . . Corrected Mass Flow vs. Operating Point . . . . . Corrected Mass Flow vs. Pressure Ratio . . . . Corrected Mass Flow vs. Corrected SDeed . . . . .
92 93 95 96
5-1 5-2 5-3 5-4 5-5 5-6 5-7 5-8 5-9 5-10 5-11 5-12 5-13 5-14 5-15 5-16 5-17 5-18 5-19
5-20 Comparison of Axisymmetric vs. 1D Injection . . . . . 5-21 Comparison of Turbine Stage Model and Measured Effi 5-22 Comparison of Turbine Stage Model and Measured Effi
. . . . ciency . . . . ciency . . . . . . . . . . . . . . . . . . . . . . . . Model Summary -Baseline Corrected Speed . . . . .
Model Summary -Baseline Pressure Ratio . . . . Model Summary - Coolant . . . . Model Summary -Film-Cooled Corrected Speed . . . Model Summary - Film-Cooled Pressure Ratio . . . .
Stream Surface Defintion . . . . m ' - 9 coordinate systen . . . . MISES Computational Grids . . . . Freestream Mach Number Distributions . . . . Measured Profile Isentropic Mach Number (Osnaghi) vs. CFD Prediction. . . . . . Vane M ixing Layers. . . . . Constant Pressure Coolant Injection. . . . . Measured Profile Isentropic Mach Numbers for Deferent NGV Coolant Flow Rates Film-Cooled Velocity Triangles. . . . . Vane Entropy Loss Coefficent vs. Isentropic Exit Mach Number . . . . Blade Entropy Loss Coefficent vs. Isentropic Exit Mach Number . . . . Blade Entropy Loss Coefficent vs. Incidence Angle . . . . Effect of Cpb on Blade Entropy Loss Coefficient . . . . Vane Entropy Loss Coefficent -Profile and Endwall . . . . Blade Entropy Loss Coefficent - Profile and Endwall . . . . Baseline Corrected Mass Flow vs. Turbine Stage Model . . . . Measured and Turbine Stage Model Corrected Mass Flow vs. Coolant MFR . . . . Film-Cooled Corrected Mass Flow vs. Turbine Stage Model . . . . Turbine corrected mass flow with different mixing model assumptions . . . .
Schematic of the Coolant Feed System .. . . . . Rotor Coolant On-Board Injection Velocity Triangles. . . . . Vane manifold model calibration results. . . . . Blade manifold model calibration results. . . . . Casing manifold model calibration results. . . . . Isentropic Change Efficiency vs. Coolant Momentum Flux Ratio Overall loss breakdown. . . . . Vane loss breakdown .. . . . . Blade loss breakdown. . . . .
137 139 143 144 144 146 148 148 149 . . .. ... 100 . . . . . 100 . . . . . 101 . . . . . 102 . . . . . 103 . . . . . 104 . . . . . 104 (Osnaghi).105 . . . . . 107 . . . . . 112 . . . . . 113 . . . . . 114 . . . . . 115 . . . . . 116 . . .. ... 117 . . . . . 120 . . . . . 121 . . . . . 122 . . . . . 124 . . . . . 125 . . . . . 128 . . .. ... 129 . . . . . 130 . . . . . 131 . . . . . 132 . . . . . 133 . . . . . 134 5-23 5-24 5-25 5-26 5-27 6-1 6-2 6-3 6-4 6-5 6-6 6-7 6-8 6-9
6-10 Overall stage loss using different modeling assumptions. . . . . 150
List of Tables
2.1 Vane Cooling Holes. . . . . 38 2.2 Blade Cooling Hole Arrangement . . . .
2.3 MIT Blowdown Turbine Scaling. . . . . 2.4 Blowdown Turbine Instrumentation. ... 2.5 Blowdown Turbine Instrumentation, continued 2.6 Blowdown Turbine Data Acquisition . . . . 3.1 Baseline Turbine Test Matrix . . . . 3.2 Baseline Turbine Performance Map . . . . 3.3 Film-Cooled Turbine Test Matrix . . . . 3.4 Coolant Orifice Configurations . . . .
3.5 Film-Cooled Turbine Performance Map . . 6.1 Design Point Coolant Loss Summary . . . .
. . . . 3 8 . . . . 4 1 . . . . 4 4 . . . . 4 5 . . . . 4 6 . . . . 5 3 . . . . 7 0 . . . . 7 8 . . . . 7 9 . . . . 8 2 . . . . 14 7 A.1 Pretest Uncertainties . . . .
A.2 Post-Test Uncertainties . . . .
158 160
. . . . . . . .
Nomenclature
Roman
h Specific enthalpy (J/kg) s Specific entropy (kJ/kgK) I Rotor inertia (kg m2 ) A Area (M 2)L Characteristic length scale (m)
M Mach number
Mass of test gas between turbine and venturi (kg) P Pressure (Pa) Re Reynolds number T Temperature (K) U Velocity (m/sec) V Volume (m3)
Greek
a Swirl angle (rad) #3 Flow exit algle (rad) e Total blade turbing (rad) 77 Efficiency
7 Specific heat ratio
V Kinematic viscosity (m2/sec)
W Angular speed (Hz) Q Angular speed (rad/sec)
#
Equivalence ratio p Density (kg/m 3)
0 Momentum thickness (m)
r Time constant (sec) * Displacement thickness (m)
Entropy loss coefficient
Subscripts
a Turbine inlet c Turbine exit
Compressor Coolant
b Rotor inlet (NGV exit)
is Isentropic
g Upstream
h Heatshield (or Casing)
n Nozzle guide vane
r Rotor
Turbine radial exit location n Mixed out
t Total conditions Turbine
th High pressure turbine NGV throat
ti Low pressure turbine
s Stored between turbine and venturi
pr Due to pressure loss
T Tangential
Full quantities
Cp Specific heat at constant pressure (J/kgK) Cd Discharge coefficient
C.j Ideal gas critical flow coefficient C, Real gas critical flow coefficient
Nc Corrected speed, % of design PC Corrected power, % of design We Corrected mass Flow, % of design
Lref Reference length (m)
in
Mass flow rate (kg/sec)7ladia Adiabaticity efficiency
Pt Total pressure (Pa) Pb Base pressure (Pa) P Turbine power (W)
PIdeal Ideal turbine power (W)
Q
Heat loss (W)Red Reynold's number of critical flow ventui nozzle
T Total temperature (K)
T Turbine Torque (Nm)
Acronyms
ASME American Society of Mechanical Engineers
ANSI American National Standards Institiute
BDT Blowdown Turbine
CEESI Colorado Experimental Engineering Station, Inc.
CFD Computational Fluid Dynamics CFVN Critical Flow Venturi Nozzle C02 Carbon Dioxide
DAQ Data Acquisition System DC Direct Current
ECB Eddy Current Brake
EDM Electrical Discharge Machining GTL Gas Turbine Laboratory
HPT High Pressure Turbine
MISES Multiple blade Interacting Streamtube Euler Solver
MIT Massachusetts Institute of Technology
NIST National Institute of Standards and Technology
NGV Nozzle Guide Vane NPV Net Present Value
Chapter 1
Introduction
1.1
Motivation
To meet the demand for higher power densities from gas turbine systems, designers have devoted much effort over the past half-century toward increasing turbine inlet temperature. This has been accomplished through the development of both extraordinary turbine and disk materials and sophisticated internal and external cooling arrangements. The aerodynamic performance of turbines has likewise increased enormously, leading to polytropic efficiencies in the low 90% range. This efficiency increase has come through improved design techniques based on a better understanding of the fluid mechanics of turbines and the application of increasingly more powerful computational tools.
With the gas temperature much higher than the turbine material can tolerate, cooling must be applied to keep the metal temperature close to uniform and within allowable limits, to avoid thermal stress and surface oxidation, and to control the life of the parts. For this purpose, elaborate cooling schemes have been devised that distribute cooling air around the airfoil surface, using relatively cool air extracted from the compressor. Figure 1-1 illustrates the different cooling schemes that can be implemented individually or in combination. They include: internal convective cooling, internal impingement cooling, and film-cooling. Internal cooling (cooling airflow inside the hollow turbine airfoil) aims at absorbing the heat conducted into the blade thereby reducing the blade temperature without affecting the external fluid dynamics. Film-cooling, on the other hand, bleeds coolant air through holes or slots on the airfoil surface, forming a thin 'film' barrier between the hot surrounding gas and the blade. High pressure first stage turbines often use as much as 15-20% of compressor core mass flow as cooling air, with considerable penalties on turbine aerodynamics. In this context, it is highly desirable to optimize the cooling distribution and effectiveness and minimize the cooling flow requirement.
Modern state of the art commercial transport engines have turbine inlet temperatures of over 1700K, and it is higher for military engines with shorter turbine life. This temperature level, however, is much less
Mainstream Flow
Impingement Cooling
Convective Cooling
Trailing Edge Injection
Figure 1-1: Nozzle guide vane cooling schemes.
than the stoichiometric combustion temperature of -:2500K ', so that there is still a substantial margin for improvement. The benefits to be achieved from the employment of progressively more elaborate external film-cooling schemes must be weighed against a variety of design issues. One critical issue is the impact of main flow/coolant flow interactions on turbine aerodynamic performance. The increase in turbine inlet temperature has come at the expense of turbine aerodynamic efficiency. The ability to quantitatively measure such penalties, however, has always been in question.
Many investigations on the interaction of the coolant flow with the turbine main flow have focused on the heat transfer problem. This is understandable given that small changes in the inlet temperature produce dramatic changes on the cycle performance and on the structural integrity and life of the highly stressed turbine components. Achieving the desired balance between these competing factors is a challenging task in the design process.
It is worthwhile illustrating the degree to which increased turbine inlet temperatures improve the cycle performance. Two figures of merit commonly used to describe the performance of a gas turbine are the cycle efficiency and the specific work. Figures 1-2(a) and 1-2(b) show the cycle efficiency and specific work for the simple cycle depicted in figure 1-2(a). This illustrative example assumes that the turbine heat load is proportional to the difference between the mainstream and metal temperatures, and a constant cooling system effectiveness. The assumptions are presented in Appendix A. Three examples are shown: the first assumes an ideal turbine that does not require cooling, the second is for a turbine that is cooled but without
incurring any additional loss, and the third is a turbine with cooling and loss. The efficiency of the cooled turbine with additional cooling system loss is assumed to decrease by 0.3% for each percent of coolant flow2. The cycle efficiency and specific work increase dramatically with turbine inlet temperature for the ideal turbine. The improved cycle efficiency and specific work are offset significantly for the cooled turbine. The additional reduction in efficiency and specific work is small for the cooled turbine with increased loss. For this simple example, the cycle efficiency cannot be increased past ; 1700K if compressor discharge air is used to cool the turbine. However, the specific work continues to increase up to a turbine exit temperature of ~ 2300K. Both the cycle efficiency and specific work can be increased significantly by reducing the amount of compressor air required to cool the turbine.
The reduced cycle efficiency due to a drop in HPT efficiency is small compared to the direct impact of cooling on the cycle performance. Only 20% of the reduction in cycle efficiency (when comparing the ideal turbine and the cooled turbine with additional HPT loss) is due to the additional HTP loss. The remaining 80% is due to the use of compressor discharge air as a heat sink for the cooled turbine. From a cycle perspective, this flow goes through the system and incurs loss without producing any useful work. This simple example illustrates why so much attention has been focused on improving cooling effectiveness and thereby reducing the coolant flow rate, and comparatively little attention has been focused on the impact of coolant injection on the turbine performance. Figures 1-2(a) and 1-2(b) appear to suggest that the impact of cooling on the turbine performance is a second order effect.
So why try and quantify this loss with a greater degree of accuracy than can be obtained through experience based on past designs? The answer is based on business and not technical considerations alone. Companies that design and manufacture gas turbines are often required to sell their product to launch customers when the design is in the preliminary design phase, and there is a high degree of uncertainty associated with the predicted performance. Any shortcomings in the performance of the delivered product result in penalties against the manufacturer. These penalties are intended to protect the operator from unreasonable performance claims by the manufacturer.
It is worthwhile considering a financial example to illustrate how a shortfall in the performance of the delivered product will impact the net income of the gas turbine operator. Figure 1-3 contains the results of a simple worksheet that illustrates how a one-percent shortfall in the HPT performance affects the net income of a utility that operates a single 179MW simple cycle gas turbine. The net income for the utility is the difference between two large numbers, so a small shortfall in performance can have a dramatic impact on the net income. A one-percent drop in the HPT efficiency results in a reduced NPV income, over the 30
3 years that the gas turbine will operate, of 7 million dollars. This corresponds to approximately 20% of the cost of the gas turbine, which is a major component of the overall cost of the plant. If the penalties incurred are commensurate with the cost to the operator, it is reasonable to assume that a one-percent shortfall in
2
This assumption is shown to be reasonable in Chapter 5. 3
This example assumes a discount rate of 10% and that fuel, O&M and electricity prices increase at 2.5 % per annum. The sources for the fuel, o&m, electricity and capital equipment costs are cited in reference [15].
1400 1600 1800 2000 2200 2400 2600
Turbine Inlet Temperature, K
1400 1600 1800 2000 2200 2400
Turbine Inlet Temperature, K
(a) Cycle Efficiency vs. Turbine Inlet Temperature (Illus- (b) Cycle Specific Work vs. Turbine Inlet Temperature
trative). (Illustrative).
Figure 1-2: Simple Cycle Analysis.
the cooled turbine efficiency would eliminate a substantial portion of the profit from the sale of the gas turbine. Gas turbine manufacturers cannot simply be conservative with their performance predictions, as this will result in lost sales and a failure to capitalize on the true performance of the design. Any error in performance predictions will result in reduced profits for the gas turbine manufacturer. With this in mind, the uncertainty associated with the turbine loss due to cooling has very serious implications for the development of new and derivative gas turbines. The current research is motivated primarily by the uncertainty associated with the loss due to turbine cooling.
1.2
Previous Work
Relatively few detailed experimental studies have been published that investigate the performance penalties due to film-cooling in turbines. The following three studies have measured the loss due to cooling:
* Vlasic et al. (1996) tested a high work single-stage research turbine with a pressure ratio of 5.0, and a stage loading of 2.2, and a cooled rotor and stator. The tests were carried out in a cold flow test rig and a meanline efficiency audit was used to compare the results with a gas generator test rig. The effect of cooling, as measured in the cold flow rig, reduced the turbine efficiency by 2.1%. The nozzle guide vane cooling scheme used showerhead film-cooling and an internal cooling passage with pressure
A Profit = $M 0.6 $M 60 -$M 50 -$M 40 0 Net Profit MO&M $M 30 - Fuel Cost $M 20 -$M10 -Delivered Predicted
Figure 1-3: Simple Cycle GT Yearly Revenue and Costs
surface ejection. The rotor cooling used a multipass configuration with trailing edge injection. The vane and blade cooling flow rates were 7.5% and 3.5% respectively, as a percentage of the vane inlet flow.
9 Nouse et al. (1975) investigated the influence of turbine cooling on the performance of a two-stage axial turbine with an overall pressure ratio of 4.08. The aerodynamic characteristics of the two-stage turbine without coolants were tested in a cold flow test rig. The first stage of the two stage turbine was then tested with coolants in a gas generator test rig. The nozzle guide vane and rotor used a combination of internal convective cooling and trailing edge ejection. The total cooling flow rate was 8.9%, 2.5% of which was rotor cooling. The first stage uncooled efficiency was estimated using stationary interstage total pressure and temperature measurements. Comparing this with the cooled single stage efficiency, the authors estimated an efficiency reduction of 8.3% due to cooling.
* Crow et al. (1980) tested a turbine, uncooled and with stator and rotor cooling, as part of the joint P&W-NASA Energy Efficient Engine (E3) program. They demonstrated an efficiency drop of 2.5% due to cooling. This result was reported by Vlasic (1996). The reference cited by Vlasic reported the uncooled measurements only. The cooling configuration studied by Crow was not published.
The stage cooling configuration studied in this thesis is more advanced than those studied by Vlasic and Nouse. The NGV cooling consists of 'full coverage' film-cooling, which consists of shower head, pressure and suction surface film-cooling, trailing edge ejection, and endwall film-cooling. The rotor blades have leading edge ejection, and pressure and suction surface film-cooling.
1.3
Objective and Approach
The goal of this research is to measure the aerodynamic performance of a film-cooled turbine stage and to quantify the loss caused by film-cooling. The main challenges are; Firstly, to develop a method of testing the turbine stage that models all of the relevant fluid physics, is repeatable enough to be measure the impact of design changes, and is economically feasible; Secondly, to identify the loss caused by film-cooling from the overall performance measurement.
Detailed experimental study of coolant flow interactions is impossible in the engine operational environ-ment as a result of the extremely high temperatures and oxidizing conditions present in engine turbines. The technology to perform measurements within this environment at the required level of detail and accu-racy is well beyond our current capability. In an effort to overcome these limitations a technology based on short duration testing was developed. Over the past two decades, short duration test facilities have been successfully used to study turbine heat transfer phenomena. The planned approach for the current research program was extend the measurement capabilities of the short duration test facility to include the ability to make stage efficiency and mass flow measurements. These new measurement techniques could then to
be used to study how film-cooling affects the aerodynamic performance of a film-cooled turbine stage. It is difficult to identify the loss caused by film-cooling from the overall performance measurement. To extract the loss due to film-cooling, the results should be compared with an ideal stage that has the same velocity triangles and airfoil Mach number distributions, but without coolant injection. However, the film-cooling flow is an integral part of stage design and it is required to maintain the airfoil Mach number distributions and stage reaction. If the stage is tested without coolant, the reaction rate will decrease and the resulting efficiency will be lower than that of the ideal stage. If the blockage caused by film-cooling was known, the airfoil profile and endwall contours could be redesigned to account for the coolant deficit, and thereby maintain Mach number distributions and boundary layer parameters, similar to the ideal stage. However, this would result in larger airfoil trailing edge thicknesses, an increased trailing edge loss and a change in the trailing edge deviation angle. As the trailing edge loss is one of the most poorly understood turbine loss mechanisms, a change in the trailing edge thickness is not desirable. Also the blockage caused by coolant injection cannot be precisely predicted. There is no uncooled turbine geometry that would give the same Mach number distributions and stage velocity triangles as the film-cooled stage (if an approximate uncooled geometry was available it could only be used to simulate a single coolant flow rate). Consequently, there is no experimental baseline that can be tested to directly determine the loss due to film-cooling.
Alternatively, an analytical model of the stage meanline velocity triangles can be used to predict the performance of the ideal stage, and thereby estimate the loss due to film-cooling. In the current study, the uncooled geometry was tested (i.e. the same blades without cooling holes), and the results were used to calibrate a meanline velocity triangle model of the stage. This model was then used to estimate the performance of the ideal stage and the losses due to film-cooling. This model was subsequently used to provide a detailed breakdown of the cooling losses and also to identify the cooling system losses that are
unique to the MIT blowdown turbine facility.
1.4
Thesis Outline
The remainder of the thesis is organized into the following chapters.
The experimental apparatus used for the current research program is discussed in Chapter 2. The basics of the blowdown turbine facility and the test turbine procedures are described. Particular emphasis is given to the newly developed instrumentation to measure the turbine stage mass flow and shaft torque. The results of the two experimental test series are presented in Chapter 3. The data reduction procedure and the assessment of data accuracy are also presented. Chapter 4 presents the definition of turbine efficiency used for the experiment and the analytical models. In Chapter 5 a meanline velocity triangle model of the turbine stage is used to estimate performance of an ideal turbine stage without cooling, that has the same velocity triangles and work output as the film-cooled stage. Chapter 6 presents a detailed breakdown of the losses associated with film-cooling. A final summary and conclusion are provided in Chapter 7, with the contribution of this thesis outlined. Recommendations for future work are also discussed.
Chapter 2
Blowdown Turbine Test Facility
2.1
Introduction
The MIT Blowdown Turbine Facility is a short-duration, blowdown wind tunnel capable of testing a com-plete, rotating stage in an environment which rigorously simulates the fluid physics and heat transfer phenomena that occur in a turbine. This chapter reviews the MIT Blowdown Turbine facility. Overall configuration and operational procedures are described. Scaling of the turbine operating point to achieve full scale similarity is discussed. The individual components of the facility are examined as well as in-strumentation and the recently modified coolant feed system. The data acquisition system is also briefly presented.
2.2
Facility Configuration
2.2.1
Introduction
The MIT Blowdown Turbine test facility is shown in Figure 2-1. The facility consists of seven primary components: the supply tank, fast acting valve, test section, eddy current brake torque meter, critical flow venturi nozzle, coolant feed system (not shown), and dump tank. A detailed review of the overall design of the facility can be found in Guenette [8].
Critical Flow Venturi Eddy Current Brake Dump Tank
arter Motor
I Housing I- 1 meter 3.Figure 2-1: MIT Blowdown Turbine Facility Test Section
Upstream
Rake
Downstream
Discharge
Turbine Translator
Flow
Throttle
Eddy
Plate
Brake
Slip Rings
Shaft
Drive Motor
2.2.2
Supply Tank and Fast Acting Valve
The supply tank is a 364 cubic foot cylindrical pressure vessel rated at 150 psi. It is surrounded by an external jacket through which heat transfer oil is circulated to heat the tank to the desired test temperature. A stirring fan is employed to ensure a uniform test gas temperature distribution. The test section is separated from the supply tank by a fast-acting, axially traversing, plug valve. This valve is designed to fully open in approximately 50 milliseconds and introduce disturbance-free flow into the test section. Valve dynamics are controlled by damping chambers which produce a force on the plug whose magnitude and direction depend on its position and velocity. In its fully closed position, this force acts to seal the plug. After the seal is broken, the valve plug is accelerated open. As it nears its fully open position the plug is decelerated to rest. The force used to break the seal is provided by an internal pneumatic piston assembly actuated by a small compressed gas cylinder.
2.2.3 Turbine Test Section
A cut-away of the test section assembly is shown in Figures 2-3 and 2-2. The test section is composed of the
forward frame, main frame, and the rotor unit. The forward frame contains the nozzle guide vanes, NGV coolant supply plenum and the inlet boundary layer bleeds and mates to the main valve. The forward frame is followed by the main frame which houses the turbine rotor assembly, the downstream probe translator package, the eddy current brake magnet assembly, the turbine throttle and drive motor. The rotor unit contains the rotor discs, blades, bearings, shaft, and the eddy current brake 'loss' drum (not shown). As shown in Figure 2-2, the loss drum is inserted into the eddy current brake magnet assembly.
A cross-sectional view of the test section flow path is shown in Figure 2-2. Upstream of the turbine stage
a boundary layer bleed provides clean inlet flow. The rotor exit flow is exhausted through an adjustable throttling area to provide the desired pressure ratio across the turbine. Also shown in this figure are the up-stream and downup-stream measurement locations (upup-stream rake and downup-stream translator). Downup-stream, the total temperature and pressure probes are mounted on a circumferential translator.
2.2.4 Downstream Translator
Both upstream and downstream circumferential translators are available to provide measurement of non-axisymmetric features of the turbine flow field. Both are composed of drums forming the inner annulus of the turbine entrance and exit and are mounted on thin-line bearings. For the experiments reported herein only the downstream translator was employed. The downstream translator houses three 'canisters', spaced
200 apart, which contain the appropriate the electrical and pneumatic connections to support either total
temperature or pressure rakes. Connections are also provide for several wall static pressure taps. The translator is restricted to a 3500 rotation angle, by a spring loaded hard stop, to prevent the translator from freely spinning and destroying the canisters' electrical wiring. The translator is driven by a Baldor
Outer Boundary Layer Bleed Exhaust Vane Manifold Heatshield Manifold Boundary -Layer Bleed Rotor Cooling Manifold Blade Coolant Outer
Boundary Layer Supply Bleed Exhaust
Figure 2-3: Test Section Detail
ME-4090-BLBCE servomotor delivering approximately 3(in-lb) of torque through an equivalent 13.5:1 gear ratio. This motor is controlled by a Galil DMC-400-10 card and powered by a Copley MB6-10 amplifier. In addition to the hard stop, an aluminum shear pin is installed on the shaft coupling exiting the servomotor to prevent translator runaway.
2.2.5
Eddy Current Brake Torque Meter
The eddy current brake serves as both the turbine load and the turbine torque meter. It consists of two components, a cylindrical, Inconel drum directly attached to the rotor shaft and a stationary array of DC excited electromagnets arranged circumferentially around the drum. Electric currents are induced in the drum as it rotates through the applied magnetic field. The flow of this current through electrical resistance of the drum dissipates the power produced by the turbine, which appears as resistive heating of the drum. Turbine speed is controlled by setting the magnitude of the applied magnetic field. The braking system was modified by Keogh [11] to serve as a shaft torque meter. The electromagnet assembly was mounted on bearings and force required to restrain the brake was measured using two load cells. Figure 2-4 shows a cross
section through the brake. A detailed description of the brake and its modification for torque measurement is presented in Section 2.6.5 of this thesis.
Main Frame Iron Core Magnet Coils -Brake Drum -Shaft
/
\ / Radial Bearings : Load Cell Drive Motor2.2.6
Critical Flow Venturi Nozzle
As part of this research, a critical flow venturi was developed and installed in line with the exit flow path to measure the mass flow rate through the turbine. The nozzle design and upstream duct requirements are based the ANSI standard [16] for toroidal throat critical flow venturi. Modifications to the facility were required to install the critical flow venturi nozzle. The main design challenge was to incorporate the required upstream duct length into the facility given the space restrictions. This was accomplished by installing the critical flow venturi and the upstream duct inside the dump tank (Figure 2-1). A 66 inch extension was added between the dump tank and main frame in order to relocate the eddy current brake and starter motor and provide a space to install the venturi inlet flow conditioning duct. Extensions were also required to connect the boundary layer bleeds to the dump tank, and to connect the fill system to the supply tank. A 50% open area screen is installed at the entrance to the upstream duct. This reduces the total pressure non-uniformity caused by the stepped transition from annular to circular cross section around the starter motor. The nozzle was calibrated with the upstream duct and a simulated blockage in place. The nozzle was designed and built by Flow Systems Inc. of Boulder Colorado and calibrated by Colorado Experimental Engineering Station Incorporated. This calibration is traceable to the National Institute for Standards and Technology (NIST). A cross-section of the critical flow venturi nozzle is shown in Figure 2-5 and a more detailed review of its design and usage can be found in Keogh [11].
10 - - - - - - -
---Figure 2-5: Critical Flow Venturi Nozzle
2.2.7
Coolant Feed System
The coolant system consists of a coolant supply tank, a fast-acting pneumatic ball valve, a pipe network, and several orifice plates for metering the flow. Like the facility itself, the cooling system operates in a blowdown mode. The existing facility coolant system was modified to provide three independent and
separately metered streams to the rotor blades, vanes, and tip casing. The coolant supply tank is 3.97 ft 3
and has a pressure rating of 450 psi. Like the main supply tank, it is surrounded by a metal jacket and insulation to controlling tank temperature. A flow of liquid nitrogen mixed with compressed air is used to cool the tank lining and the test gas to the desired temperature. The fast-acting ball valve at the tank exit is actuated by a 1000 psi argon bottle. It is triggered simultaneously with the main valve and closes approximately 1.2 seconds later. The piping network feeds the coolant from the supply tank into the test section and to the turbine.
Figure 2-6 shows a schematic of the cooling system. Three independent feeds are employed. One each to the rotor blades, nozzles, and tip casing. The flow is split in a manifold downstream of the ball-valve. Each split is metered by a thick, square edged, choked orifice with known discharge coefficient which accurately sets the mass flow ratios to each turbine component.
Manifold
x- Blades
- -NGVs
Coolant Supply Tank Tip Casing
Ball Valve
m Choked Orifice * Pressure Transducer x Thermocouple Figure 2-6: Coolant Feed System Schematic
2.3
Film-Cooled Turbine Stage Design
2.3.1 Introduction
This Section presents a description of the fabrication of the film-cooled turbine stage. In order to quantify the losses due to coolant flow injection, the 1 scale film-cooled model turbine was required to have similar4 external geometry, including the film hole quantity, distribution, diameters, and injection orientations over the airfoil surfaces. The internal passages were not directly replicated since the focus the program was on external aerodynamic and heat transfer. After an initial series of tests were performed on the uncooled model stage, work then proceeded on the development and testing of the film-cooled version. As a result of programmatic considerations, it was decided to modify the existing solid un-cooled turbine airfoils. This was accomplished by the use of sophisticated machining techniques, such as electrical discharge machining
(EDM) and laser machining. Fabrication of the film-cooled turbine proved to be difficult, costly, and time consuming. The complex geometry of the holes and passages pushed existing manufacturing technologies to their limits. The cooling hole geometries and machining techniques will be reviewed here.
Figure 2-7: Film-Cooled Nozzle Guide Vane. Figure 2-8: Film-Cooled Rotor Blade.
2.3.2
Film-Cooled Nozzle Guide Vane
The scaled film-cooled nozzle guide vane can be seen in Figure 2-7. The vane cooling configuration consists of 12 rows of coolant injection holes on the airfoil surface, as well as several holes on the upper and lower platforms. Table 2.1 summarizes the important features of this layout. Two vertical channels were required to feed all of the airfoil surface cooling holes. Coolant was supplied to the platform holes via manifolds above and below the locations where the vanes mate to the facility.
2.3.3
Film-Cooled Rotor Blade
The scaled film-cooled turbine blade can be seen in Figure 2-8. The blade cooling configuration consists of five rows of coolant injection holes: two on the leading edge, one on the suction surface and one on the
Table 2.1: Vane Cooling Holes
Row/Group
#
of Holes Diameter Location1 14 0.028" Trailing Edge 2 44 0.008" Pressure Surface 3 51 0.008" Pressure Surface 4 26 0.008" Pressure Surface 5 28 0.008" Leading Edge 6 21 0.008" Leading Edge 7 29 0.008" Leading Edge 8 19 0.008" Leading Edge 9 45 0.008" Suction Surface 0 42 0.008" Suction Surface 11 40 0.008" Suction Surface 12 22 0.008" Pressure Surface A 107 0.008" Outer Platform B 91 0.008" Inner Platform
Table 2.2: Blade Cooling Hole Arrangement
Row
#
of Holes Diameter Location 1 17 0.008" Suction Surface2 29 0.008" Leading Edge
3 29 0.008" Leading Edge
4 26 0.008" Suction Surface
pressure surface. The leading edge holes are also oriented at a compound angles. The numbers and sizes of the holes are summarized in Table 2.2.
The internal passages of the engine turbine blades have not been replicated. The purpose of this work is to study the effects of film-coolant injection; therefore, only simple manifold channels through the blade are needed. Two channels were used to feed the blade cooling holes; one for the leading edge and suction surface rows, and one for the pressure surface row. These passages provide a relatively constant wall thickness. The trailing edge holes proved too difficult to manufacture, as the design required a an 0.008" hole to be drilled through .1 of material. The blade plenums were sealed at the blade tips by laser welding end caps onto the blade.
2.3.4
Film-Cooled Rotor Tip casing
The rotor tip casing (the outer annulus wall surrounding the blade tips) also requires film-cooling holes. The engine tip casing geometry could not be directly scaled and accommodated in the MIT Blowdown Turbine facility. As a result, a geometry, which provided the same coolant flow, but could be fabricated for use in the Blowdown Turbine, was devised. This configuration consists of two rows of film-cooling holes located at the leading and trailing edges of the tip-casing ring. There are 1544 leading edge holes with a 0.012"
diameter and 1200 trailing edge holes with a 0.015" diameter.
2.4
Test Procedures
Preparations for a blowdown experiment begin by determining the required conditions for achieving full-scale turbine operating point. These consist of the upstream total temperature and pressure, coolant total temperature and pressure, test gas composition, mechanical speed, throttle area, and brake excitation. The experiment then proceeds as follows:
1. The entire facility is evacuated and the throttle plate is positioned for a predetermined area based on operational experience.
2. The main supply tank is heated to the desired upstream total temperature and is brought to thermal equilibrium.
3. The main valve is sealed and the supply tank is filled with the required test gas mixture to the desired upstream total pressure.
4. Simultaneously, the coolant supply tank is filled to the desired pressure and cooled to the predeter-mined temperature.
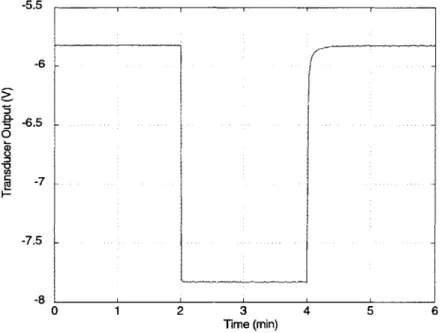
5. At this post-fill state, all differential pressure transducers are calibrated by cycling their back-pressure ports between vacuum and atmosphere. This provides a scale factor for each transducer. Instrumen-tation and calibration are discussed in further detail in Section .
6. The brake excitation is set.
7. The data acquisition system and translator servo-motor controller are set to stand-by mode and are waiting to be triggered.
8. The turbine rotor is then accelerated to the desired mechanical speed by a starter motor.
9. Once this speed is exceeded, the motor is powered down and the rotor spins freely in the vacuum. It is slowly decelerated by bearing friction and the applied back EMF of the drive motor .
10. When the decelerating rotor reaches the preset speed, a trigger occurs causing the main valve and coolant ball valve to open. Simultaneously, the data acquisition system begins collecting data, the downstream translator begins it traverse, and the eddy current brake torque meter is energized. 11. The test gases then flow through the test section and quasi-steady state operation is reached after a
300 ms transient. The useful test window is approximately 500 ms.
13. The rotor decelerates and comes to a stop.
14. Once the gas inside the tunnel stabilizes, all differential pressure transducers are re-calibrated to check for drift.
15. The tunnel is then re-evacuated and cooled to room temperature.
2.5
Facility Scaling and Setting Run Conditions
Validity of scaled wind tunnel experiments depends on similarity between the test flow and the actual flow being simulated. In dimensionless form, the equations for mass continuity, momentum and energy trans-fer produce nondimensional parameters which completely characterize the physics of flow field. Similarity between experiment and reality only requires that these nondimensional parameters be reproduced. For an un-cooled turbine stage operating under adiabatic conditions, corrected mass flow and total tempera-ture ratio (or efficiency) depend on four dimensionless parameters: total pressure ratio, corrected speed, Reynolds number, and specific heat ratio [8]. Two additional parameters are required to simulate the heat flux distribution: the gas to wall temperature ratio and the Prandtl number. For a film-cooled turbine test, the coolant mass and momentum flux ratios must also be reproduced. These parameters, which govern test similarity, can be matched by properly setting the facility initial operating conditions. The operating conditions consist of the test gas composition, upstream total temperature and pressure, coolant total tem-perature and pressure, mechanical speed, throttle area, and brake excitation. The supply tank temtem-perature is set by matching the gas to wall temperature ratio. Specific heat ratio is matched by setting the test gas mixture ratio, typically Argon and C02. Shaft mechanical speed is set by matching the corrected speeds. Initial supply pressure is set by the Reynolds number, and pressure ratio by the downstream throttle posi-tion. Table 2.3 summarizes the conditions of a typical blowdown experiment and compares them to that of a full scale engine.
2.6
Instrumentation
2.6.1 Introduction
The facility was designed to provide a rather benign experimental environment for flow measurement. The nature of the short duration experiment places a strict requirement on the time response of instrumentation used to sample its flow field. These measurements also require a high level of instrumentation accuracy. These considerations led to the development of improved total temperature and pressure instrumentation with the capability of accurately characterizing turbine performance. The design of this new instrumentation is detailed by Cai [3]. An uncertainty analysis for the total temperature and pressure measurements is also presented by Cai. Following this is a brief explanation of other instrumentation used in the Blowdown
Table 2.3: MIT Blowdown Turbine Scaling
Parameters Full Scale Engine MIT BDT
Geometric Scale 1.0 0.25
Ratio of Specific Heats, y 1.28 1.28 Working Fliud Air Argon - CO2
Reynolds Number 5.6 x 10⁶ 5.6 x 10⁶ Turbine Pressure Ratio 2.0 2.0 Inlet Total Pressure 15 atm 7 atm Exit Total Pressure 7.5 atm 3.5 atm Metal/Gas Temp. Ratio 0.65 0.65 Mean Metal Temperature 1100K 300 K Inlet Total Temperature 1700K 464 K Turbine Corrected Speed 100% 100% Design Rotor Speed 3600rpm 5954rpm Design Mass Flow 312kg/s 23.3kg/s
Turbine Power Output 91MW 1.26MW
Test Time Continuous 0.5sec
Turbine. Finally, the standard differential pressure transducer calibration procedure is discussed followed by a description of the data acquisition system.
2.6.2
Total Temperature Instrumentation
The work of Cai focused on reducing the transient errors resulting from the heat transfer processes within the thermocouple junction support wires and led to a design with much faster time response than previously achieved. Attention was also paid to the probe head design to reduce probe sensitivity to flow angle, which is important for downstream wake measurements. The measurement heads consist of 0.0005 inch diameter type K thermocouple junctions mounted in vented stagnation tubes. The rake probe is mounted on the downstream translator and contains an internal temperature reference junction. An identical probe with four heads is also mounted on the downstream translator and a stationary six head version is mounted upstream of the turbine. The radial rake of 6 heads is positioned roughly mid-way between two of the facility's inner annulus support struts. The inlet rake can employ either an internally mounted or external reference junction. Three additional single head probes, spaced 120' apart, are mounted upstream at mid-span on the inlet annulus. The thermocouple reference junctions for these probes are external. Three total temperature probes are dedicated to monitoring the flow through the critical flow venturi nozzle. These probes are also 0.0005" diameter type K thermocouples and have similar time response and accuracy to the upstream probes. The cooling system is instrumented with seven type K thermocouples. These probes do not require the time response of the turbine inlet and outlet sensors and employ 0.003" junctions. These probes are located at points upstream of the choked metering orifices and as close as possible to where the coolant enters the test section. All thermocouples, with the exception of the turbine inlet and outlet rakes, are referenced to Omega TRCIII ice point cells. The signals are processed using high stability DC