HAL Id: insu-01627782
https://hal-insu.archives-ouvertes.fr/insu-01627782
Preprint submitted on 28 Mar 2019
HAL is a multi-disciplinary open access
archive for the deposit and dissemination of
sci-entific research documents, whether they are
pub-lished or not. The documents may come from
teaching and research institutions in France or
abroad, or from public or private research centers.
L’archive ouverte pluridisciplinaire HAL, est
destinée au dépôt et à la diffusion de documents
scientifiques de niveau recherche, publiés ou non,
émanant des établissements d’enseignement et de
recherche français ou étrangers, des laboratoires
publics ou privés.
Fevbre, Regis Dupuy, Christophe Bernard, Gérard Ancellet, Kathy S. Law,
Boris Quennehen, et al.
To cite this version:
Gwennolé Guyot, Frans Olofson, Peter Tunved, Christophe Gourbeyre, Guy Fevbre, et al..
Charac-terization of the cloud microphysical and optical properties and aerosol-cloud interaction in the Arctic
from in situ ground-based measurements during the CLIMSLIP-NyA campaign, Svalbard. 2019.
�insu-01627782�
Characterization of the cloud microphysical and optical
1properties and aerosol-cloud interaction in the Arctic from
2in situ ground-based measurements during the
CLIMSLIP-3NyA campaign, Svalbard
45 6
Gwennolé GUYOT1, Frans OLOFSON1, Peter TUNVED2, Christophe GOURBEYRE1, Guy
7
FEVBRE1, Régis DUPUY1, Christophe BERNARD1, Gérard ANCELLET3, Kathy LAW3,
8
Boris QUENNEHEN4, Alfons SCHWARZENBOECK1, Kostas ELEFTHERIADIS5, Olivier 9
JOURDAN1
10 11
1 Laboratoire de Météorologie Physique (LaMP), Université Blaise Pascal (UBP), OPGC,
12
CNRS UMR 6016, Clermont-Ferrand, France 13
2 Department of Applied Environmental Science (ITM), Stockholm University, Stockholm,
14
Sweden 15
3 Laboratoire Atmosphère, Milieux et Observations Spatiales (LATMOS), IPSL, UPMC,
16
CNRS UMR 8190, Paris 17
4 Laboratoire de Glaciologie et Géophysique de l’Environnement (LGGE), Université
18
Grenoble Alpes/CNRS, 38041 Grenoble, France 19
5 Environmental Radioactivity Laboratory, Institute of Nuclear and Radiological Science &
20
Technology, Energy & Safety, Attiki, Greece 21
22
Abstract
23 24
This study will focus on cloud microphysical and optical characterization of three different 25
types of episodes encountered during the ground based CLIMSLIP-NyA campaign performed 26
in Ny-Alesund, Svalbard: the Mixed Phase Cloud (MPC), snow precipitation and Blowing 27
Snow (BS) events. These in situ cloud measurements will be combined with aerosol 28
measurements and air mass backtrajectory simulations to qualify and parameterize the arctic 29
aerosol cloud interaction and to assess the influence of anthropogenic pollution transported into 30
the Arctic. 31
The results show a cloud bimodal distribution with the droplet mode at 10 µm and the crystal 32
mode centered at 250 µm, for the MPC cases. The precipitation cases presents a crystal 33
distribution centered around 350 µm with mostly of dendritic shape. The BS cases show a 34
higher concentration but smaller crystals, centered between 150 and 200 µm, with mainly 35
irregular crystals. 36
A “polluted” case, where aerosol properties are influenced by anthropogenic emission from 37
Europe and East Asia, was compared to a “clean” case with local aerosol sources. These 38
anthropogenic emissions seem to cause higher Black Carbon, aerosol and droplet 39
concentrations, a more pronounced accumulation mode, smaller droplet sizes and a higher 40
activation fraction Fa. Moreover, the activation diameter decreases as the droplet diameter
41
increases and Fa increases showing that smaller particles are activated and droplets grow when
42
the aerosol number decreases. This is in agreement with the first (Twomey) and second 43
(Albrecht) aerosol indirect effect. The quantification of the variations of droplet concentration 44
and size leads to IE (Indirect Effect) and NE (Nucleation Efficiency) coefficients values around 45
0.2 and 0.43, respectively. These values are close to those found by other studies in the arctic 46
Atmos. Chem. Phys. Discuss., https://doi.org/10.5194/acp-2017-672 Manuscript under review for journal Atmos. Chem. Phys.
Discussion started: 1 November 2017 c
region which confirms these parameterizations of arctic aerosol-cloud interaction in climate 47 models. 48
1 Introduction
49 50The Arctic is a region where the surface warming is faster than the global average warming, 51
associated with, in particular, a rapid melting of the sea ice in summer (Vaughan et al., 2013). 52
This is the so-called arctic amplification. Several studies indicate that the arctic warming is 53
mainly of anthropogenic origin (e.g., Mc Guire et al., 2006, Serreze and Francis, 2006). The 54
arctic amplification is due to several positive feedbacks specific to the Arctic, the most 55
important being the sea ice melting feedbacks (Screen and Simmonds, 2010). Changes in 56
atmospheric and oceanic circulation, cloud properties (especially cloud cover) and atmospheric 57
water vapor amount are highly expected but their quantification remains uncertain. Specially, 58
the effects of clouds dominate the intermodal standard deviation of a temperature rise due to an 59
increase of atmospheric CO2 concentration (Dufresne and Bony, 2008).
60 61
Recent remote sensing studies have shown that the clean and stable arctic atmosphere is 62
characterized by a high occurrence of mixed phase clouds (MPC) all year long, except in winter 63
and early spring when ice clouds are important (Mioche et al., 2015). However, the Svalbard 64
region is an exception where MPC are the most frequent cloud independent of season (Mioche 65
et al., 2015). Moreover, the altitude of the MPC is highly dependent of the height of the 66
inversion layer. The frequently occurring situation with a stable atmosphere and the low level 67
pronounced inversion layer promotes low level clouds of stratus form (Curry et al., 1996). The 68
arctic MPC are composed of a liquid layer on top and below which is located the mixed phase 69
where ice crystals take form (Gayet et al., 2009). If the crystals grow enough, a precipitation 70
layer is produced below the cloud. The dynamics together with possible surface coupling and 71
advection are essential to maintain the MPC during several days (Morrison et al., 2012). This 72
structure results from a complex network of interactions between numerous local and larger 73
scale processes that complicates the understanding of the MPC properties evolution and its 74
impact on arctic climate (Morrison et al., 2012). In the Arctic, the umbrella effect is not 75
necessarily dominant compared to the cloud greenhouse effect (Quinn et al., 2008), which 76
suspects that clouds play an important role in the arctic amplification. Several studies have 77
revealed that MPCs have a large impact on the surface radiative flux in the Arctic (e.g. Kay et 78
al., 2012, Wendisch et al., 2013). 79
80
Arctic cloud properties are linked to aerosol properties since they can act as Cloud 81
Condensation Nuclei (CCN) or Ice Nuclei (IN). Thus, aerosol seasonal variability and transport 82
from lower latitudes play a role in cloud properties evolution. Studies have shown an arctic 83
annual mean aerosol concentration half that for mid-latitudes. The stable atmosphere and the 84
dark winter promote growth by coagulation/coalescence of the particles, i.e. an increase in size 85
and decrease in concentration, with dominant accumulation mode (Tunved et al., 2013). When 86
the sun rises during spring, these big particles, which can come from lower latitudes, generate 87
the arctic haze phenomenon (Quinn et al. 2007). The stronger sun light gives rise to increasing 88
photochemical activity associated with new particle formation and a dominant Aitken mode 89
(Engwall et al., 2008). Moreover, the ice melting exposes land surfaces that can act as aerosol 90
sources. Therefore, the aerosol concentration increases until its maximum in summer. These 91
features were observed in Alaska (Quinn et al., 2002) and Svalbard (Tunved et al., 2013), 92
proving that they are representatives of the aerosol properties evolution in the Arctic. 93
The rapid change in aerosol properties occurring in spring is known to cause changes in arctic 95
cloud properties, the so-called aerosol indirect effect. Increase in aerosol concentration with 96
constant Liquid Water Path (LWP) is known to increase cloud droplet concentration and cloud 97
optical thickness but decrease droplet size (Twomey, 1974, 1977), decrease the precipitation 98
efficiency and increase the cloud lifetime (Albrecht, 1989). Also, in a temperature rise scenario, 99
the cloud height is expected to increase (Pincus and Baker, 1994). The impacts of anthropogenic 100
aerosol transported to the Arctic on clouds are not fully understood, but Garrett and Zhao (2006) 101
showed that the cloud emissivity is higher for polluted case, contributing to the arctic warming. 102
103
In the case of artic MPC where liquid and ice phases coexist, the aerosol-cloud interaction is 104
complexified by the addition of the ice phase and several interaction mechanisms have been 105
assumed. Lohmann (2002a, 2002b) proposed that an increase in ice nuclei could increase the 106
cloud ice content at the expense of the liquid content. This so-called glaciation indirect effect 107
would mean, as the precipitation is more efficient for the ice phase, a decrease in cloud cover 108
in lifetime. The riming indirect effect predicts a riming efficiency decrease due to the 109
supercooled droplet size decrease. Thus, an increase in Cloud Condensation Nuclei (CCN) 110
could lead to a decrease in Ice Water Content (IWC) and ice particles concentration (Borys et 111
al., 2003). According to the data of the two measurement campaigns ISDAC (Indirect and
Semi-112
Direct Aerosol Campaign) and MPACE (Mixed-Phase Arctic Cloud Experiments), Jackson et al. 113
(2012) found a correlation corresponding to the glaciation effect above the cloud liquid phase 114
but no evidence of the riming effect. Mc Farquhar et al. (2011) showed that the aerosol size is 115
the main parameter to explain the particles activation and that the chemical properties don’t 116
determine the ability of an aerosol to act as a CCN, i.e. the Kelvin effect is dominant compared 117
to the Raoult effect in the Arctic. 118
119
The work presented here is included in the frame of the project CLIMSLIP (CLimate IMpacts
120
of Short-LIved Pollutants in the polar region). The main objective of this project is to reduce the
121
uncertainties of the radiative forcing due to the anthropogenic emissions of tropospheric ozone,
122
methane and aerosol including Black Carbon (BC). This article will focus on the arctic ground 123
based in situ cloud and aerosol measurement study, performed at the Mount Zeppelin station 124
(474 meters altitude), in Ny-Alesund, Svalbard, performed during spring 2012. First, a 125
classification and characterization of the different types of cases will be presented. Then, a 126
comparison between a polluted and a clean case will be made, based on air masses 127
backtrajectories. In the end, the different aerosol-cloud interactions will be discussed and, if 128
possible, quantified. 129
130
2 Site & instrumentation
131 132
2.1 Site
133 134
The campaign was carried out between February 26 and May 2 at the Mount Zeppelin station 135
(78°56'N, 11°53'E) located south-west of the Ny-Alesund village, Svalbard, at an altitude of 474 136
meters above sea level. This station presented in Figure 1 was built and is managed by the 137
Norwegian Institute for Air Research (NILU). The Zeppelin observatory is mostly unaffected by
138
local sources and is considered to be within the boundary layer most of the time (Tunved et al.,
139
2013). This station represents remote arctic conditions and is a part of the European observation
140
network ACTRIS (Aerosols, Clouds, and Trace gases Research InfraStructure network).
141
Continuous measurements of atmospheric trace gases and aerosol physical and chemical properties
142
Atmos. Chem. Phys. Discuss., https://doi.org/10.5194/acp-2017-672 Manuscript under review for journal Atmos. Chem. Phys.
Discussion started: 1 November 2017 c
are performed all year long. The station is also equipped with instruments to measure temperature,
143
humidity and wind speed and direction.
144
A ceilometer, CL51 model, was installed in the Ny-Alesund village at sea level. This remote 145
sensing instrument is designed to measure the clouds within an altitude range between 0 and 15 146
km. It uses the technology of a lidar with a laser wavelength at 910 nm. During CLIMSLIP, the 147
ceilometer was used to retrieve the approximate altitude of the mixed phase and the liquid layers 148
and showed good agreement with the microphysical measurements. However, in some cases, 149
fog or an optically thick ice layer prevents the laser beam from penetrating within the cloud 150 system. 151 152 153 154
Figure 1: Picture of the Mount Zeppelin station (www.npolar.no) 155
156
2.2 Instrumentation and data processing
157 158
2.2.1 Cloud instrumentation 159
160
The cloud ground based instrumentation used during CLIMSLIP-NyA was installed on a 161
measurement pole and is presented in Figure 2. The cloud optical and microphysical properties 162
were thus assessed by three independent instruments: a PMS Forward Scattering Spectrometer 163
Probe (FSSP-100), a Cloud Particle Imager (CPI) and a Polar Nephelometer (PN). They were 164
all connected to the same pump by plastic tubes, leading to the sampling volume indicated on 165
Figure 2. They were operated approximately 2 m above the platform level and mounted on a 166
tilting and rotating mast, allowing them to be moved manually in the prevailing wind direction. 167
The proper alignment of their inlet with the flow was based on the wind direction measurements 168
performed by a mechanical and ultrasonic anemometer. 169
170
The FSSP-100 measures the number and the size of particles going through the sampling 171
volume, from the forward scattering of a 632.8 nm wavelength laser beam (Knollenberg, 1981, 172
Dye and Baumgardner, 1984). Using the Mie theory, this instrument is dedicated to droplets. 173
The Particle Size Distribution (PSD) is thus computed in 15 adjustable size classes with 174
uncertainties on the effective diameter and LWC of respectively 2 µm and 30 % (Febvre et al., 175
2012). 176
The CPI is an imager and takes pictures of the particles when going through the detection 177
parameters are also retrieved and are used to classify the sampled particle in 10 shape 180
categories: spheroid, needle, column, plate, bullet, stellar, graupel, rosette, sideplane and 181
irregular (Lefèvre, 2007). However, a manual classification has been done during the 182
CLIMSLIP campaign due to some malfunctions of the automatic classification. The 183
determination of the IWC is realized according to the Baker and Lawson (2006) and Lawson 184
and Baker (2006) method. The uncertainties on the concentration and the effective diameter are 185
assessed respectively as 50 % and 80 %. 186
The PN measures the scattering phase function of a set of cloud particles thanks to a 804 nm 187
wavelength laser beam and 56 photodiodes distributed over scattering angles between 3.5° and 188
172.5° (Gayet et al., 1997). From the scattering phase function can be computed two important 189
integrated optical parameters, the extinction coefficient and the asymmetry parameter with 190
accuracies estimated within 25% and 4%, respectively (Gayet et al., 2002). 191
The Nevzorov probe is a hot wire device at constant temperature with two captors and an 192
electrical resistor. The particles are vaporized, and an electrical power is provided to the 193
resistor. The resulting power is relied related to the LWC and TWC, depending on the captor 194
(Korolev et al., 1998). Due to high discrepancies, this instrument was used only for instrumental 195
comparison and data processing analysis and will not be discussed further. 196
197
198
Figure 2: Cloud instrumentation used during CLIMSLIP. Indicated are: particle size range, 199
main cloud properties measured and theoretical sampling speed. 200 201 202 2.2.2 Aerosol instrumentation 203 204
The particle inlet at the Mount Zeppelin station is a Whole Air Inlet, which possesses a heating 205
system that prevents the inlet to be filled by ice or frost and to evaporate the condensed water 206
or ice. Thus, all the aerosols (CCN, IN or interstitial) are sampled by the instruments described 207
hereafter. The aerosol sampling covers particles sizes between 3 and 809 nm (Tunved et al., 208
2013). 209
210
The Mount Zeppelin aerosol instrumentation is composed of one Condensation Particle Counter 211
(CPC), one Differential Mobility Particle Sizer (DMPS), one aethalometer and one aerosol 212
nephelometer, which are running continuously throughout the year. The CPC, 3015A model, is 213
a particle counter for aerosol diameters larger than 3 nm. It measures aerosol concentration up 214
to 105 particles/cm3 with an accuracy of 10 % (TSI, 2002). The DMPS is a CPC combined with
215
a Differential Mobility Analyzer (DMA), which allows selecting different size ranges. The 216
aerosol PSD is obtained with 22 diameter classes going from 25 to 809 nm. The aethalometer 217
assesses the Black Carbon (BC) concentration based to the optical extinction of the aerosols 218
Atmos. Chem. Phys. Discuss., https://doi.org/10.5194/acp-2017-672 Manuscript under review for journal Atmos. Chem. Phys.
Discussion started: 1 November 2017 c
collected on a filter (see Eleftheriadis et al., 2009, for details). The nephelometer measures the 219
aerosol scattering coefficient for three wavelength: 450, 550 and 700 nm (TSI, 2005). During 220
CLIMSLIP, this nephelometer was used with a time resolution of 5 minutes. 221
222
2.2.3 Data processing 223
224
The three cloud instruments operated at a one Hz resolution. The data processing has followed 225
the conclusions of the cloud instrumentation study presented in Guyot et al. (2015). This paper 226
highlights the biases that can exist between the instruments and the need of an Ensemble of 227
Particles Probe (EPP) to standardize the data. In the case of the CLIMSLIP campaign, such 228
correction was not possible for two reasons not developed further. (1) Strong discrepancies of 229
the EPP Nezvorov probe, probably because of a too low sampling speed. (2) The 230
standardization according to the extinction coefficient of the PN is not consistent with the 231
aerosol data (there are more droplets than CCN). Thus, this study will not provide quantitative 232
results but qualitative ones based on case comparisons and variation studies. 233
According to Guyot el al. (2015), measurements with an angle between the instruments 234
orientation and the wind direction higher than 30° can modify the PSD due to changes in the 235
sampling conditions. Those measurements were therefore not taken into account for the study. 236
Moreover, the ground based low sampling speed induces low sampling rate, especially for the 237
CPI with values between 0.5 and 20 sampled particles per minute. This doesn’t allow us to 238
work on low time resolution scale. To get sufficient particle statistics, the minimum average 239
time resolution will be 1 minute for the FSSP and one day for the CPI. 240
241
During the aircraft campaign, a cloud particle can break on impaction with the inlet due to the 242
high sampling speed corresponding to the plane speed. This results in more numerous and 243
smaller droplets or crystals and creates artifacts in the PSD (Rogers et al., 2006). Due to the 244
low sampling speed, ground based measurements has the advantage to avoid this effect, but at 245
the expense of the sampling rate. 246
247 248
3 Identification and characterization of the study cases
249 250 3.1 Overview 251 252 253
Several kinds of episodes were met during CLIMSLIP. Figure 3.a shows those episodes with 254
the time series of measured temperature and relative humidity. Thus, according to the 255
ceilometer measurements and observations, we enumerate: 256
- 4 episodes of sampling of the liquid and mixed phase layer (LMPL) of MPC, on March 257
11th and 29th and April 27th and 28th.
258
- 3 cases of sampling of the precipitation layer of MPC, on March 28th and April 14th and
259
20th.
260
- 2 occurrences of Blowing Snow (BS), on March 23th and 31th. 261
263 264
265 266
267
Figure 3: a) Time series of the temperature and relative humidity measured at the Zeppelin 268
station. The different cases are plotted with colored columns. Examples of time series of the 269
ceilometer attenuated backscattered coefficient profile in km-1 sr-1 for b) MPC case (April
270
27th) and c) precipitation case (April 14th). 271
272 273
The cases called “LMPL” and “Precipitation layer” both reveal the presence of a MPC, i.e. 274
where cloud in situ instrumentation sampled ice and/or liquid particles. But, in the first case, 275
the ceilometer shows the liquid layer around 500 meters altitude (Figure 3.b). This liquid layer 276
having a very strong extinction coefficient, the ceilometer beam does not go through, what 277
happens above the liquid layer is therefore unknown. On the same time, droplets are sampled 278
by the FSSP. Following the altitude of the cloud, the station is in the liquid layer or the mixed 279
phase layer. These episodes are characterized by relative humidity maximum. 280
Atmos. Chem. Phys. Discuss., https://doi.org/10.5194/acp-2017-672 Manuscript under review for journal Atmos. Chem. Phys.
Discussion started: 1 November 2017 c
In the second case, the ceilometer locates the liquid layer around 1 km altitude or more (Figure 281
3.c). No droplets are sampled. The station is so below the mixed layer, within the ice 282
precipitation. This layer has a variable extinction coefficient depending on the crystal density 283
but the laser beam is not completely attenuated. The relative humidity shows high values around 284
90 % but remains lower than the MPC cases. 285
Moreover, the temperature varied between -20 to -1 °C, so it remains always below the 286
solidification point, liquid particles were always supercooled droplets. The Blowing Snow 287
episodes will be discussed in annex. 288
289
In the following, the LMPL and precipitation layer cases will be microphysically and optically 290
characterized. These characterizations will be useful to determine futures measurements that 291
are not completed with visual observations (e.g., remote sensing measurements). Moreover, 292
combined with other measurement campaign in the Arctic, we hope to increase knowledge 293
about growth processes in low level mixed phase arctic clouds. 294
295 296
3.2 Characterization of the LMPL cases
297 298
Arctic MPC can be characterized by a succession of layers with liquid or ice dominance. The 299
phase heterogeneity is both horizontal and vertical. Because of the fixed position of the 300
measuring station, we could not control the location of the measurements within the cloud 301
system. However, a characterization of the mean parameters is possible. 302
303
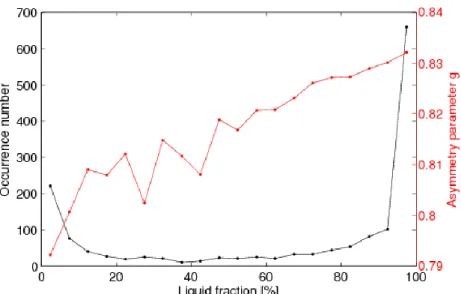
The determination of the thermodynamic phase of a cloud can be based on microphysical and 304
optical criteria. Figure 4 presents the occurrence number of the MPC liquid fraction Fliq and the
305
asymmetry parameter g. Fliq is computed as :
306 307 𝐹𝑙𝑖𝑞= 𝐿𝑊𝐶𝐹𝑆𝑆𝑃 (𝐿𝑊𝐶𝐹𝑆𝑆𝑃+𝐼𝑊𝐶𝐶𝑃𝐼) (1) 308 309
The results show a higher observation frequency for extreme Fliq values (close to 0 or 100 %).
310
The minimum frequency is between 20 and 70 %. This means that the low level mixed phase 311
cloud layers are preferentially with liquid or ice dominance for the spatial resolution of our 312
measurements. This confirms the conclusions from the scientific literature (e.g., Gayet and al., 313
2009; Korolev and Isaac, 2006). 314
Moreover, g shows a more or less linear relation with Fliq. This highlights the relation between
315
the optical properties and the microphysical properties. Therefore, the knowledge of the MPC 316
microphysical properties is a key parameter to reliably assess the radiative transfer in the Arctic. 317
The g variability is significantly larger for Fliq below 50 %. This tends to show a more complex
318
optical behavior for ice dominating layers. 319
321
Figure 4: Occurrence number and mean values of g in relation to the liquid fraction Fliq for the
322
four LMPL cases. Fliq is derived from the CPI and FSSP measurements (see Eq. 1) with 1
323
minute resolution corresponding to a spatial resolution of 800 meters. 324
325 326
Figure 5 shows the average PSD, from 3 µm to 2.3 mm, obtained with the FSSP and the CPI 327
for the four LMPL cases. The mean Fliq is also indicated. The four PSD show similar trends,
328
i.e. two modes centered at 10 µm for droplets and around 250 µm for ice crystals. 329
According to Costa et al. (2014), these PSD correspond to the coexistence regime characterized 330
by RHw (relative humidity according to liquid water) and RHi (relative humidity according to
331
ice) > 100 % and stable coexistence of crystals and supercooled liquid droplets with the droplet 332
PSD 106 higher than the crystal PSD. This is opposite to the Bergeron regime where RH w < 100
333
% and RHi > 100 %, so the crystals grow in expense of the droplets (Costa et al., 2014). This
334
reveals that the Wegener-Bergeron-Findeisen process doesn’t alone explain the formation and 335
growth of ice crystals. 336
However, the March 11th and 29th PSDs show differences with the other cases with a high
337
concentration for the smallest CPI classes. This is due to big droplets sampled by the CPI. The 338
FSSP doesn’t show such consequent differences in droplet PSD or diameter. We also point out 339
that the absolute values should not be taken into account. Indeed, in addition to instrumental 340
issues (see Guyot el al., 2015), the results and the differences between the cases are largely 341
dependent on the station residence time within the liquid or mixed layer which cannot be 342
controlled. Similar PSDs were observed at the Mount-Zeppelin station by Uchiyama et al. 343
(2013) in 2011. This publication concludes that the liquid/ice distribution is a function of the 344
cloud evolution stage; we highlight here the importance of the station position inside the cloud 345
system for our data analysis. 346
347 348
Atmos. Chem. Phys. Discuss., https://doi.org/10.5194/acp-2017-672 Manuscript under review for journal Atmos. Chem. Phys.
Discussion started: 1 November 2017 c
349
Figure 5: Cloud PSD in cm-3 µm-1 measured by the FSSP [3-50 µm] and the CPI [15-2300
350
µm] and average for the four LMPL experiments. The mean values of Fliq are indicated in
351
legend. 352
353 354
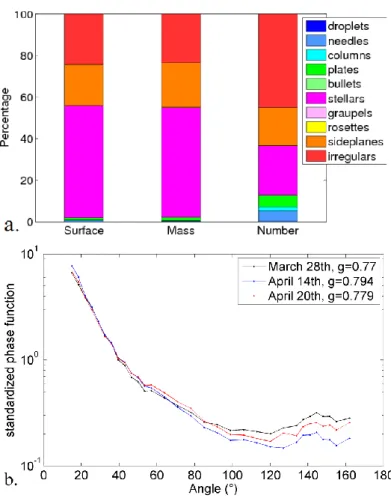
The shape classification performed by the CPI is presented Figure 6.a. The high droplet 355
concentrations of the smallest CPI classes observed on March 11th and 29th (see Figure 5) are 356
responsible of the strong number dominance of the droplets with a value of around 85 %. 357
However, liquid water represents a very small proportion in mass and surface fractions. For 358
these two quantities, side planes and irregular shapes dominate. 359
The assessment of the crystal growth mode is confronted to the fact that the measurement 360
station can change its position in the cloud. An evolution in the CPI PSD is so not necessary 361
due to particles growth. However, the crystal shape, accurately measured by the CPI, is a good 362
indicator for the growth mode and the high percentage of regular shape would indicate a growth 363
dominated by vapor deposition. Aircraft measurements performed in Svalbard in 2007 show 364
similar results, with in particular strong presence of irregulars and side planes for altitudes and 365
temperatures around 500 m and -12 °C, respectively (Gayet et al., 2009) 366
368
369
Figure 6: a) CPI shape classification in surface, mass and number for the LMPL cases. The 370
color represents the occurrence percentage of the shapes as indicated by caption, and b) 371
average standardized phase functions measured by the PN for the four LMPL cases. Caption 372
indicates the asymmetry parameter. 373
374
Measurements of the cloud particle scattering properties performed by the PN allow to study 375
the optical signature of the main microphysical properties observed on the MPC. Figure 6.b 376
displays the average phase functions and asymmetry parameters (g) for the four LMPL cases. 377
Differences between the experiments are negligible in forward and backward scattering but 378
within the lateral scattering domain [60°; 130°]. The scattering increases when g decreases. The 379
1 minute average g values during the whole measurement campaign are included between 0.74 380
and 0.85, which is consistent with results obtained by Garrett et al. (2001). 381
Combined with Figure 5, these results show that g and the lateral scattering are relied to 382
microphysical properties. Indeed, lateral diffusion increases when Fliq decreases. Therefore,
383
March 11th experiment presents the lower F
liq (38 %), the higher lateral scattering and the lower
384
average value of g (0.819). The contrary is shown in the April 27th case (F
liq = 94%, g = 0.828).
385
This is consistent with previous studies (Gayet et al., 2009; Jourdan et al., 2010) and also proves 386
the qualitative coherence between the FSSP and the PN. 387
The analysis of the optical-microphysics coupling is limited by the sampling speed and rate and 388
the PN measurement accuracy. Indeed, a mean component analysis failed to establish a 389
relationship between the phase function and the crystal morphology, as highlighted by Jourdan 390
et al. (2010). 391
Atmos. Chem. Phys. Discuss., https://doi.org/10.5194/acp-2017-672 Manuscript under review for journal Atmos. Chem. Phys.
Discussion started: 1 November 2017 c
3.3 Characterization of the precipitation cases
392 393
Figure 7 displays the average CPI PSD for the three cases of precipitation. The FSSP is blind 394
for those particles sizes. The April 14th and 20th experiments show a PSD with very low 395
concentrations, close to the detection limit, centered around 350 µm and accompanied by 396
relatively low temperature < -10°C. The March 28th case differs from the two other experiments
397
with higher concentrations and a PSD centered around 200 µm, similar to the LMPL cases. 398
Besides, the temperature is higher with an average value of -5 °C. This could reveal an influence 399
of the mixed layer and/or temperature effect. 400
However, the ceilometer located the cloud base at an altitude of approximately 1000 m for the 401
three days, which would indicate that the station position doesn’t explain the differences. The 402
temperature differences could lead to different growth processes and so different sizes. 403
This information can be provided by the CPI image classification presented Figure 8.a showing 404
a pronounced presence of stellars. Even if the stellar crystals aren’t a majority in number, they 405
stand for more than half of total surface and mass. However, the number shape distribution was 406
not identical for the three days. Indeed, the 14th and 20th April experiments are dominated by
407
stellar whereas the March 28th case shows a much more important contribution of plaque,
408
irregular and needle. As the concentration is 5 times higher for the March 28th case, its
409
contribution in the total number distribution is more important. 410
Therefore, even if the temperature measured at the station is potentially different than the crystal 411
formation and growth temperatures and the oversaturation according to the ice was not 412
measured, we have seen that the CPI measurements show that temperatures below -10°C are 413
favorable to the formation of big size crystals such as stellar, whereas, for warmer temperatures, 414
plaque, irregular and needle crystals with smaller sizes dominate. This agrees with the crystal 415
classification studied by Bailey and Halley (2009) and explains the differences in the daily PSD. 416
417 418
419
Figure 7: Same as Figure 5 for the precipitation cases. 420
422
423
Figure 8: Same as Figure 6 (a and b) for the precipitation cases. 424
425 426
Figure 8.b presents the average phase functions of the precipitation cases. The lateral scattering 427
is more important than for the measurements of the mixed and liquid layers. The asymmetry 428
parameter is lower around 0.79 which is typical for ice particles. Notable differences are 429
observed for scattering angles as low as 40°. These differences are probably due to the crystal 430
morphology variability. Unfortunately, such relationships were not observed with the 431
CLIMSLIP data. Indeed, a principal component analysis didn’t allow discriminating the phase 432
function according to the crystal shape. This can be explained by the low sampling rate during 433
the precipitation events involving a very low crystal statistics. 434
435 436
To conclude, the results were limited by the low particle sampling rate and the uncontrolled 437
position of the station inside the cloud system. However, differences between LMPL and 438
precipitation layer have been explicated and allow a quick recognition without visual 439
observations in future studies. These results will be compared to other measurement campaign 440
for a better understanding of the microphysical processes and feedbacks that take place in low 441
level mixed phase arctic clouds. 442
443 444
Atmos. Chem. Phys. Discuss., https://doi.org/10.5194/acp-2017-672 Manuscript under review for journal Atmos. Chem. Phys.
Discussion started: 1 November 2017 c
4 Aerosol-cloud interaction in the Arctic
445 446
The objective of this part is to quantify the effects of the aerosol properties on the cloud 447
properties observed during the CLIMSLIP campaign. To do this, we will in a first step compare 448
the two experiments of March 11th and 29th that will be the “clean” and “polluted” cases,
449
respectively. In a second step, several aerosol cloud-interaction processes will be evaluated and 450
in situ measurements will be used to assess quantities that are required in parametrization of the 451
arctic aerosol-cloud interaction. 452
453
4.1 Section on tools: the FLEXPART-WRF model and definitions
454 455
This analysis will be supported by results from the lagrangian particle dispersion model 456
FLEXPART-WRF (version 3.1, Brioude et al., 2013) adapted from the FLEXPART model 457
(version 6.2, Stohl et al., 2005). FLEXPART-WRF simulates long distance transport and, in a 458
mesoscale, the moist and dry scavenging and the diffusion of atmospheric tracers and air masses 459
(see Stohl et al., 1998, Stohl and Thomson, 1999, or Stohl et al., 2005, for more details). The 460
FLEXPART-WRF model was driven by WRF (Skamarock et al., 2008) meteorological 461
forecasts to provide air masses back-trajectories and several tracers’ origins. 462
463
For each single run, 20000 pseudo-particles were released from a small volume surrounding 464
the analyzed position. Then, they were then tracked backward in time. The model output a 465
tridimensional distribution of the Potential Emission Sensitivity (PES) on a 1° longitude x 1° 466
latitude resolution grid. The PES is expressed in s/kg, which corresponds to the residence time 467
of air particles within a given cell. In order to investigate the potential sources of the pollution 468
transported to the Arctic and since the pollutants generally remain below the inversion layer, 469
the model output is integrated over the first kilometer atmospheric column and becomes a 470
Footprint PES (FPES). Combined with the ECLIPSE (Evaluating the Climate and Air Quality 471
Impacts of Short-Lived Pollutants, see Klimont et al., 2016) atmospheric pollutants emission 472
inventory, FLEXPART-WRF provides a valuable insight on the potential geographic 473
contribution of anthropogenic sources for pollution tracers such as CO, SO2 and BC. The
474
combination between the FPES and the emissions is called the Potential Source Contribution 475
(PSC) expressed in kg of tracer per air kg. In this study, we will focus on the CO tracer which 476
gives an assessment on the origin of the anthropogenic pollution transported to Svalbard. 477
478
The aerosol cloud interaction study will also be supported by two other parameters: the 479
activation fraction Fa and the activation diameter Da. Fa can be defined as the percentage of
480
aerosols becoming CCN (Abdul-Razzak et al., 1998) and is computed by the ratio of the FSSP 481
and CPC concentration. The CPC was chosen because it provides the largest aerosol size range: 482 483 𝐹𝑎 = 𝑁𝑑𝑟𝑜𝑝 𝑁𝑎𝑒𝑟𝑜𝑠𝑜𝑙= 𝑁𝐹𝑆𝑆𝑃 𝑁𝐶𝑃𝐶 (2) 484 485 486
We define Da as the diameter beyond which all the aerosols are activated, assuming the aerosol
487
chemistry effect is negligible (Abdul-Razzak et al., 1998). During CLIMSLIP, Da is calculated
488
as the DMPS diameter for which the DMPS total concentration is equal to the FSSP 489
concentration. Even if the aerosol size range is smaller for the DMPS than the CPC, the DMPS 490
∑𝐷𝐷𝑎𝑚𝑎𝑥𝑛𝐷𝑀𝑃𝑆(𝐷) = 𝑁𝐹𝑆𝑆𝑃 (3) 493
494
4.1 The “Clean” case of March 11th
495 496
The March 11th case, just like March 29th, presents a stable atmosphere with a low level mixed
497
phase cloud. The liquid layer was sampled but, unfortunately, the ceilometer beam was almost 498
entirely attenuated within the first 500 meters, avoiding to assess cloud top and base altitude. 499
The sounding balloon show the inversion layer around 925 mb (700 m) for both days. 500
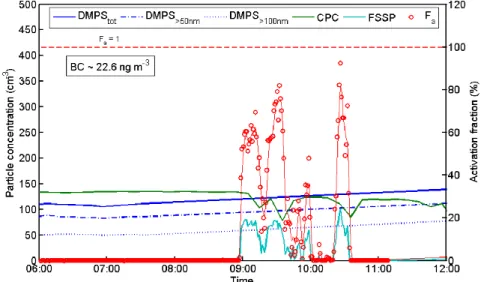
Figure 9 shows the time evolution of the DMPS, CPC and FSSP concentration, the activation 501
fraction and the average BC concentration. The DMPS ceased to work from 7:30 until the 502
following day, but, as the CPC and aethalometer parameters show almost constant values until 503
12:00, the DMPS concentration is assumed to do the same. The DMPS concentration is plotted 504
for different particles sizes (total, > 50 nm and > 100 nm). The DMPS PSD shows a bimodal 505
distribution with a pronounced Aitken mode which is as important as the accumulation mode 506
(not shown). This is obvious in Figure 9 where the accumulation mode concentration, i.e. 507
particles sizes larger than 100 nm, equals half the total concentration. 508
The CPC displays an aerosol concentration (> 3 nm) relatively stable and weak between 100 509
and 130 cm-3. The average BC concentration reaches 22.6 ng m-3 during the liquid episode. The
510
FSSP shows a droplet concentration up to 100 cm-3, which leads to F
a values between 60 and
511
80 % for the sections clearly in the densest zone of the MPC liquid layer. 512
The FSSP droplet effective diameter is around 12 µm and the DMPS effective diameter around 513
250 µm. Da shows very high variations with a mean value around 150 nm (not shown).
514 515
516
Figure 9: Time series of aerosol concentrations measured by the DMPS and the CPC, droplet 517
FSSP concentration and the activation fraction, for the March 11th. The DMPS concentration
518
was divided into three groups: the total concentration [25 - 809 nm], particles larger than 50 519
nm [50 – 809 nm] and larger than 100 nm [100 – 809 nm], the latter corresponding to the
520
accumulation mode concentration. The activation fraction has been plotted with a sliding average
521
of 5 minutes; the average aethalomètre BC concentration is indicated.
522
Atmos. Chem. Phys. Discuss., https://doi.org/10.5194/acp-2017-672 Manuscript under review for journal Atmos. Chem. Phys.
Discussion started: 1 November 2017 c
523
Figure 10: a) FLEXPART-WRF 12 days FPES from the simulation initiated from Mount-524
Zeppelin on March 11th between 9 AM and 12 AM UTC. b) PSC computed from the FPES of
525
Figure a) for the CO, expressed in kg CO per kg air. 526
527 528
Figures 10 a and b present respectively the FPES over 12 days and the PSC of CO for the air 529
mass arriving at the station during the liquid episode of the March 11th described in Figure 9.
530
The FPES shows that the aerosol sources are mainly located in the north of Scandinavia and so 531
that the long-range transport of anthropogenic aerosols is relatively limited. Indeed, over the 532
FLEXPART-WRF time computation of 12 days, the air masses come principally from Svalbard 533
and Scandinavia surrounding, showing very slow move. The CO PSC map presents an 534
anthropogenic origin dominated by North Europa: Scandinavia, north of Germany, Netherland, 535
Belgium and north of France. 536
The closer air masses origin makes this case the “clean” case. The important contribution of 537
local aerosol sources, mainly composed of gaseous precursors for the arctic region during this 538
period of the year (Quinn et al., 2007), explains the relative small aerosol mean diameter and 539
the high Aitken mode concentration observed by the DMPS (see Figure 9). 540
541 542
4.2 The “Polluted” case of March 29th
543 544
Figure 11 displays the same time series as Figure 9 for the liquid episode of March 29th. The
545
CPC and DMPS total concentration are decreasing going respectively from 220 cm-3 to 120 cm -546
3 and from 175 cm-3 to 80 cm-3, due to the scavenging by ice precipitation. The FSSP droplet
547
concentrating reaches 150 cm-3 and the average BC concentration 65.8 ng m-3. Comparing to
548
the March 11th case, these four concentration are all higher during the March 29th. The activation
549
fraction is also higher on March 29th with values between 80 and 100 % in the liquid layer and 550
Fa increases as the aerosol concentration decreases.
551
Just like March 11th, D
a shows very variable values around 150 nm (not shown). Its high
552
variability makes this parameter unsuitable when comparing the two cases. However, Da
553
decreases from around 150 nm to 50 nm and the FSSP effective diameter increases from 8 to 554
Moreover, the DMPS PSD shows that 90 % of the aerosol concentration is included in the 557
accumulation mode, with an effective diameter almost constant at 300 nm. Therefore, the 558
aerosol diameter is larger and the droplet diameter is smaller for the March 29th case compared
559
to the March 11th case.
560 561
562
Figure 11: Same as Figure 9 for the March 29th case
563 564
The differences observed between the two days can be explained by the air masses origin. 565
Figure 12 shows the same FLEXPART-WRF FPES and CO PSC for the air mass arriving at 566
the station during the liquid episode of the March 29th. Backtrajectories distinguish clearly two
567
origin regions. The first one is Western Europa. The second air mass shows higher values of 568
time residence and comes from northeast Asia: northeast China and extreme east Russia. The 569
particularity of March 29th consists thus in this air mass coming from Asia which is the region
570
generally accepted to emit the highest aerosol concentration compared to the others regions of 571
the world (Boucher et al., 2013). 572
Therefore, compared to the “clean” case of March 11th, March 29th shows long range transport
573
of anthropogenically influenced air masses, leading to higher aerosol concentration in the Arctic 574
with especially a BC mass concentration 3 times higher. Thus, March 29th constitute the 575
“polluted” case. According to Quennehen et al. (2012), during the route, the Aitken mode 576
concentration quickly decreases by coagulation, for the benefit of the accumulation mode, 577
increasing the average effective diameter. This explains the accumulation mode dominance 578
observed in Figure 11 and the increase of the average DMPS effective diameter, and confirms 579
the strong influence of the lower latitudes emissions during the “polluted” case. On the contrary, 580
the “clean” case shows local sources composed of fresh particles, for at least half the 581
concentration. 582
This long range anthropogenic pollution has also strong influence on cloud properties. Indeed, 583
CCN abilities being mainly due to the aerosol size in the Arctic (Mc Farquhar et al., 2011), 584
accumulation mode dominance leads to higher aerosol effective diameter and higher Fa values.
585
Combined with higher aerosol concentration, the droplet concentration increases whereas the 586
droplet size decreases meaning, theoretically, that the cloud optical thickness increases. 587
588
Atmos. Chem. Phys. Discuss., https://doi.org/10.5194/acp-2017-672 Manuscript under review for journal Atmos. Chem. Phys.
Discussion started: 1 November 2017 c
589
Figure 12: a) and b) Same as Figure 10 for the air masses arriving in the Mount-Zeppelin 590
station on March 29th between 10 AM and 1 PM UTC.
591 592 593
This qualitative study has to be completed with quantitative parameters that can be found in the 594
scientific literature. Therefore, the next section will focus on the quantitative variations of 595
droplet concentration and size according to aerosol properties. Moreover, glaciation and riming 596
indirect effect will be assessed. 597
4.3 Quantification of the impacts of the aerosol properties on the cloud
598
microphysical properties
599 600
The sensitivity of cloud diameter and concentration according to aerosol haze will be assessed 601
from two parameters, called the Indirect Effect parameter (IE) and the Nucleation Efficiency 602
(NE) and defined as follows (Feingold et al., 2001, 2003, Garrett et al., 2004): 603 604 605 606 𝐼𝐸 = −𝜕 ln (𝑟𝑒) 𝜕 ln (𝜎) (4) 607 608 𝑁𝐸 =𝜕 ln (𝑁)𝜕 ln (𝜎) (5) 609
where re is the droplet effective radius, N the droplet concentration and σ the aerosol scattering
610
coefficient. 611
We made two assumptions to use these parameters. First, IE and NE are assumed to evaluate 612
the variations of the droplet concentration and size according to the CCN concentration. To 613
measure this one, we use the scattering coefficient which is assumed to be proportional to the 614
CCN concentration. The accumulation mode particles are the most inclined to serve as CCN 615
because of their size and possess the highest scattering cross section compared to the other 616
modes (Garrett et al., 2004). Second, re and N are also dependent on the LWP, so IE and NE
617
have to be computed for similar LWP clouds (Feingold et al., 2001). During CLIMSLIP, the 618
LWP was not measured and we assumed that the LWP is effectively constant. This is reasonable
a) b)
622
Figure 13: Comparison of the aerosol scattering coefficient σ at λ = 550 nm measured by the 623
nephelometer, with a) the droplet concentration, and b), the effective diameter measured by 624
the FSSP, for the four LMPL cases. Values of LWC below 5 10-3 g m-3 were not taken into
625
account. This comparison has been performed with a nephelometer time resolution of 5 626
minutes. 627
628
Figure 13 presents the comparisons between the droplet concentration and diameter with the 629
aerosol scattering coefficient. The results are consistent with the Twomey effect (Twomey, 630
1974, 1977) and the Albrecht effect (Albrecht, 1989). The correlation coefficients R² are equal 631
to 0.43 and 0.39 for concentration and size, respectively. This high dispersion can be explained 632
by the fact that the droplet concentration and size depend also of LWP, temperature and the 633
position of the measurement volume within the cloud system. 634
At λ = 550 nm, IE = 0.2 and NE = 0.43 were obtained. This is to compare with the study of 635
Garrett et al. (2004) performed at Barrow, Alaska, where IE and NE were found to be between 636
0.13 and 0.19 and between 0.3 and 0.5 respectively, at λ = 550 nm. Very similar values are so 637
found in two different regions of the Arctic, which confirms these parameterizations of the first 638
and second aerosol indirect effect for the arctic region. 639
640
a) b)
641
Figure 14: 5 minutes comparison of the aerosol scattering coefficient σ at λ = 550 nm with a) 642
the concentration and b) the IWC of crystals sampled by the CPI, for the four LMPL cases. A 643
threshold of 50 µm was applied to the particles diameter to discard the droplets sampled by 644
the CPI. 645
646 647
Atmos. Chem. Phys. Discuss., https://doi.org/10.5194/acp-2017-672 Manuscript under review for journal Atmos. Chem. Phys.
Discussion started: 1 November 2017 c
The glaciation (Lohmann, 2002a, 2002b) and the riming indirect effect (Borys et al., 2003) were 648
evaluated during the CLIMSLIP campaign thanks to the CPI and the nephelometer 649
measurements. The comparison between the crystal concentration and IWC with σ (or nuclei 650
concentration) is displayed in Figure 14. The results show very weak correlation, for the 651
concentration and the IWC. This means that neither the glaciation nor the riming indirect effect 652
were revealed during CLIMSLIP. 653
This absence can be due to the high uncertainty in the CPI measurements and/or to low sampling 654
rate that leads to a very low statistical representation. To compare, the study of Jackson et al. 655
(2012), during the ISDAC and MPACE campaign, found a correlation corresponding to the 656
glaciation effect above the cloud liquid phase but no evidence of the riming effect. 657 658 659 660 661 662 663 664 665 666 667 668 669 670 671 672 673 674 675 676 677 678 679 680 681 682 683 684 685 686 687 688 689 690 691 692 693 694 695
5 Summary and conclusion
696 697
Within the framework of the arctic amplification, the complex interactions between the cloud 698
and aerosol properties remain a challenge to enhance the arctic cloud modeling and to get a 699
better quantification of the consequences of the anthropogenic pollution on the arctic climate. 700
The ANR project CLIMSLIP (CLimate IMpacts of Short-LIved Pollutants in the polar region) 701
provides new data from a ground based aerosol and cloud instrumentation located at the Mount 702
Zeppelin station, Ny-Alesund, Svalbard, during spring 2012. This instrumentation contains a 703
FSSP, a CPI and a Polar Nephelometer to sample clouds and a CPC, a DMPS and a 704
nephelometer for aerosols. 705
During the campaign, four cases of LMPL (Liquid and Mixed Phase Layer), three cases of snow 706
precipitation layer and two cases of BS (Blowing Snow) were sampled. The precipitation layer 707
cases correspond to the lower layer of a MPC. The precipitation events are composed of large 708
crystals (Mean Diameter Dm ~ 350 µm) with an important presence of stellar. The LMPL events 709
are characterized by a bimodal PSD with a large number of droplets. The liquid mode was 710
located around 10 µm and the crystal mode around 250 µm. The phase function measurements 711
showed an increase of the lateral scattering as Fliq decreases.
712
According to Guyot et al. (2015), only isoaxial measurements with a wind speed higher than 5 713
m/s are selected. This deleted a non-negligible amount of data and so limited the analysis, 714
especially for the precipitation cases where the particle statistics were the weaker. Moreover, 715
the position of the station within the cloud system was approximate despite the ceilometer 716
measurements. 717
A study by comparison of the effects of the anthropological aerosols transported to the Arctic 718
was performed. According to the FLEXPART/WRF simulations, the “polluted” case of March 719
29th showed air masses from Europe and East Asia whereas the aerosol sources during the
720
“clean” case of March 11th were closer (mainly from Scandinavia) and the anthropogenic
721
contribution doesn’t exceed northern Europe. 722
Thus, the polluted case presents higher Black Carbon, aerosol and droplets concentrations, a 723
more important accumulation mode, smaller droplet sizes and higher activation fraction Fa. The
724
March 29th activation diameter D
a decreased when the droplet diameter increased and Fa
725
increased, proving that smaller aerosol particles are activated and droplets grow up when the 726
aerosol number decreases. These results confirm the first and second aerosol indirect effects 727
with the coefficients IE and NE respectively around 0.2 and 0.43. These values are very close 728
to those found by Garrett et al. (2004), which performed measurement at Barrow in Alaska, and 729
are so good candidates to be used to parameterize arctic aerosol-cloud interaction in climate 730
models. Furthermore, the crystal concentration and IWC do not show any correlation with the 731
aerosol properties, which indicates that the glaciation and riming indirect effects are not 732
highlighted during the CLIMSLIP-NyA campaign. 733
734 735
Acknoledgements. This work was supported by the ANR project CLIMSLIP and the conseil
736
general de l’Allier. We also thank the AVI for providing the ceilometer data and the ITM and 737
NILU for monitoring the Mount Zeppelin station. We are grateful to scientists, engineers and 738
technicians that make this study possible. Boris Quennehen acknowledges the IPSL 739
CICLAD/CLIMSERV mesocenter for providing computing resources. 740 741 742 743 744 745
Atmos. Chem. Phys. Discuss., https://doi.org/10.5194/acp-2017-672 Manuscript under review for journal Atmos. Chem. Phys.
Discussion started: 1 November 2017 c
Annex:
Characterization of the Blowing Snow (BS) cases746 747
During ground based measurements, some snow was collected that was suspended in the 748
atmosphere due to wind. This is the so-called Blowing Snow (BS). This annex aims at the 749
microphysics characterization in order to recognize this kind of episode and the optical 750
properties measurements, especially the phase function, that can be used as a reference to 751
develop new parameterizations of the snow simple scattering properties (Räisänen et al., 2015). 752
753
754
Figure 15: Same as Figure 5 for the BS cases. 755
756
When the BS occurs, the sky is clear as observed by the ceilometer. However, crystal particles 757
are sampled. They are snowflakes initially resting on the ground but getting suspended in the 758
air by the wind. 759
Figure 15 shows the average PSDs measured by the CPI for the two BS cases. The shape and 760
the amplitude are similar for the two PSDs, with a mean diameter between 150 and 200 µm. for 761
a maximum class concentration around 10-2 L-1 µm-1. The CPI shape classification, plotted in
762
Figure 16.a, shows a large prevalence of irregular crystals, as well in number, surface or mass 763
(i.e. volume), with a percentage around 90% of the crystals. These two characteristics constitute 764
the microphysics signature of the BS. The difference between the BS and MPC (see Figure 5 765
and 6) signature makes it possible to identify BS events even if the station is located inside a 766
cloud. 767
769
770
Figure 16: Same as Figure 6 (a and b) for the BS cases. 771
772
Even if the resuspension of crystals in the air can modify the shape by impacts, we consider 773
that the sampled crystals are similar to the deposited precipitations and aged for several days. 774
Thus, the BS events during CLIMSLIP were excellent occasions to measure the arctic snow 775
properties. 776
Figure 16.b displays the average phase functions of the BS cases. The shape of the curves are 777
very similar to the precipitation cases, typical of ice particles, but with lower g values. These 778
measurements constitute a unique database to develop parameterizations of the arctic snow 779
optical properties. Indeed, in most of the climate and weather forecast models, the computation 780
of the snow albedo uses the approximation of spherical snow grain (Wang and Zeng, 2010). 781
Thus, the study of Räisänen et al. (2015) proposes new modeling parameterizations of the snow 782
single scattering properties (SSP) based on the CLIMSLIP-NyA in situ measurement of the 783
phase function. The obtained snow SSP takes into account the complex BS particles shape 784 (Räisänen et al., 2015). 785 786 787 788 789 790
Atmos. Chem. Phys. Discuss., https://doi.org/10.5194/acp-2017-672 Manuscript under review for journal Atmos. Chem. Phys.
Discussion started: 1 November 2017 c
References
791 792
Abdul-Razzak, H., Ghan, S. and Rivera-Carpio, C.: A parametrization of aerosol activation; 1. 793
Single aerosol type, J. Geophys. Res., 103, 6123-6131, 1998. 794
795
Albrecht, B.A.: Aerosols, cloud microphysics, and fractional cloudiness, Science, 245, 1227-796
1230, 1989. 797
798
Bailey, M. P., and Hallett, J.: A Comprehensive Habit Diagram for Atmospheric Ice Crystals: 799
Confirmation from the Laboratory, AIRS II, and Other Field Studies, J. Atmos. Sci., 66, 2888– 800
2899, doi:10.1175/2009JAS2883.1, 2009. 801
802
Baker, B. and Lawson, R.P.: Improvement in Determination of Ice Water Content from Two-803
Dimensional Particle Imagery. Part I: Image-to-Mass Relationships. J. Appl. Meteor. Climatol., 804
45, 1282–1290, 2006. 805
806
Borys, R.D., Lowenthal, D.H., Cohn S.A. and Brown, W.O.J.: Mountaintop and radar 807
measurements of anthropogenic aerosol effects on snow growth and snowfall rate, Geophys. 808
Res. Lett., 30, 1538, doi:10.1029/2002GL016855, 2003. 809
810
Boucher, O., Randall, D., Artaxo, P., Bretherton, C., Feingold, G., Forster, P., Kerminen, V.-811
M., Kondo, Y., Liao, H., Lohmann, U., Rasch, P., Satheesh, S.K., Sherwood, S., Stevens B. and 812
Zhang, X.Y.: Clouds and Aerosols. In: Climate Change 2013: The Physical Science Basis. 813
Contribution of Working Group I to the Fifth Assessment Report of the Intergovernmental 814
Panel on Climate Change, Cambridge University Press, Cambridge, United Kingdom and New 815
York, NY, USA, 2013. 816
817
Brioude, J., Arnold, D., Stohl, A., Cassiani, M., Morton, D., Seibert, P., Angevine, W., Evan, 818
S., Dingwell, A., Fast, J. D., Easter, R. C., Pisso, I., Burkhart, J., and Wotawa, G.: The 819
Lagrangian particle dispersion model FLEXPART-WRF version 3.1, Geosci. Model Dev., 6, 820
1889–1904, doi:10.5194/gmd-6-1889-2013, 2013. 821
822
Costa, A., Krämer, M., Meyer, J., Afchine, A., Luebke, A., Dorsey, J.R., Gallagher, M.W., 823
Ehrlich, A., Wendisch, M., Baumgardner, D., Möhler, O., Saathoff, H. and Schnaiter, M.: A 824
microphysical classification of mixed-phase clouds in the liquid-ice coexistence and Wegener-825
Bergeron-Findeisen regime, 14th Conference on Cloud Physics, 07 – 11 July 2014, Boston, 826 USA, https://ams.confex.com/ams/14CLOUD14ATRAD/webprogram/Han-827 dout/Paper250419/AMS_Poster_68_Mixed_Phase_Clouds_Costa.pdf, 2014. 828 829
Curry, J.A., Randall, D., Rossow, W.B., and Schramm, J.L.: Overview of Arctic Cloud and 830
Radiation Characteristics, J. Climate, 9, 1731–1764, doi: 10.1175/1520-831
0442(1996)009<1731:OOACAR>2.0.CO;2, 1996. 832
833
Dufresne, J.L. and Bony, S. : An Assessment of the Primary Sources of Spread of Global 834
Warming Estimates from Coupled Atmosphere–Ocean Models, J. of Clim., 21, 5135 – 5144, 835
2008. 836
837
Dye, J.E., Baumgardner D.: Evaluation of the Forward Scattering Spectrometer Probe. Part I: 838
Eleftheriadis, K., Vratolis, S. and Nyeki, S.: Aerosol black carbon in the European Arctic: 841
Measurements at Zeppelin station, Ny-Alesund, Svalbard from 1998–2007, Geophys. Res. 842
Lett., 36, L02809, doi:10.1029/2008GL035741, 2009. 843
844
Engvall, A.C., Krejci, R., Ström, J., Treffeisen, R., Scheele, R., Hermansen, O. and Paatero, J.: 845
Changes in aerosol properties during spring-summer period in the Arctic troposphere, Atmos. 846
Chem. Phys., 8, 445-462, 2008. 847
848
Febvre G., Gayet, J.F., Shcherbakov., V., Gourbeyre, C., Jourdan, O.: Some effects of ice 849
crystals on the FSSP measurements in mixed phase clouds, Atmos. Chem. Phys., 12, 8963– 850
8977, doi: 10.5194/acp-12-8963-2012, 2012. 851
852
Feingold, G., Remer, L. A., Ramaprasad, J., and Kaufman, Y. J.: Analysis of smoke impact on 853
clouds in Brazilian biomass burning regions: An extension of Twomey’s approach, J. Geophys. 854
Res., 106, 22, 907– 22, 922, 2001. 855
856
Feingold, G., Eberhard, W. L., Veron, D. E. and Previdi, M.: First measurements of the 857
Twomey indirect effect using ground-based remote sensors, Geophys. Res. Lett., 30, 1287, doi: 858
10.1029/2002GL016633, 2003. 859
860
Garrett, T. J., Hobbs, P. V., and Gerber, H.: Shortwave, single scattering properties of Arctic 861
ice clouds, J. Geophys. Res., 106, 15 155–15 172, 2001. 862
863
Garrett, T. J., Zhao, C. Dong, X., Mace, G., Hobbs, P. V.: Effects of Varying Aerosol Regimes 864
on Low-Level Arctic Stratus. Geophys. Res. Lett., 31, 17, 17, doi: 10.1029/2004GL019928, 865
2004. 866
867
Garrett, T. and Zhao, C.: Increased Arctic cloud longwave emissivity associated with pollution 868
from mid-latitudes, Nature, 440, 787–789, doi:10.1038/nature04636, 2006. 869
870
Gayet, J.F., Crépel, O., Fournol, J.F., and Oshchepkov, A.: A new airborne polar nephelometer 871
for the measurements of optical cloud properties. Part I: Theoretical design, Ann. Geophysicae, 872
15, 451-459, 1997. 873
874
Gayet, J.F., Auriol, F., Minikin, A., Ström, J., Seifert, M., Krejci, R., Petzol, A., Febvre, G., 875
and Schuman, U.: Quantitative measurement of the microphysical and optical properties of 876
cirrus clouds with four different in situ probes: Evidence of small crystals, Geo. Resea. Let., 877
29, 2230-2233, 2002. 878
879
Gayet, J.F., Mioche, G., Dörnbrack, A., Ehrlich, A., Lampert, A., Wendisch M.: Microphysical 880
and optical properties of Arctic mixed-phase clouds. The 9 April 2007 case study, Atmos. 881
Chem. Phys., 9, 6581–6595, 2009. 882
883
Guyot, G., Gourbeyre, C., Febvre, G., Shcherbakov, V., Brunet, F., Dupont, J.C., Sellegri, K. 884
and Jourdan, O.: Quantitative evaluation of seven optical sensors for cloud microphysical 885
measurements at the Puy-de-Dôme Observatory, France, Atmos. Meas. Tech., 8, 4347–4367, 886
doi:10.5194/amt-8-4347-2015 , 2015. 887
888
Jackson, R.C., McFarquhar, G.M., Korolev, A.V., Earle, M.E., Liu, P.S.K., Lawson, R.P., 889
Brooks, S., Wolde, M., Laskin, A. and Freer, M. : The dependence of ice microphysics on 890
Atmos. Chem. Phys. Discuss., https://doi.org/10.5194/acp-2017-672 Manuscript under review for journal Atmos. Chem. Phys.
Discussion started: 1 November 2017 c


![Figure 5: Cloud PSD in cm -3 µm -1 measured by the FSSP [3-50 µm] and the CPI [15-2300 350](https://thumb-eu.123doks.com/thumbv2/123doknet/14547025.536420/11.892.220.673.238.727/figure-cloud-psd-µm-measured-fssp-µm-cpi.webp)