Dihydropyrimidine Accumulation Is Required
for the Epithelial-Mesenchymal Transition
The MIT Faculty has made this article openly available.
Please share
how this access benefits you. Your story matters.
Citation
Shaul, Yoav D.; Freinkman, Elizaveta; Comb, William C.; Cantor,
Jason R.; Tam, Wai Leong; Thiru, Prathapan; Kim, Dohoon et al.
“Dihydropyrimidine Accumulation Is Required for the
Epithelial-Mesenchymal Transition.” Cell 158, no. 5 (August 2014): 1094–1109
© 2014 Elsevier Inc
As Published
http://dx.doi.org/10.1016/j.cell.2014.07.032
Publisher
Elsevier
Version
Author's final manuscript
Citable link
http://hdl.handle.net/1721.1/109548
Terms of Use
Creative Commons Attribution-NonCommercial-NoDerivs License
Dihydropyrimidine accumulation is required for the
epithelial-mesenchymal transition
Yoav D Shaul1,2, Elizaveta Freinkman1, William C Comb1, Jason R Cantor1, Wai Leong Tam1,9, Prathapan Thiru1, Dohoon Kim1, Naama Kanarek1, Michael E Pacold1,7, Walter W
Chen1, Brian Bierie1, Richard Possemato1, Ferenc Reinhardt1, Robert A Weinberg1,4,6, Michael B Yaffe2,4,5, and David M Sabatini1,2,3,8
1Whitehead Institute for Biomedical Research and Massachusetts Institute of Technology,
Department of Biology, Nine Cambridge Center, Cambridge, MA 02142, USA
2Koch Institute for Integrative Cancer Research, 77 Massachusetts Avenue, Cambridge, MA
02139, USA
3Howard Hughes Medical Institute, Department of Biology, Massachusetts Institute of
Technology, Cambridge, MA 02139, USA
4Department of Biology, Massachusetts Institute of Technology, Cambridge, MA 02139, USA 5Department of Biological Engineering, Massachusetts Institute of Technology, Cambridge, MA
02139, USA
6MIT Ludwig Center for Molecular Oncology, Cambridge, MA 02139, USA
7Department of Radiation Oncology, Dana-Farber Cancer Institute, 450 Brookline Avenue,
Boston, MA 02215, USA
8Broad Institute, Cambridge, MA 02142, USA
9Genome Institute of Singapore, Singapore 138672, Singapore
Abstract
It is increasingly appreciated that oncogenic transformation alters cellular metabolism to facilitate cell proliferation, but less is known about the metabolic changes that promote cancer cell
aggressiveness. Here, we analyzed metabolic gene expression in cancer cell lines and found that a set of high-grade carcinoma lines expressing mesenchymal markers shared a unique 44-gene signature, designated the “mesenchymal metabolic signature” (MMS). A FACS-based shRNA screen identified several MMS genes as essential for the epithelial-mesenchymal transition (EMT) but not for cell proliferation. Dihydropyrimidine dehydrogenase (DPYD), a pyrimidine-degrading enzyme, was highly expressed upon EMT induction and was necessary for cells to acquire mesenchymal characteristics in vitro and for tumorigenic cells to extravasate into the mouse lung.
*Correspondence: [email protected].
Author Contributions
Y.D.S. and D.M.S. designed the research and Y.D.S. performed cell-based experiments. E.F. and M.E.P. performed mass
NIH Public Access
Author Manuscript
Cell. Author manuscript; available in PMC 2014 December 01.
Published in final edited form as:
Cell. 2014 August 28; 158(5): 1094–1109. doi:10.1016/j.cell.2014.07.032.
NIH-PA Author Manuscript
NIH-PA Author Manuscript
This role of DPYD was mediated through its catalytic activity and enzymatic products, the dihydropyrimidines. Thus, we identify metabolic processes essential for the EMT, a program associated with the acquisition of metastatic and aggressive cancer cell traits.
Introduction
Alterations in cellular metabolism are now recognized as an emerging hallmark of cancer (Hanahan and Weinberg, 2011) ). Almost a century ago, Otto Warburg observed that, under aerobic conditions, tumor cells display increased glucose uptake and glycolytic rates compared to resting cells (reviewed in (Hsu and Sabatini, 2008; Ward and Thompson, 2012)). Subsequently, many studies have revealed how this and other metabolic changes allow cancer cells to accumulate building blocks for the biosynthesis of macromolecules, while simultaneously maintaining energetic and redox balance (reviewed in (Cantor and Sabatini, 2012)). Whereas many of these mechanisms are shared with normal rapidly proliferating cells, in recent years cancer genomic data have revealed metabolic alterations that appear to occur only in specific tumor types. These changes include the loss of
succinate dehydrogenase (SDH) or fumarate hydratase (FH) in certain renal cell carcinomas and other familial cancer syndromes (reviewed in (Gottlieb and Tomlinson, 2005)), mutation of isocitrate dehydrogenase (IDH) 1 or 2 in glioma, acute myeloid leukemias, and
chondrosarcomas (Dang et al., 2009; Schulze and Harris, 2012), and amplification of phosphoglycerate dehydrogenase (PHGDH) in estrogen receptor (ER)-negative breast cancer and melanoma (Locasale et al., 2011; Possemato et al., 2011). These examples suggest that, in addition to fueling increased proliferation, cancer-associated alterations in metabolism can also satisfy tumor-specific demands.
Relatively few studies have examined the metabolic underpinnings of the cellular programs that increase cancer cell aggressiveness (Nomura et al., 2010; Ulanovskaya et al., 2013; Zhang et al., 2012). One such program is the epithelial-mesenchymal transition (EMT) (reviewed in (Nieto and Cano, 2012)) that operates in carcinoma cells and is thought to confer stem-like properties, such as enhanced survival, self-renewal, and anchorage-independent growth, all of which contribute to increased aggressiveness in vivo (Scheel and Weinberg, 2011). Indeed, EMT markers are predictive for increased invasion, loss of differentiated characteristics, metastasis, and poor prognosis in a number of human tumor types (Nieto and Cano, 2012).
To understand how cellular metabolism contributes to these and other proliferation-independent features of cancer, we created a framework for the systematic identification of metabolic alterations specific to particular tumor types, as well as those that may
characterize high-grade malignancies. By analyzing metabolic gene expression patterns in a large number of cancer cell lines, we identified a metabolic gene signature that is present in high-grade tumors bearing mesenchymal markers. Among the enzymes encoded by these genes is dihydropyrimidine dehydrogenase (DPYD), which catalyzes the rate-limiting step in pyrimidine degradation and whose physiological role in cancer was previously unknown. We find that EMT-promoting transcription factors induce the expression of DPYD and that its products, the dihydropyrimidines, must accumulate for cells to undergo an EMT. These
NIH-PA Author Manuscript
NIH-PA Author Manuscript
findings reveal that the EMT induces a particular metabolic state and suggest that DPYD may have value as a diagnostic marker or therapeutic target in high-grade carcinomas.
Results
A mesenchymal-like metabolic gene expression signature in high-grade carcinoma cells
In order to study metabolic gene expression patterns in cancer, we used publicly available data to generate a database of mRNA expression profiles for 1,704 metabolic genes in 978 human cancer cell lines (see Experimental Procedures) (Possemato et al., 2011). Aided by unsupervised hierarchical clustering, we organized the profiles into five distinct groups (Figure 1A and Table S1); for four of these groups, the basis for clustering was readily apparent (Figure 1B). One group consisted of melanoma cell lines, which uniquely express skin pigment biosynthesis genes. The cell lines in a second group were derived from hematopoietic system cancers (e.g., leukemia, lymphoma, and multiple myeloma) and, in a third, from neuroendocrine or neuroectodermal cancers (e.g., small cell lung cancer, medulloblastoma, neuroblastoma (Onganer et al., 2005; Parham, 2001)). A fourth group consisted mostly of epithelial cancer cell lines, in which cell lines originating from breast, liver, colon, kidney, etc. clustered together. These results indicate that patterns of metabolic gene expression are sufficient to organize most cancer cell lines by tissue-of-origin, suggesting that many cancers retain significant portions of the metabolic programs of their normal tissue counterparts.
The cell lines in the fifth group proved more difficult to classify, and thus were initially named the “mixed-lineage group” (Figure S1A). While this group contained almost all the cell lines derived from mesenchymal tumors (soft tissue sarcoma, osteosarcoma; 20% of the cell lines in this group) and glioblastomas, it also included a large number of carcinoma lines (e.g. non-small-cell lung, hepatocellular, and breast; 43% of the cell lines in this group). Notably, all the breast cancer lines in the mixed-lineage group were of the Basal B subtype, which are derived from high-grade carcinomas (Carey et al., 2010) (Figure 1C). Likewise, all the hepatocellular carcinoma (HCC) cell lines in this group were also derived from high-grade tumors (Park et al., 1995), and retained fewer of the metabolic gene expression features of normal liver than did the HCC lines that were in the epithelial group (Figure S1B). Such loss of epithelial and gain of mesenchymal characteristics has been associated with high-grade malignancy in a variety of carcinoma types (Brabletz, 2012). Moreover, several of the glioblastoma and the majority of Basal B breast cancer cell lines are known to bear mesenchymal characteristics (Kao et al., 2009; Verhaak et al., 2010). Thus, we thought it likely that the cell lines in the mixed-lineage group shared a common mesenchymal-like phenotype.
Indeed, Gene Set Enrichment Analysis (GSEA) (Subramanian et al., 2005) of ~17,000 genes showed that expression of the mesenchymal gene-set (EMT_UP) was significantly elevated in the mixed-lineage group relative to the other groups (FDR q-value<0.0001; Figure S1D). Furthermore, the mixed-lineage group had elevated expression of key mesenchymal markers (Mani et al., 2008), including vimentin (VIM), Snail family zinc finger 1 and 2 (SNAI1/2), N-cadherin (CDH2), Twist basic helix-loop-helix transcription factor 1 (TWIST1), and the zinc finger E-box binding homeobox 1 (ZEB1) transcription factor (Figure 1D). Lastly, the
NIH-PA Author Manuscript
NIH-PA Author Manuscript
epithelial markers claudin 1 (CLDN1) and E-cadherin (CDH1) were expressed at low levels in this group (Figure 1D). Collectively, these data suggest that the cell lines in the mixed-lineage group, regardless of tissue of origin, display a mesenchymal-like gene expression profile. Accordingly, we refer hereafter to the mixed-lineage group as the mesenchymal group of cell lines.
Identification of a mesenchymal metabolic gene expression signature
We identified a mesenchymal metabolic signature (MMS), composed of 44 metabolic genes associated with diverse metabolic pathways, as highly and differentially expressed in the mesenchymal group of cell lines relative to the other groups (see Experimental Procedures) (Table 1 and Figure 2A). The MMS is particularly enriched for glycan biosynthesis genes (36% of the genes in the set), including glutamine-fructose-6-phosphate aminotransferase (GFPT2) and acetylhexosamine pyrophosphorylase (UAP1), which encode the rate-limiting and endpoint enzymes of the hexosamine biosynthetic pathway (HBP), respectively (Elbein et al., 2004; Zhang, 2004). The HBP end product, UDP-GlcNAc, is used by the enzyme O-GlcNac transferase (OGT) as a donor substrate to modify proteins via covalent attachment of GlcNAc to serine and/or threonine residues (Ma and Vosseller, 2013). Of special interest, this modification plays an important role in mesenchymal cells by stabilizing the EMT-inducing transcription factor SNAI1, which in turn down-regulates the key epithelial marker CDH1 (Park et al., 2010). The MMS list includes other genes with known connections to cancer aggressiveness, such as ecto-5′-nucleotidase (NT5E, also known as CD73), a mesenchymal stem cell marker (Stagg et al., 2010), ectonucleotide pyrophosphatase/ phosphodiesterase 2 (ENPP2, autotaxin), which promotes cell migration and metastasis (Benesch et al., 2014), and monoacylglycerol lipase (MGLL), which enhances cancer cell aggressiveness through the production of signaling lipids (Nomura et al., 2010). These examples suggest that the remaining MMS genes may also play an important role in the mesenchymal phenotype and/or aggressiveness of certain cancer cells.
We found that the MMS genes were significantly upregulated in cell lines that express known mesenchymal markers (Figure 2B, left). For example, this gene set is upregulated in cell lines derived from Basal B breast cancer and high-grade HCC relative to their luminal and low-grade counterparts, respectively (Figure 2C). Quantitative PCR and immunoblotting confirmed the overexpression of several individual MMS genes, including nicotinamide N-methyltransferase (NNMT) and DPYD, in high-grade breast cancer and HCC cell lines (Figure 2D and 2E), which also expressed mesenchymal markers, such as ZEB1 and TWIST1, and low levels of CDH1 (Figure S2B).
We next asked if MMS gene expression correlates with that of known mesenchymal markers in primary human tumors as well as in cancer cell lines. From a database of expression profiles for 1,460 human primary tumors, including many of mesenchymal origin, we identified tumors with high expression of known mesenchymal markers (see Experimental Procedures) (Figure S2A). In such tumors, the MMS genes were significantly more highly expressed than in tumors not expressing these markers (Figure 2B and S2A). Thus, MMS gene expression correlates with that of known mesenchymal markers in both cancer cell
NIH-PA Author Manuscript
NIH-PA Author Manuscript
lines and tumors, suggesting that a particular metabolic program characterizes the mesenchymal cell state.
EMT-dependent induction of mesenchymal metabolic signature genes
Given the high expression of MMS genes in mesenchymal-like relative to epithelial cancer cell lines, we hypothesized that the EMT program may directly affect the expression of these genes. To investigate this possibility, we examined engineered human mammary epithelial (HMLE) cells that undergo an EMT upon the activation of Twist expression (HMLE-Twist-ER) following treatment with hydroxytamoxifen (OHT) (Mani et al., 2008). Over a 15-day treatment with OHT, the HMLE-Twist-ER cells shifted their cell-surface markers from an epithelial (CD24high, CD44low) to a mesenchymal (CD24low, CD44high) profile ((Al-Hajj et al., 2003), Figure S2C), induced ZEB1 and TWIST1 expression, and suppressed CDH1 (Figure 2F and 2G). Like the mesenchymal markers, MMS genes such as DPYD and NNMT also displayed a progressive increase in mRNA and protein levels over the course of OHT treatment (Figure 2F and 2G). Moreover, NAMEC cells, an HMLE-derived cell line that spontaneously acquired the mesenchymal state (Tam et al., 2013) (Figure S2D), also expressed high levels of several MMS genes (Figure 2F). Lastly, re-analysis of a previous expression profiling study comparing HMLE cells expressing an empty vector or Twist (Taube et al., 2010) showed that, unlike the majority of metabolic genes, MMS genes were upregulated upon EMT induction in culture (Figure 2H). Collectively, these results suggest that the EMT program and MMS gene induction are coupled processes.
A FACS-based pooled shRNA screen for MMS genes required for the EMT
To identify which, if any, of the MMS genes play a critical role in the EMT, we developed a FACS-based RNAi screen using a pool of 514 lentivirus vector-expressed shRNAs targeting 42 of the MMS genes, as well as non-expressed control genes (GFP, RFP, Luciferase, and LacZ), and non-MMS metabolic genes (Figure S3A). We then induced the EMT in HMLE-Twist-ER cells expressing the shRNA hairpin library, and after 15 days compared the abundance of each hairpin in FACS-sorted epithelial versus mesenchymal cell populations isolated using the CD44 and CD24 surface antigens (Figure 3A). We reasoned that knockdown (KD) of an EMT-essential gene would cause cells to remain in the epithelial state (CD24high/CD44low) even upon OHT treatment. Indeed, hairpins targeting the EMT-promoting transcription factors ZEB1 and SNAI1 were enriched in the epithelial population (Figure 3B). We also found that hairpins against 16 MMS genes were similarly enriched, suggesting that knockdown of these genes blocks activation of the EMT program (Figure 3C). Among the MMS genes, DPYD was a top hit, with 5 out of 12 hairpins scoring in the screen (Figure 3B). DPYD is the rate-limiting enzyme of the pyrimidine degradation pathway (Amstutz et al., 2011) and is also capable of degrading the chemotherapeutic agent 5-fluorouracil (5-FU), but the physiological role of this enzyme in cancer cells is unclear (Offer et al., 2013).
We wished to rule out the possibility that knockdown of DPYD and the other MMS hit genes may block the EMT by affecting the proliferation or viability of epithelial cells. Thus, in a parallel experiment, we determined the abundance of each hairpin in HMLE-Twist-ER cells before and after a 15-day period of proliferation in the absence of EMT induction
NIH-PA Author Manuscript
NIH-PA Author Manuscript
(Figure 3A, uninduced day 0 and day 15). As expected, the control hairpins as a group had a neutral effect on proliferation (median log2 hairpin abundance ratio = −0.28). Importantly, the abundance distributions of the ZEB1, SNAI1, and DPYD hairpins did not differ
significantly from the control group (Figure 3D), indicating that these hairpins did not affect cellular viability or proliferation; by contrast, hairpins targeting ribonucleotide reductase M1 (RRM1) and thymidylate synthetase (TYMS), which are critical for cell division (Tennant et al., 2010), caused a significant anti-proliferative effect (median log2 hairpin abundance ratio
= −3.23, and −2.4, respectively) (Figure 3D). Therefore, knockdown of DPYD suppressed the EMT program without inhibiting the viability or proliferation of epithelial cells, suggesting that this enzyme plays a specific role in inducing the mesenchymal cell state. To validate the identification of DPYD as essential for the EMT, we individually infected HMLE-Twist-ER cultures with eight distinct shRNAs targeting DPYD. We found that DPYD knockdown, in a dose-dependent manner, decreased the percentage of cells with a mesenchymal-like profile (CD24low/CD44high) after 15 days of Twist induction by OHT treatment (Figure S3C). DPYD knockdown with the hairpins that most strongly reduced DPYD expression (shDPYD_1 and shDPYD_4) (Figure S3D and S3G) did not affect the viability of untreated HMLE-Twist-ER cells (Figure S3E), but decreased the percentage of OHT-treated cells with a mesenchymal-like profile (Figure S3F). In order to further demonstrate the reliability of the screen, we validated another hit from the screen,
glutathione peroxidase 8 (GPX8) (Figure 3C). As for DPYD, GPX8 hairpins demonstrated a similar expression-phenotype relationship (Figure S3H), thus confirming that several MMS genes are essential for the EMT program.
DPYD expression promotes the EMT
Next, we further characterized the role of DPYD in the EMT program. In addition to inhibiting the EMT-associated changes in cell-surface marker expression (CD24high/ CD44low to CD24low/CD44high) (Figure 4A), DPYD knockdown suppressed the Twist-induced expression of known mesenchymal markers, as judged by qPCR (Figure 4B), immunoblotting (Figure 4C), and immunofluorescence (Figure 4E). Moreover, DPYD knockdown suppressed EMT-induced changes in cell morphology (Figure 4D and 4E). To rule out the possibility that the effects of the DPYD shRNAs are due to off-target effects, we restored DPYD levels in shDPYD-expressing HMLE-TwistER cells by ectopically expressing the mouse isoform of DPYD (mDPYD), which is 86% identical at the amino acid level to the human isoform (Figure S4A) but is unaffected by the shRNAs targeting the human DPYD mRNA (Figure S4B). Importantly, mDPYD rescued the effect of shDPYD on the expression of cell-surface markers (Figure 4A) and known EMT genes (Figure 4B, 4C and 4E) as well as changes in cell morphology (Figure 4D and 4E). DPYD knockdown had a similar effect on mesenchymal marker expression in PANC1 pancreatic cancer cells
engineered to express Twist-ER (Figure S4C), showing that the role of DPYD in EMT induction is not restricted to breast tissued-derived cell lines.
As an in vitro functional readout of the EMT, we measured the capacity of HMLE-Twist-ER cells to form mammospheres, migrate, and invade, which are unique properties of the mesenchymal-like (CD24low/CD44high) but not epithelial (CD24high/CD44low) cells (Mani
NIH-PA Author Manuscript
NIH-PA Author Manuscript
et al., 2008). DPYD knockdown decreased the efficiency of mammosphere formation (Figure 4F and S4D), as well as the capacity of the cells to migrate (Figure 4G and S4E) and invade matrigel (Figure 4H). Therefore, blockade of EMT induction by DPYD suppression affects multiple in vitro phenotypes of mesenchymal cells.
We then turned our attention to the role of DPYD expression in the EMT program during the progression of human cancer cells through specific aspects of the metastatic cascade in mice. Extravasation is a key step in metastasis, permitting cancer cells to migrate out of capillaries into target tissues (Nieto and Cano, 2012) and recent studies demonstrate that Twist-induced EMT promotes tumor cell extravasation (Tsai et al., 2012). To test whether DPYD plays a role in the ability of cells to extravasate, we used HMLE-Twist-ER transformed with an H-RasG12V oncogene expression vector that also expressed GFP (HMLER-TwistER cells). These cells were then infected with hairpins against DPYD together with a vector control or mDPYD, induced by OHT to undergo EMT in vitro, and injected into the mouse tail vein. As measured by GFP staining, DPYD depletion reduced the ability of HMLER-Twist-ER cells to enter the mouse lung by ~95% (Figure 4I and 4J), a process that was significantly rescued by the expression of mDPYD (Figure 4I and 4J). Thus, DPYD plays an essential role during the lung extravasation of cancer cells that are undergoing the EMT.
DPYD activity is essential for its function in the EMT
We asked whether the role of DPYD in the EMT requires its enzymatic activity. Accordingly, we tested the ability of a catalytically attenuated mouse DPYD mutant
(mDPYD-I560S, also known as DPYD*13, which has a 75% reduction in enzymatic activity relative to WT (Offer et al., 2013)), to rescue the inhibitory effect of shDPYD_1 on EMT induction. Whereas expression of wild-type mDPYD in the presence of shDPYD_1 restored the EMT induction following 15 days of OHT treatment, mDPYD-I560S had a greatly reduced capacity to rescue CD44/CD24 expression and mammosphere formation, and completely failed to restore expression of the EMT-inducing transcription factor ZEB1 (Figure 5A–C). In addition, while control cells (expressing empty vector) treated with OHT for only 10 days displayed an intermediate CD44/CD24 marker expression profile, cell lines ectopically expressing either mouse or human DPYD (DPYD-FLAG) displayed higher mesenchymal marker expression at this earlier time point (Figure 5D), resembling the profile of control cells after a full 15 days of OHT treatment (Figure 5A). Compared to wild-type DPYD, expression of the mutant DPYD-I560S (human DPYD-I560S-FLAG) had a greatly attenuated effect on cell-surface marker expression, mammosphere formation, and ZEB1 expression (Figure 5D-F). Thus, the pro-EMT role of DPYD requires DPYD residues needed for its full enzymatic activity. Moreover, the accelerated progression of the EMT in DPYD-overexpressing cells suggests that the DPYD products may be rate-limiting in EMT.
Cellular dihydropyrimidine levels are elevated during the EMT
Having demonstrated that DPYD enzymatic activity plays a critical role in the EMT program, we asked whether its metabolic products increase in abundance during this process. To do so, we used liquid chromatography and mass spectrometry (LC-MS) (Büchel et al., 2012) to determine the cellular concentration of DPYD substrates (uracil and thymine)
NIH-PA Author Manuscript
NIH-PA Author Manuscript
and immediate products (dihydrouracil (DHU) and dihydrothymine (DHT)) (Figure 5G) (Lohkamp et al., 2010). In HMLE-Twist-ER cells, overexpression or knockdown of DPYD resulted in a corresponding ~10-fold increase or decrease, respectively, in the intracellular DHU/uracil molar ratio (Figure 5H). Moreover, NAMEC cells exhibited higher DHU/uracil and DHT/thymine ratios than HMLE-Twist-ER cells (by 10- and 6-fold, respectively; Figure 5H and S5A), consistent with the higher endogenous DPYD expression level in the former cells (Figure 2F). In addition, OHT treatment of HMLE-Twist-ER cells, which progressively upregulates DPYD expression (Figure 2F and 2G), gradually increased the cellular DHU/ uracil molar ratio by 5-fold after 15 days of Twist induction (Figure 5I). DPYD expression and DHU/uracil ratios were also correlated in breast cancer and HCC cell lines (Figure 5J and 5K). Notably, the higher DHU/uracil molar ratio in MCF7 breast cancer cells compared to the other luminal breast cancer cell lines (Figure 5J) correlated with the relatively high expression of DPYD in this particular cell line (Figure 2D). Hence, DHU/uracil and DHT/ Thymine ratios correlate closely with DPYD expression levels and mesenchymal character in a number of cellular settings, suggesting that DPYD is enzymatically active in the cancer cell lines that we examined.
DPYD is normally expressed in the liver, where it is the rate-limiting enzyme of a three-step pyrimidine degradation pathway that converts uracil and thymine to β-alanine and
2-methyl-β-alanine, respectively (Figure 5G) (Lohkamp et al., 2010). In the liver, the immediate
products of DPYD are further catabolized by dihydropyrimidinase (DPYS) and beta-ureidopropionase (UPB1) (Van Kuilenburg et al., 2004) (Figure 5G). In contrast, we found that HMLE-Twist-ER and NAMEC cells express only DPYD, but not the other components of this catabolic pathway (Figure S5B). In addition, unlike that of DPYD, DPYS and UPB1 expression was not elevated in breast Basal B and high-grade HCC cell lines (Figure S5C). These observations explain why the products of DPYD activity can accumulate in
mesenchymal-like cancer cells, but may not do so in normal liver.
Intracellular dihydropyrimidines are essential for the EMT
To establish the requirement for the immediate products of DPYD in the EMT program, we ectopically expressed DPYS-FLAG, which to our knowledge is the only known enzyme that uses dihydropyrimidines (DHPs) as substrates (Van Kuilenburg et al., 2010). We found DPYS-FLAG to be an active enzyme, as it reduced the intracellular concentration of its substrates (DHPs, Figure 6A) while elevating the intracellular abundance of its immediate product, 3-ureidopropionate (Figure S6A). After 15 days of Twist induction by OHT treatment, DPYS-FLAG expression decreased the percentage of cells with a mesenchymal profile (CD24low/CD44high) (Figure 6B), and inhibited the upregulation of mesenchymal markers (Figure 6C), and the ability of the cells to migrate (Figure 6D) and form
mammospheres (Figure 6E). These results provide further evidence that the accumulation of DHPs plays a key role in the EMT program.
Next, we asked whether addition of DHU or DHT to culture media could substitute for DPYD loss. Indeed, treatment of shDPYD_1 cells with these metabolites at 10 or 100 μM resulted in a dose-dependent rescue of mammosphere formation (Figure 6F), whereas the DPYD substrate uracil had a significantly smaller effect (Figure S6B), despite the fact that
NIH-PA Author Manuscript
NIH-PA Author Manuscript
uracil and DHU accumulated to comparable intracellular concentrations (Figure S6C). Therefore, the effect of DPYD knockdown on mammosphere formation can be reversed either by ectopic expression of active DPYD (Figure 4C and 5C) or by supplementation of the cell culture media with its products. Together, these results confirm that the MMS gene product DPYD plays a critical role in the EMT via its capacity to generate
dihydropyrimidines.
Discussion
We identified a mesenchymal metabolic signature (MMS) consisting of 44 metabolic genes upregulated in cancers bearing mesenchymal markers. Several of these metabolic genes are essential for the EMT, including DPYD, the rate-limiting enzyme of the pyrimidine degradation pathway. Remarkably, the expression of DPYD is not required for cell viability or proliferation, demonstrating the existence of metabolic processes that specifically enable carcinoma cells to acquire mesenchymal-like characteristics. Because these characteristics are associated with increased cancer aggressiveness, these findings suggest that DPYD activity may play a role in carcinoma progression.
There is a clear difference between the metabolic pathways that are associated with
proliferation and those upregulated during the EMT. Compared to resting cells, proliferating cells upregulate glycolysis and nucleotide biosynthesis pathways (Hu et al., 2013), whereas the mesenchymal metabolic signature (MMS) is enriched in glycan biosynthesis genes. Glycosylation is thought to be one of the most common covalent protein modifications in eukaryotic cells, with a major role in differentiation and mediating cell-cell interactions (Li et al., 2013). Because the EMT is accompanied by major changes in cell morphology and detachment from the surrounding cells, it is reasonable to assume that a major glycan remodeling may occur during the EMT program. Furthermore, glycosylation regulates the function of several key players in the EMT, including the products of the SNAI1 and CD44 genes (Jaggupilli and Elkord, 2012; Park et al., 2010). Thus, we anticipate that future studies will further demonstrate an important role for specific glycan remodeling events in both the mesenchymal phenotype and in the EMT program.
After executing the EMT program, epithelial-derived cancer cells acquire traits associated with high-grade malignancy, including resistance to apoptosis and chemotherapy,
dedifferentiation, and invasiveness, which can lead to metastatic dissemination from primary tumors (Tam and Weinberg, 2013). Thus, inhibiting the EMT may maintain a tumor in a lower-grade state, potentially increasing therapeutic efficacy and slowing metastasis. The feasibility of manipulating epithelial plasticity is reinforced by studies showing that depletion of ZEB1 by RNA interference in mesenchymal-like cells results in a partial mesenchymal-epithelial transition (MET), presumably through the induction of CDH1 expression (Chaffer et al., 2013). However, the development of inhibitors targeting transcription factors such as ZEB1 remains a challenge (Singh and Settleman, 2010). By contrast, many of the enzymes encoded by the MMS have well-defined active sites that can potentially be targeted by small molecules. Here, we demonstrate that DPYD expression and activity are essential for the induction of ZEB1 expression, suggesting that the expression of
NIH-PA Author Manuscript
NIH-PA Author Manuscript
transcriptional drivers of the EMT program can be modulated through inhibition of metabolic enzymes such as DPYD.
Many studies have linked DPYD function with acquired tumor resistance to the chemotherapeutic agent 5-FU, but the physiologic role of this enzyme in cancer cells is unknown (Amstutz et al., 2011). By demonstrating that DPYD plays an essential role in the EMT, we provide one of the first indications for its function in cancer. However, there is a clear distinction between this function and the normal role of DPYD in the liver. In the latter, DPYD functions as the first enzyme in a three-step pathway of pyrimidine degradation, whereas we show that in mesenchymal-like cells, the expression of the two downstream enzymes (DPYS and UPB1) is not detectable at the mRNA level. Therefore, the EMT program reconfigures the pyrimidine degradation pathway in order to use only DPYD, presumably because its enzymatic activity fulfills a specific metabolic demand. We suggest that this EMT-dependent metabolic rewiring, which activates only selected components of a given metabolic pathway, is not exclusive to DPYD, but can potentially occur in other MMS-related metabolic processes. Thus, through such rewiring, the EMT may confer novel cellular functions to other pathways represented in the MMS as well. Further studies aimed at understanding the role of the MMS genes in cancer may reveal novel metabolic processes that promote cancer aggressiveness.
The function of DPYD in the EMT is dependent upon its products, the dihydropyrimidines (DHPs), DHU and DHT. However, understanding the role of these metabolites in the EMT program is challenging, because no biological function has been ascribed the DHPs other than as substrates for the enzyme DPYS. One possibility is that DHPs may act as allosteric regulators of other enzymes, similar to serine in the case of the glycolytic enzyme pyruvate kinase M2 (PKM) (Chaneton et al., 2012), or as receptor ligands, like the citric acid cycle intermediates succinate and α-ketoglutarate in the case of the G-protein coupled receptors GPR99 and GPR91, respectively (He et al., 2004). In this scenario, the DHPs themselves could act as key signaling molecules without further enzymatic processing.
Another potential function for the DHPs is that these pyrimidine bases could be converted to pyrimidine deoxynucleosides or nucleosides and thus possibly incorporated into DNA or RNA, respectively. Support for this latter possibility comes from previous studies showing that genotoxic agents can damage DNA precursors (dNTPs) in the nucleotide pools of bacterial cells (Dolinnaya et al., 2013). These chemically altered dNTPs, including the deoxynucleotide triphosphate form of DHT (DHdTTP), have been found to be incorporated into bacterial genomes (Dolinnaya et al., 2013) and are able to substitute for deoxythymidine triphosphate (dTTP) as substrates for the E. coli DNA polymerase I and Klenow fragments in vitro (H Ide, 1988; Ide et al., 1987). It remains to be determined whether such modified nucleotides can be produced in human cells and, if so, how they affect cellular phenotypes.
Experimental Procedures
Identification of the Metabolic Mesenchymal Signature (MMS) genes
For each metabolic gene, the ratio between the mean expression level in mesenchymal (mesenchymal group, Figure 1) and non-mesenchymal cell lines (all other groups) was
NIH-PA Author Manuscript
NIH-PA Author Manuscript
determined. The mean and standard deviation of all the metabolic gene expression ratios was calculated, and all genes upregulated above a 2 fold or below a −2 were classified as MMS (Table S2).
Pooled shRNA screen
pLKO.1 lentiviral plasmids encoding shRNAs targeting 74 genes (listed in Table S3)) were obtained and combined to generate a plasmid pool (Possemato et al., 2011). HMLE cells were infected with the pooled lentivirus at an MOI of 0.2–0.5 so as to ensure that most cells contained only one viral integrant. Cells were selected for 3 days with 0.5 mg/ml puromycin, after which 106 cells were removed, washed, and frozen at −80°C (Figure 3A, day 0). The remaining cells were split into treated and untreated samples. After 15 days, the OHT-treated cells were trypsinized, washed with phosphate buffered saline (PBS)+1% inactivated fetal calf (IFC) serum, and FACS-sorted using CD44/CD24 antibodies in order to separate the mesenchymal and epithelial populations.
Genomic DNA was isolated from all the cells using the QIAampDNA mini kit (Qiagen). To amplify the shRNAs encoded in the genomic DNA, PCR was performed for 33 cycles at an annealing temperature of 66°C using 3.5 μg of genomic DNA, the primer pair indicated below, and DNA polymerase (TAKARA Ex taq, Clontech lab, RR001A). Forward primers containing unique 4-nucleotide barcodes were used (see below) so that PCR products obtained from many samples could be sequenced together. After purification, the PCR products from each cell sample were quantified by ethidium bromide staining (Sigma-Aldrich, E1510) after gel electrophoresis, pooled in equal proportions, and analyzed by high-throughput sequencing (Illumina). The shRNAs from all 4 DNA samples (day 0, day 15 untreated, day 15 OHT-treated mesenchymal, and day 15 OHT-treated epithelial) were sequenced together. Sequencing reads were de-convoluted using GNU Octave software by segregating the sequencing data by barcode and matching the shRNA stem sequences to those expected to be present in the shRNA pool, allowing for mismatches of up to 3 nucleotides. The log2 values reported are the average log2 of the fold change in the
abundance of each shRNA in the mesenchymal-like samples compared to epithelial cells. The mean and standard deviation of the control hairpins (GFP, RFP, Luciferase, LacZ) were calculated and used to set a cutoff (one standard deviation below the control mean). Every gene that had at least two hairpins with a log2 value below the cutoff was considered a hit
(hairpin ratio list is in Table S4).
Metabolite Extraction
Solvents were obtained from Fisher Scientific and were Optima LC-MS grade except where otherwise specified. Cells grown in standard tissue culture plates (~500,000 cells per sample) were washed twice in an ice-cold solution of 0.9% NaCl in deionized water, followed by extraction on dry ice in 1 mL 80% methanol containing 10ng/mL phenylalanine-d8 and valine-d8 (Sigma-Aldrich, 492485 and 486612 respectively) as
internal standards. The cell mixtures were shaken vigorously on a Vortex mixer for 10 min. at 4°C, vacuum-dried, and resuspended in 100 μL LC-MS grade water (Fisher). These extracts were then centrifuged at 15,000xg at 4°C for 10 min., and the supernatants were passed through a cellulose acetate particulate filter (National Scientific).
NIH-PA Author Manuscript
NIH-PA Author Manuscript
Migration and Invasion Assays
For the migration assay, 50,000 cells were seeded into 24-well cell culture inserts with 8 μm pores (BD falcon, 353097). For invasion assay 50,000 cells were seeded on BD Matrigel invasion chambers with 8 μm pores (Corning, 62405-744). For both assays, after 20 hours, the cells on the upper surface of the filters were removed using cotton swabs. For
visualization the cells were fixed with 4% PFA in PBS, followed by methanol treatment and crystal violet. Three fields per filter were counted. Data are presented as migrated cells per filter.
Supplementary Material
Refer to Web version on PubMed Central for supplementary material.
Acknowledgments
We thank all members of the Sabatini Lab for helpful suggestions and Tom DiCesare for graphical assistance. This work was supported by grants from the NIH (CA103866 and R01 AI047389) to D.M.S, the Life Science Research Foundation and Ludwig Postdoctoral Fellowship to Y.D.S., the American Cancer Society fellowship to J.R.C, the Sally Gordon Fellowship of the Damon Runyon Cancer Research Foundation (DRG112-12) to M.E.P., Ruth L Kirchstein NRSA F30 fellowship to W.W.C, NIH K99 CA168940 to R.P., and Hope Funds for Cancer Research Fellowship (HFCR-13-03-03) and Department of Defense Breast Cancer Research Program (BC123066) to E.F. M.B.Y. is supported by NIH grants CA112967 and ES015339. D.M.S. is an investigator of the Howard Hughes Medical Institute.
References
Al-Hajj M, Wicha MS, Benito-Hernandez A, Morrison SJ, Clarke MF. Prospective identification of tumorigenic breast cancer cells. Proc Natl Acad Sci USA. 2003; 100:3983–3988. [PubMed: 12629218]
Amstutz U, Froehlich TK, Largiadèr CR. Dihydropyrimidine dehydrogenase gene as a major predictor of severe 5-fluorouracil toxicity. Pharmacogenomics. 2011; 12:1321–1336. [PubMed: 21919607] Benesch MGK, Tang X, Maeda T, Ohhata A, Zhao YY, Kok BPC, Dewald J, Hitt M, Curtis JM,
McMullen TPW, et al. Inhibition of autotaxin delays breast tumor growth and lung metastasis in mice. Faseb J. 2014; 28:2655–2666. [PubMed: 24599971]
Brabletz T. To differentiate or not — routes towards metastasis. Nat Rev Cancer. 2012; 12:425–436. [PubMed: 22576165]
Büchel B, Rhyn P, Schürch S, Bühr C, Amstutz U, Largiadèr RC. LC-MS/MS method for
simultaneous analysis of uracil, 5,6-dihydrouracil, 5-fluorouracil and 5-fluoro-5,6-dihydrouracil in human plasma for therapeutic drug monitoring and toxicity prediction in cancer patients. Cancer Sci. 2012; 27:7–16.
Cantor JR, Sabatini DM. Cancer cell metabolism: one hallmark, many faces. Cancer Discov. 2012; 2:881–898. [PubMed: 23009760]
Carey L, Winer E, Viale G, Cameron D, Gianni L. Triple-negative breast cancer: disease entity or title of convenience? Nature Reviews Clinical Oncology. 2010; 7:683–692.
Chaffer CL, Marjanovic ND, Lee T, Bell G, Kleer CG, Reinhardt F, D’Alessio AC, Young RA, Weinberg RA. Poised Chromatin at the ZEB1 Promoter Enables Breast Cancer Cell Plasticity and Enhances Tumorigenicity. Cell. 2013; 154:61–74. [PubMed: 23827675]
Chaneton B, Hillmann P, Zheng L, Martin ACL, Maddocks ODK, Chokkathukalam A, Coyle JE, Jankevics A, Holding FP, Vousden KH, et al. Serine is a natural ligand and allosteric activator of pyruvate kinase M2. Nature. 2012; 491:458–462. [PubMed: 23064226]
Dang L, White DW, Gross S, Bennett BD, Bittinger MA, Driggers EM, Fantin VR, Jang HG, Jin S, Keenan MC, et al. Cancer-associated IDH1 mutations produce 2-hydroxyglutarate. Nature. 2009; 462:739–744. [PubMed: 19935646]
NIH-PA Author Manuscript
NIH-PA Author Manuscript
Dolinnaya NG, Kubareva EA, Romanova EA, Trikin RM, Oretskaya TS. Thymidine glycol: the effect on DNA molecular structure and enzymatic processing. Biochimie. 2013; 95:134–147. [PubMed: 23000318]
Elbein SC, Zheng H, Jia Y, Chu W, Cooper JJ, Hale T, Zhang Z. Molecular screening of the human glutamine–fructose-6-phosphate amidotransferase 1 (GFPT1) gene and association studies with diabetes and diabetic nephropathy. Mol Genet Metab. 2004; 82:321–328. [PubMed: 15308130] Gottlieb E, Tomlinson IPM. Mitochondrial tumour suppressors: a genetic and biochemical update. Nat
Rev Cancer. 2005; 5:857–866. [PubMed: 16327764]
Ide H, SSW. Dihydrothymidine and thymidine glycol triphosphates as substrates for DNA
polymerases: differential recognition of thymine C5-C6 bond saturation and sequence specificity of incorporation. Nucleic Acids Res. 1988; 16:11339. [PubMed: 3060857]
Hanahan D, Weinberg RA. Hallmarks of Cancer: The Next Generation. Cell. 2011; 144:646–674. [PubMed: 21376230]
He W, Miao FJP, Lin DCH, Schwandner RT, Wang Z, Gao J, Chen JL, Tian H, Ling L. Citric acid cycle intermediates as ligands for orphan G-protein-coupled receptors. Nat Cell Biol. 2004; 429:188–193.
Hsu PP, Sabatini DM. Cancer cell metabolism: Warburg and beyond. Cell. 2008; 134:703–707. [PubMed: 18775299]
Hu J, Locasale JW, Bielas JH, O’Sullivan J, Sheahan K, Cantley LC, Heiden MGV, Vitkup D. Heterogeneity of tumor-induced gene expression changes in the human metabolic network. Nat Biotechnol. 2013
Ide H, Melamede RJ, Wallace SS. Synthesis of dihydrothymidine and thymidine glycol 5′-triphosphates and their ability to serve as substrates for Escherichia coli DNA polymerase I. Biochemistry. 1987; 26:964–969. [PubMed: 3552040]
Jaggupilli A, Elkord E. Significance of CD44 and CD24 as cancer stem cell markers: an enduring ambiguity. Clin Dev Immunol. 2012:708036. [PubMed: 22693526]
Kao J, Salari K, Bocanegra M, Choi YL, Girard L, Gandhi J, Kwei KA, Hernandez-Boussard T, Wang P, Gazdar AF, et al. Molecular Profiling of Breast Cancer Cell Lines Defines Relevant Tumor Models and Provides a Resource for Cancer Gene Discovery. PLoS ONE. 2009; 4:e6146. [PubMed: 19582160]
Li S, Mo C, Peng Q, Kang X, Sun C, Jiang K, Huang L, Lu Y, Sui J, Qin X, et al. Cell Surface Glycan Alterations in Epithelial Mesenchymal Transition Process of Huh7 Hepatocellular Carcinoma Cell. PLoS ONE. 2013; 8:e71273. [PubMed: 23977005]
Locasale JW, Grassian AR, Melman T, Lyssiotis CA, Mattaini KR, Bass AJ, Heffron G, Metallo CM, Muranen T, Sharfi H, et al. Phosphoglycerate dehydrogenase diverts glycolytic flux and
contributes to oncogenesis. Br J Cancer. 2011; 43:869–874.
Lohkamp B, Voevodskaya N, Lindqvist Y, Dobritzsch D. Insights into the mechanism of
dihydropyrimidine dehydrogenase from site-directed mutagenesis targeting the active site loop and redox cofactor coordination. Biochimica Et Biophysica Acta (BBA) - Proteins and Proteomics. 2010; 1804:2198–2206.
Ma Z, Vosseller K. O-GlcNAc in cancer biology. Amino Acids. 2013:1–15.
Mani SA, Guo W, Liao MJ, Eaton EN, Ayyanan A, Zhou AY, Brooks M, Reinhard F, Zhang CC, Shipitsin M, et al. The Epithelial-Mesenchymal Transition Generates Cells with Properties of Stem Cells. Cell. 2008; 133:704–715. [PubMed: 18485877]
Nieto MA, Cano A. The epithelial–mesenchymal transition under control: Global programs to regulate epithelial plasticity. Seminars in Cancer Biology. 2012; 22:361–368. [PubMed: 22613485] Nomura DK, Long JZ, Niessen S, Hoover HS, Ng SW, Cravatt BF. Monoacylglycerol Lipase
Regulates a Fatty Acid Network that Promotes Cancer Pathogenesis. Cell. 2010; 140:49–61. [PubMed: 20079333]
Offer SM, Wegner NJ, Fossum C, Wang K, Diasio RB. Phenotypic profiling of DPYD variations relevant to 5-fluorouracil sensitivity using real-time cellular analysis and in vitro measurement of enzyme activity. Cancer Res. 2013
Onganer PU, Seckl MJ, Djamgoz MBA. Neuronal characteristics of small-cell lung cancer. Br J Cancer. 2005; 93:1197–1201. [PubMed: 16265346]
NIH-PA Author Manuscript
NIH-PA Author Manuscript
Parham DM. Neuroectodermal and neuroendocrine tumors principally seen in children. Am J Clin Pathol. 2001; 115(Suppl):S113–S128. [PubMed: 11993686]
Park JG, Lee JH, Kang MS, Park KJ, Jeon YM, Lee HJ, Kwon HS, Park HS, Yeo KS, Lee KU. Characterization of cell lines established from human hepatocellular carcinoma. Int J Cancer. 1995; 62:276–282. [PubMed: 7543080]
Park SY, Kim HS, Kim NH, Ji S, Cha SY, Kang JG, Ota I, Shimada K, Konishi N, Nam HW, et al. Snail1 is stabilized by O-GlcNAc modification in hyperglycaemic condition. Embo J. 2010; 29:3787–3796. [PubMed: 20959806]
Possemato R, Marks KM, Shaul YD, Pacold ME, Kim D, Birsoy K, Sethumadhavan S, Woo H-K, Jang HG, Jha AK, et al. Functional genomics reveal that the serine synthesis pathway is essential in breast cancer. Nature. 2011
Scheel C, Weinberg RA. Phenotypic plasticity and epithelial-mesenchymal transitions in cancer and normal stem cells? Int J Cancer. 2011; 129:2310–2314. [PubMed: 21792896]
Schulze A, Harris AL. How cancer metabolism is tuned for proliferation and vulnerable to disruption. Nature. 2012; 491:364–373. [PubMed: 23151579]
Singh A, Settleman J. EMT, cancer stem cells and drug resistance: an emerging axis of evil in the war on cancer. Oncogene. 2010; 29:4741–4751. [PubMed: 20531305]
Stagg J, Divisekera U, McLaughlin N, Sharkey J, Pommey S, Denoyer D, Dwyer KM, Smyth MJ. Anti-CD73 antibody therapy inhibits breast tumor growth and metastasis. Proceedings of the National Academy of Sciences. 2010; 107:1547–1552.
Subramanian A, Tamayo P, Mootha VK, Mukherjee S, Ebert BL, Gillette MA, Paulovich A, Pomeroy SL, Golub TR, Lander ES, et al. Application of a priori established gene sets to discover
biologically important differential expression in microarray data. Proceedings of the National Academy of Sciences. 2005; 102:15278–15279.
Tam WL, Weinberg RA. The epigenetics of epithelial-mesenchymal plasticity in cancer. Nature Medicine. 2013; 19:1438–1449.
Tam WL, Lu H, Buikhuisen J, Soh BS, Lim E, Reinhardt F, Wu ZJ, Krall JA, Bierie B, Guo W, et al. Protein Kinase C α Is a Central Signaling Node and Therapeutic Target for Breast Cancer Stem Cells. Cancer Cell. 2013; 24:347–364. [PubMed: 24029232]
Taube JH, Herschkowitz JI, Komurov K, Zhou AY, Gupta S, Yang J, Hartwell K, Onder TT, Gupta PB, Evans KW, et al. Core epithelial-to-mesenchymal transition interactome gene-expression signature is associated with claudin-low and metaplastic breast cancer subtypes. Proc Natl Acad Sci USA. 2010; 107:15449–15454. [PubMed: 20713713]
Tennant DA, nRULVDA, Gottlieb E. Targeting metabolic transformation for cancer therapy. Nat Rev Cancer. 2010; 10:267–277. [PubMed: 20300106]
Tsai JH, Donaher JL, Murphy DA, Chau S, Yang J. Spatiotemporal regulation of epithelial-mesenchymal transition is essential for squamous cell carcinoma metastasis. Cancer Cell. 2012; 22:725–736. [PubMed: 23201165]
Ulanovskaya OA, Zuhl AM, Cravatt BF. NNMT promotes epigenetic remodeling in cancer by creating a metabolic methylation sink. Nature Chemical Biology. 2013
Van Kuilenburg ABP, Dobritzsch D, Meijer J, Meinsma R, Benoist JF, Assmann B, Schubert S, Hoffmann GF, Duran M, de Vries MC, et al. Dihydropyrimidinase deficiency: Phenotype, genotype and structural consequences in 17 patients. Biochim Biophys Acta. 2010; 1802:639–648. [PubMed: 20362666]
Van Kuilenburg ABP, Meinsma R, Beke E, Assmann B, Ribes A, Lorente I, Busch R, Mayatepek E, Abeling NGGM, van Cruchten A, et al. beta-Ureidopropionase deficiency: an inborn error of pyrimidine degradation associated with neurological abnormalities. Hum Mol Genet. 2004; 13:2793–2801. [PubMed: 15385443]
Verhaak RGW, Hoadley KA, Purdom E, Wang V, Qi Y, Wilkerson MD, Miller CR, Ding L, Golub T, Mesirov JP, et al. Integrated Genomic Analysis Identifies Clinically Relevant Subtypes of Glioblastoma Characterized by Abnormalities in PDGFRA, IDH1, EGFR, and NF1. Cancer Cell. 2010; 17:98–110. [PubMed: 20129251]
Ward PS, Thompson CB. Metabolic reprogramming: a cancer hallmark even warburg did not anticipate. Cancer Cell. 2012; 21:297–308. [PubMed: 22439925]
NIH-PA Author Manuscript
NIH-PA Author Manuscript
Zhang H. Common Variants in Glutamine:Fructose-6-Phosphate Amidotransferase 2 (GFPT2) Gene Are Associated with Type 2 Diabetes, Diabetic Nephropathy, and Increased GFPT2 mRNA Levels. Journal of Clinical Endocrinology & Metabolism. 2004; 89:748–755. [PubMed: 14764791]
Zhang WC, Shyh-Chang N, Yang H, Rai A, Umashankar S, Ma S, Soh BS, Sun LL, Tai BC, Nga ME, et al. Glycine Decarboxylase Activity Drives Non-Small Cell Lung Cancer Tumor-Initiating Cells and Tumorigenesis. Cell. 2012; 148:259–272. [PubMed: 22225612]
NIH-PA Author Manuscript
NIH-PA Author Manuscript
Highlights
• Mesenchymal-like cancer cell lines express a common metabolic gene signature
• Mesenchymal metabolic signature (MMS) genes are upregulated during the EMT
• The pyrimidine degradation enzyme DPYD is essential for the EMT
• Accumulation of DPYD products is essential for the EMT
NIH-PA Author Manuscript
NIH-PA Author Manuscript
Figure 1. Based on metabolic gene expression patterns, high-grade carcinoma cell lines co-cluster with mesenchymal cells
(A) Metabolic gene expression patterns are sufficient to cluster most, but not all, cancer cell lines based on their tissue of origin. Two-way hierarchical clustering of the expression levels of 1,704 metabolic genes in 978 different cell lines is presented as a heatmap
(B) Cell lines derived from related cancer types co-cluster based on metabolic gene expression patterns. Each row shows all the cell lines in the dataset derived from the indicated cancer type. Within each row, each black line represents the position of a cell line in the cluster.
(C) Most high-grade hepatocellular carcinoma (HCC) and basal B breast cancer cell lines cluster within the mesenchymal group.
(D) Known mesenchymal markers are highly expressed in the mesenchymal group. Cancer cell lines were ordered as in (A).
NIH-PA Author Manuscript
NIH-PA Author Manuscript
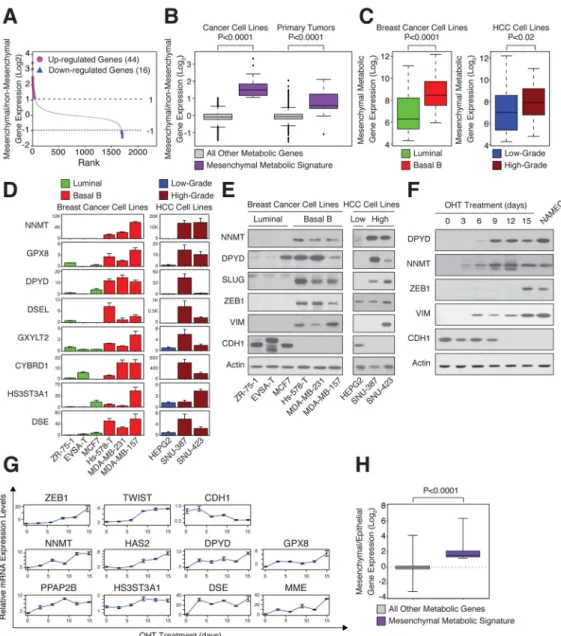
Figure 2. High expression of mesenchymal metabolic signature (MMS) genes in mesenchymal cell lines
(A) Identification of the MMS. For each metabolic gene, the ratio between the mean expression level in the mesenchymal group of cell lines and in all other groups (see Figure 1) was determined and used to rank the genes. Genes that are upregulated (purple, 44 genes) or downregulated (blue, 16 genes) by at least 2-fold in mesenchymal relative to non-mesenchymal cells are highlighted.
(B) Elevated MMS gene expression in mesenchymal cancer cell lines and primary tumors. Cancer cell lines and primary tumors were divided into mesenchymal and non-mesenchymal groups based on the expression of known mesenchymal markers (Figure 1D and Figure S2A). For each metabolic gene, the ratio of the mean expression level between the groups was determined. The box plots represent the log2 ratio distribution of MMS genes (purple)
and all other metabolic genes (gray).
NIH-PA Author Manuscript
NIH-PA Author Manuscript
(C) MMS gene expression is elevated in Basal B breast and high-grade HCC cancer cell lines. Box plots represent the expression levels of the MMS genes in the indicated breast cancer (green, luminal; red, Basal B) and HCC (blue, low-grade; brown, high-grade) subtypes.
(D) Individual validation of MMS mRNA levels in breast cancer (green, luminal; red, Basal B) and HCC (blue, low-grade; brown, high-grade) cell lines by quantitative real-time PCR (qPCR). Each value represents the mean ± SEM for n=3.
(E) Individual validation of MMS protein levels in the indicated breast cancer and HCC cell lines by immunoblotting.
(F) MMS protein upregulation in the same cells as in (G). HMLE-Twist-ER cells were treated with hydroxytamoxifen (OHT) to induce an EMT for 15 days. Every three days, cellular proteins were isolated and subjected to immunoblotting using the indicated antibodies. NAMEC cells are mesenchymal cells derived from HMLE cells (see Experimental Procedures).
(G) MMS gene upregulation in an HMLE-Twist-ER inducible EMT system. Every three days, cells were collected and mRNA isolated and subjected to qPCR using the indicated probes. Each value represents the mean ± SEM.
(H) MMS genes are upregulated during the EMT. Microarray analysis for gene expression changes during EMT was described previously (GSE24202,(Taube et al., 2010)). Here the same dataset was reanalyzed for the log2 expression ratio of MMS and all other metabolic
genes between HMLE-Twist-ER cells forced to express Twist and Snai1 (mesenchymal) to HMLE-Twist-ER expressing empty vector (epithelial). The box plots represent the log2 ratio
expression distributions of MMS genes (purple) and all other metabolic genes (gray). The p value for the comparison between the two groups was determined using the Student’s T test.
NIH-PA Author Manuscript
NIH-PA Author Manuscript
Figure 3. A FACS-based pooled shRNA screen identifies DPYD as required for EMT
(A) Schematic presentation of the FACS-based pooled shRNA screen. OHT, hydroxytamoxifen; gDNA, genomic DNA.
(B) DPYD knockdown (KD) inhibits the EMT. All hairpins from the screen were ranked based on the log2 ratio of their abundance in the mesenchymal relative to the epithelial
population of OHT-induced HMLE-Twist-ER cells after FACS sorting (see Figure 3A). Hairpin sub-pools pictured include those targeting control genes (39 hairpins targeting RFP, GFP, luciferase, and LacZ), ZEB1 (9 hairpins), SNAI1 (8 hairpins), and DPYD (12
hairpins). One standard deviation below the mean of the distribution of the control hairpins was set as a cutoff (red line). Every hairpin with a log2 ratio below the cutoff was considered
NIH-PA Author Manuscript
NIH-PA Author Manuscript
a hit. The significance of the differences in distribution between the selected genes and the other genes in the screen was quantified using the Student’s T test.
(C) Several of the MMS genes are critical for the EMT. Genes with at least two hairpins scoring below the cutoff (see panel B) were classified as hit genes. The numbers in the table represent the hit genes as a fraction of the total genes in a given sub-pool.
(D) DPYD KD does not affect cell viability. All hairpins were ranked based on the log2 ratio
of their abundance in uninduced HMLE-Twist-ER cells on day 15 relative to day 0. The same hairpin sub-pools as in (B), with the addition of shRNAs targeting the essential genes RRM1 (4 hairpins) and TYMS (5 hairpins), are shown. The significance of the differences in distribution between the selected genes and the control genes was quantified using Student’s T test.
NIH-PA Author Manuscript
NIH-PA Author Manuscript
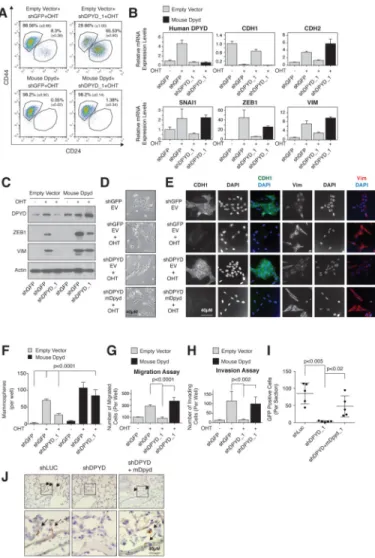
Figure 4. DPYD expression is essential for EMT induction
(A) Mouse DPYD expression rescues the effects of DPYD KD on the EMT. HMLE-Twist-ER cells were infected and treated as indicated followed by FACS analysis for the cell-surface markers CD24 and CD44. The percentage of cells in each gate is presented (mean ± SD).
(B) Mouse DPYD rescues the effects of DPYD KD on mesenchymal gene expression. HMLE-Twist-ER cells were infected and treated as indicated. The expression levels of the indicated genes were measured using qPCR (mean ± SEM).
(C) Mouse DPYD rescues the effects of DPYD KD on ZEB1 expression. HMLE-Twist-ER cells were infected and treated as indicated. Followed by immunoblotting with the indicated antibodies.
(D) Mouse DPYD rescues the effects of DPYD KD on cell morphology. HMLE-Twist-ER cells were infected and treated as in (B) and visualized with bright-field microscopy. EV, empty vector.
(E) Mouse DPYD rescues the effects of DPYD KD on cell morphology and gene expression. HMLE-Twist-ER cells were infected and treated as in (B) and the indicated proteins were visualized by immunofluorescence.
NIH-PA Author Manuscript
NIH-PA Author Manuscript
(F) Mouse DPYD rescues the effects of DPYD KD on mammosphere formation.
Quantification of in vitro mammosphere formation by cells treated as in (C). The data are reported as the number of mammospheres formed per 500 seeded cells; each value represents the mean ± SD for n=6.
(G)Mouse DPYD rescues the effects of DPYD KD on cell migration. HMLE-Twist-ER cells were infected and treated as in (B) and their ability to migrate was measured. The data are reported as the number of migrated cells per 50,000 seeded cells; each value represents the mean ± SD for n=3. EV, empty vector.
(H) Mouse DPYD rescues the effects of DPYD KD on cell invasiveness. HMLE-Twist-ER cells were infected and treated as in (B) and their ability to migrate through Matrigel was measured. The data are reported as in (G).
(I) DPYD KD inhibits lung extravasation of cancer cells in vivo. HMLER-Twist-ER cells expressing the indicated hairpins and ORFs were treated with OHT for 15 days, and then injected into the mouse tail vein. After 3 days the number of GFP positive cells in each lung was determined by IHC. Each value (●) represents the average of three non-adjacent lung sections from a single mouse (5 mice per group).
(J) DPYD KD inhibits lung extravasation of cancer cells in vivo. Representative GFP-positive cells from the same mouse lungs as in (I) are indicated with arrows. The bottom panels show magnifications of the boxed areas in the upper panels.
NIH-PA Author Manuscript
NIH-PA Author Manuscript
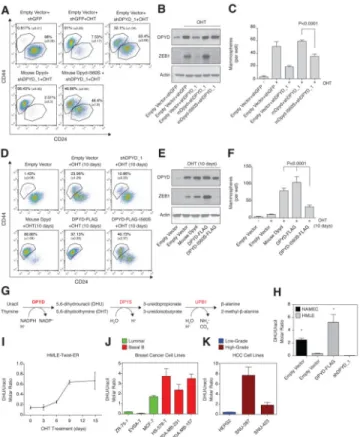
Figure 5. DPYD activity is essential for the EMT
(A) Mouse DPYD-I560S fails to rescue the effects of DPYD KD on the EMT. HMLE-Twist-ER cells were infected and treated as indicated followed by FACS analysis as in Figure 4A.
(B) Mouse DPYD-I560S fails to rescue the effects of DPYD KD on ZEB1 expression. HMLE-Twist-ER cells were infected and treated as indicated followed by immunoblotting with the indicated antibodies.
(C) The I560S mutation prevents the capacity of mDPYD to promote mammosphere formation in DPYD KD cells. Cells treated as in (B) were subjected to the in vitro mammosphere formation assay as in Figure 4F.
(D) DPYD activity accelerates the EMT. HMLE-Twist-ER cells infected with the indicated constructs were either left untreated or treated with OHT for 10 days, followed by FACS analysis as in Figure 4A. The percentage of cells in each gate is presented.
(E) Unlike wild-type human DPYD, overexpression of the catalytically attenuated DPYD (DPYD-I560S) does not potentiate the Twist-induced ZEB1 upregulation after 10 days of OHT treatment. Cells infected with the indicated constructs were either left untreated or treated with OHT for 10 days, followed by immunoblotting with the indicated antibodies. (F) DPYD activity enhances mammosphere formation. Cells treated as in (D) were subjected to the in vitro mammosphere formation assay as in Figure 4F.
(G)Schematic presentation of the pyrimidine degradation pathway. Gene names are marked in red: DPYD, dihydropyrimidine dehydrogenase (rate-limiting step); DPYS,
dihydropyrimidinase; UPB1, beta-ureidopropionase.
NIH-PA Author Manuscript
NIH-PA Author Manuscript
(H) Modulation of DPYD expression affects the cellular DHU/uracil molar ratio. DHU and uracil levels were measured by liquid chromatography and mass spectrometry (LC-MS) in NAMEC or HMLE-Twist-ER cell lines expressing empty vector, DPYD-FLAG or shDPYD_1 hairpin. Each value represents the mean ± SD.
(I) The cellular DHU/uracil ratio increases during EMT. HMLE-Twist-ER cells were treated with OHT for 15 days. At the indicated time points, samples were collected and subjected to LC-MS analysis to determine DHU and uracil levels. The molar concentration ratio between the two metabolites in each sample is presented. Each value represents the mean ± SD. (J) The cellular DHU/uracil ratio is elevated in Basal B relative to luminal breast cancer cell lines. The concentrations of DHU and uracil were measured in the indicated breast cancer cell lines (green, luminal; red, basal B) using LC-MS. Each value represents the mean ± SD. (K) The cellular DHU/uracil ratio is elevated in high-grade relative to low-grade HCC cell lines. Same as (D), but for HCC cell lines (blue, low-grade; brown, high-grade). Each value represents the mean ± SD for n=3.
NIH-PA Author Manuscript
NIH-PA Author Manuscript
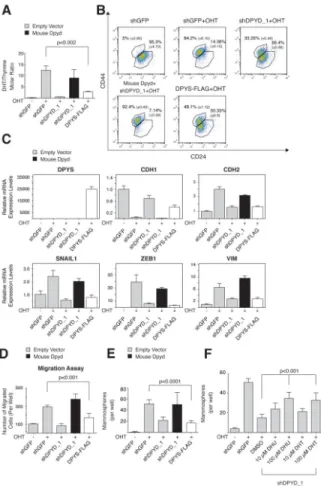
Figure 6. DPYS expression inhibits the EMT program
(A) DPYS-FLAG expression reduces the cellular DHT/thymine ratio. HMLE-Twist-ER cells were infected and treated as indicated followed by liquid chromatography and mass spectrometry (LC-MS) to measure the intracellular DHT and thymine concentration. Each value represents the mean ± SD.
(B) DPYS-FLAG expression inhibits the EMT program. HMLE-Twist-ER cells were infected and treated as in (A) followed by FACS analysis for the cell-surface markers CD24 and CD44. The percentage of cells in each gate is presented.
(C) DPYS-FLAG expression reduces the expression level of mesenchymal genes. HMLE-Twist-ER cells were infected and treated as in (A) and the indicated gene expression levels were measured using qPCR.
(D) DPYS-FLAG expression inhibits cell migration. HMLE-Twist-ER cells were infected and treated as in (A) and their ability to migrate was determined. The data are reported as in Figure 4G.
(E) DPYS-FLAG expression inhibits mammosphere formation. Quantification of in vitro mammosphere formation by cells infected and treated as in (A). The data are reported as in Figure 4F.
(F) DPYD products rescue the effect of DPYD KD on mammosphere formation. HMLE-Twist-ER cells expressing shDPYD_1 were treated with the indicated concentrations of
NIH-PA Author Manuscript
NIH-PA Author Manuscript
DHU or DHT and subjected to the in vitro mammosphere formation assay as in (E). The data are reported as in Figure 4F.
NIH-PA Author Manuscript
NIH-PA Author Manuscript
NIH-PA Author Manuscript
NIH-PA Author Manuscript
NIH-PA Author Manuscript
Table 1
The mesenchymal metabolic signature genes, classified by metabolic pathway
Genes marked in bold are upregulated in mesenchymal cells. Underlined genes are rate-limiting enzymes.
Metabolic Pathways Metabolic Enzymes
Nucleotide pyrimidine degradation DPYDa,b
other AK5,a ENPP1,a NT5Ea
Lipid triacylglycerol degradation MGLLa
cholesterol TM7SF2, AKR1B1a
sphingosine SPHK1,a UGCGa
signaling ENPP2, a PPAP2B,a PPAPDC1A,a PDE1C,a PLCB4,a PTGR1,a PIK3C2B, PLCG2, ALDH1A1, PIP5K1B
Amino Acid branched amino acid degradation BCAT1a
amino acid degradation CYP1B1a
tetrahydrobiopterin biosynthesis GCH1
Carbon TCA cycle CYBRD,a COX7A1,a CYBA
Redox glutathione MGST1,a GPX8,a GPX2
Glycan beta-galactose ST6GAL1, GLB1L2
dermatan sulfate DSE,a DSELa
heparin sulfate HS3ST3A1,a EXT1a
sulfatases ARSJ,a SULF1,a PAPSS2a
glcNac GFPT2, a,b GALNT10,a UAP1a
glycan GXYLT2,a GBE1,a GLT8D2,a GALNT3
hyaluronan HAS2a
glyco protein PAM,a CHI3L1a
other B3GNT9,a MFNG, HPDL
Cofactor nicotinamide AOX1,a NNMT,a QPRT
Other MICAL2,a MME,a DDAH1,a MSRB3,a CA12,a PTER, CA2
TCA, tricarboxylic acid; GlcNAc, N-acetylglucosamine.
a
These genes are upregulated in mesenchymal cells.
b