HAL Id: hal-00568788
https://hal.archives-ouvertes.fr/hal-00568788
Preprint submitted on 22 Dec 2015HAL is a multi-disciplinary open access
archive for the deposit and dissemination of sci-entific research documents, whether they are pub-lished or not. The documents may come from teaching and research institutions in France or abroad, or from public or private research centers.
L’archive ouverte pluridisciplinaire HAL, est destinée au dépôt et à la diffusion de documents scientifiques de niveau recherche, publiés ou non, émanant des établissements d’enseignement et de recherche français ou étrangers, des laboratoires publics ou privés.
Source contributions to Northern Hemisphere CO and
black carbon during spring and summer 2008 from
POLARCAT and START08/preHIPPO observations
and MOZART-4
S. Tilmes, L. K. Emmons, Kathy S. Law, Gérard Ancellet, H. Schlager, J.-D.
Paris, Henry E. Fuelberg, D. G. Streets, C. Wiedinmyer, G. S. Diskin, et al.
To cite this version:
S. Tilmes, L. K. Emmons, Kathy S. Law, Gérard Ancellet, H. Schlager, et al.. Source contributions to Northern Hemisphere CO and black carbon during spring and summer 2008 from POLARCAT and START08/preHIPPO observations and MOZART-4. 2015. �hal-00568788�
ACPD
11, 5935–5983, 2011
Source contributions to NH CO and black carbon during spring
and summer 2008 S. Tilmes et al. Title Page Abstract Introduction Conclusions References Tables Figures J I J I Back Close
Full Screen / Esc
Printer-friendly Version Interactive Discussion Discussion P a per | Dis cussion P a per | Discussion P a per | Discussio n P a per
Atmos. Chem. Phys. Discuss., 11, 5935–5983, 2011 www.atmos-chem-phys-discuss.net/11/5935/2011/ doi:10.5194/acpd-11-5935-2011
© Author(s) 2011. CC Attribution 3.0 License.
Atmospheric Chemistry and Physics Discussions
This discussion paper is/has been under review for the journal Atmospheric Chemistry and Physics (ACP). Please refer to the corresponding final paper in ACP if available.
Source contributions to Northern
Hemisphere CO and black carbon during
spring and summer 2008 from POLARCAT
and START08/preHIPPO observations and
MOZART-4
S. Tilmes1, L. K. Emmons1, K. S. Law2, G. Ancellet2, H. Schlager3, J.-D. Paris4, H. E. Fuelberg5, D. G. Streets6, C. Wiedinmyer1, G. S. Diskin7, Y. Kondo8, J. Holloway9,10, J. P. Schwarz9,10, J. R. Spackman9,10, T. Campos1, P. N ´ed ´elec11, and M. V. Panchenko12
1
National Center for Atmospheric Research, Boulder, Colorado, USA 2
LATMOS-IPSL; UPMC Univ. Paris 06; Univ. Versailles St-Quentin; CNRS/INSU, Paris, France 3
Institute for Physics of the Atmosphere, Oberpfaffenhofen, Wessling, Germany 4
Laboratoire des Sciences du Climat et de l’Environnement/IPSL, CNRS-CEA-UVSQ, Orme des Merisiers, CEA Saclay, Gif sur Yvette, France
5
ACPD
11, 5935–5983, 2011
Source contributions to NH CO and black carbon during spring
and summer 2008 S. Tilmes et al. Title Page Abstract Introduction Conclusions References Tables Figures J I J I Back Close
Full Screen / Esc
Printer-friendly Version Interactive Discussion Discussion P a per | Dis cussion P a per | Discussion P a per | Discussio n P a per | 6
Argonne National Laboratory, DIS/221 9700 South Cass Avenue Argonne, Illinois 60439, USA
7
NASA Langley Research Center, Hampton, Virginia, USA 8
Research Center for Advanced Science and Technology, The University of Tokyo 4-6-1 Komaba, Meguro, Tokyo 153-8904, Japan
9
NOAA Earth System Research Laboratory, Boulder, CO, USA 10
Cooperative Institute for Research in Environmental Sciences (CIRES), University of Colorado, Boulder, USA
11
Laboratoire d’A ´erologie, CNRS-UPS, Toulouse, France 12
Institute of Atmospheric Optics, SB-RAS, Tomsk, Russia
Received: 24 January 2011 – Accepted: 7 February 2011 – Published: 21 February 2011 Correspondence to: S. Tilmes (tilmes@ucar.edu)
ACPD
11, 5935–5983, 2011
Source contributions to NH CO and black carbon during spring
and summer 2008 S. Tilmes et al. Title Page Abstract Introduction Conclusions References Tables Figures J I J I Back Close
Full Screen / Esc
Printer-friendly Version Interactive Discussion Discussion P a per | Dis cussion P a per | Discussion P a per | Discussio n P a per Abstract
Anthropogenic pollution and wildfires are main producers of carbon monoxide (CO) and black carbon (BC) in the Northern Hemisphere. High concentrations of these compounds are transported into the Arctic troposphere, influencing the ecosystem in high northern latitudes and the global climate. The global chemical transport model
5
MOZART-4 is used to quantify the seasonal evolution of the contribution of CO and BC from different source regions in spring and summer 2008 by tagging their emissions. Aircraft observations from the POLARCAT experiments, in particular NASA ARCTAS, NOAA ARCPAC, POLARCAT-France, DLR GRACE and YAK-AEROSIB, as well as the NSF START08/preHIPPO experiments during Spring-Summer 2008 are combined to
10
quantify the representation of simulated tracer characteristics in anthropogenic and fire plumes. In general, the model reproduces CO and BC well. Based on aircraft measurements and FLEXPART back-trajectories, the altitude contribution of emissions coming from different source regions is well captured in the model. Uncertainties of the MOZART-4 model are identified by comparing the data with model results on the flight
15
tracks and using MOPITT satellite observations. Anthropogenic emissions are under-estimated by about 10% in high northern latitudes in spring, and shortcomings exist in simulating fire plumes. The remote impact of East-Siberian fire emissions is underesti-mated for spring, whereas the impact of Southeast Asian fire emissions to mid-latitude CO values is overestimated by the model. In summer, mid-latitude CO values agree
20
well between model and observations, whereas summer high latitude East-Siberian fire emissions in the model are overestimated by 20% in comparison to observations in the region. On the other hand, CO concentrations are underestimated by about 30% over Alaska and Canada at altitudes above 4 km. BC values are overestimated by the model at altitudes above 4 km in summer. Based on MOZART-4, with tagged CO and
25
BC tracers, anthropogenic emissions of Asia, Europe and the US have the largest con-tribution to the CO and BC in mid- and high latitudes in spring and summer. Southeast Asian, Chinese and Indian fires have a large impact on CO pollution in spring in low
ACPD
11, 5935–5983, 2011
Source contributions to NH CO and black carbon during spring
and summer 2008 S. Tilmes et al. Title Page Abstract Introduction Conclusions References Tables Figures J I J I Back Close
Full Screen / Esc
Printer-friendly Version Interactive Discussion Discussion P a per | Dis cussion P a per | Discussion P a per | Discussio n P a per |
latitudes with a maximum between 20◦ and 30◦N, whereas Siberian fires contribute largely to the pollution in high latitudes, up to 10% in spring and up to 30% in summer. The largest contributions to BC values in high latitudes are from anthropogenic emis-sions (about 70%). CO and BC have larger mass loadings in April than in July, as a result of photochemistry and dynamics.
5
1 Introduction
Anthropogenic pollution and wildfires are the main producers of carbon monoxide (CO) and black carbon (BC) in the Northern Hemisphere (NH). These tracers are transported from mid-latitudes into the Arctic troposphere, where they influence the ecosystems at high northern latitudes. Tropospheric CO accumulates in winter and spring in high
lat-10
itudes due to the reduced photochemistry as a result of little sunlight. Between spring and late summer, fires significantly contribute to the amount of CO and BC in the Arctic. CO is an important precursor for ozone and therefore has an influence on the tropo-spheric ozone budget and climate. Due to its strongly light-absorbing characteristic, BC has an important impact on the global radiation budget and climate (Clarke and
15
Noone, 1985; Hansen and Nazarenko, 2004; Flanner et al., 2007; Koch and Del Ge-nio, 2010) and contributes to the rapid warming of the Arctic (Christensen et al., 2007). The deposition of BC on snow changes its albedo and leads to increased snow and icemelt (Flanner et al., 2009). A precise description of CO and BC in climate models is important for simulating a realistic climate impact of pollution (Jacobson, 2001). Recent
20
studies indicate large discrepancies in BC mass between models and observations in the Arctic troposphere (Koch et al., 2009; Shindell and Faluvegi, 2009). It is therefore crucial to understand the seasonal variation of CO and BC and estimate the contribu-tions from source regions of pollution based on observacontribu-tions, as a basis for climate model evaluation.
25
The international program Polar Study using Aircraft, Remote Sensing, Surface Mea-surements and Models, of Climate, Chemistry, Aerosols, and Transport (POLARCAT)
ACPD
11, 5935–5983, 2011
Source contributions to NH CO and black carbon during spring
and summer 2008 S. Tilmes et al. Title Page Abstract Introduction Conclusions References Tables Figures J I J I Back Close
Full Screen / Esc
Printer-friendly Version Interactive Discussion Discussion P a per | Dis cussion P a per | Discussion P a per | Discussio n P a per
consisted of several concurrent field programs that were conducted in spring and sum-mer 2008 during the International Polar Year 2007–2008 (http://www.polarcat.no/). PO-LARCAT aircraft campaigns in 2008 were designed to better understand the factors driving current changes in Arctic atmospheric composition and climate (Jacob et al., 2010; Brock et al., 2010). Consequently, POLARCAT aircraft campaigns sampled for
5
the most part polluted airmasses and fire plumes in the high northern latitudes. The CO and BC contributions from different source regions to individual aircraft campaigns and single seasons have been discussed (e.g. Warneke et al., 2009; Fisher et al., 2010; Paris et al., 2009; de Villiers et al., 2010). However, single aircraft campaigns might not represent the airmass characteristics of the entire polar cap.
10
Here, we employ five POLARCAT aircraft campaigns that took place in spring and summer 2008, to quantify the CO and BC contribution of pollution by fires and anthro-pogenic emissions. These aircraft campaigns covered different regions of the Arctic and sampled the varying influence of pollution. In addition, we use observations from the Stratosphere-Troposphere Analyses of Regional Transport (START08) and the test
15
case of the HIAPER Pole-to-Pole Observation mission (preHIPPO) aircraft campaign. This campaign was designed to target exchange processes between Upper Tropo-sphere and Lower StratoTropo-sphere (UTLS) (Pan et al., 2010). The latter took place for the most part in mid-latitudes over North America during the same period as the PO-LARCAT campaigns and did not target any pollution plumes in the troposphere. The
20
extensions of these additional observations in lower latitudes complement results from high latitudes and give further insight into the CO contributions of anthropogenic and fire emissions in the entire NH.
We study the CO and BC contribution of different source regions in spring and sum-mer and for different periods and regions that are covered by aircraft data to get a good
25
representation of the entire polar region. CO and BC are tracers that are well suited to study the transport of airmasses reaching high latitudes from different parts of the world, because the lifetime of CO is at least 1–2 months and several days for BC (e.g. Paris et al., 2009). We used the global chemical transport model MOZART-4 (Emmons
ACPD
11, 5935–5983, 2011
Source contributions to NH CO and black carbon during spring
and summer 2008 S. Tilmes et al. Title Page Abstract Introduction Conclusions References Tables Figures J I J I Back Close
Full Screen / Esc
Printer-friendly Version Interactive Discussion Discussion P a per | Dis cussion P a per | Discussion P a per | Discussio n P a per |
et al., 2010) to quantify the influence of fire and anthropogenic emissions by tagging BC and CO emissions for different regions. We further use FLEXPART trajectories (Fuelberg et al., 2010) to identify the source region of observed airmasses. To esti-mate the range of uncertainty of simulated CO and BC, we compare the model results that are spatially and temporally interpolated to the flight tracks of the aircraft data. In
5
addition, we use retrievals of CO from the Measurements of Pollution In The Tropo-sphere (MOPITT) instrument on the Terra satellite (e.g., Deeter et al., 2010) to identify shortcomings of CO in the source regions of pollution for different periods of the aircraft campaigns. Finally, we calculate the contribution of CO and BC source regions for the entire NH and provide an overview of the seasonal and latitudinal varying importance
10
of anthropogenic and fire emissions in the NH using MOZART-4.
2 Aircraft campaigns April–July 2008 and MOPITT satellite data 2.1 Aircraft data
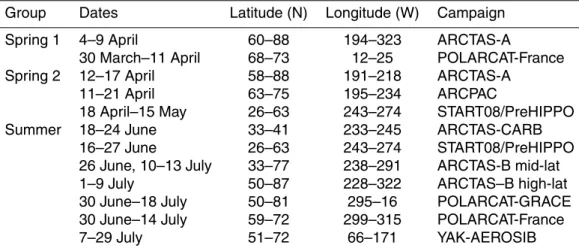
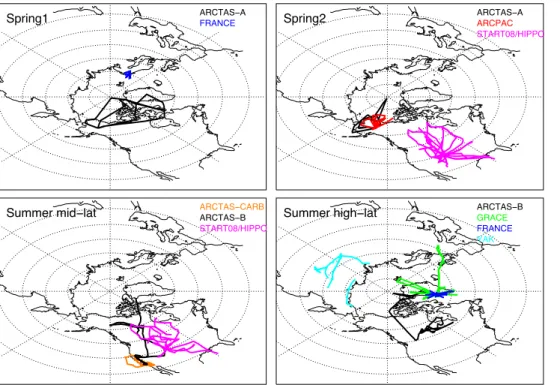
The aircraft missions used in this study are listed in Table 1. Some missions are divided into more than one time interval and cover different areas. The location of the flights
15
during the periods considered are shown in Fig. 1.
The NASA Arctic Research of the Composition of the Troposphere from Aircraft and Satellites (ARCTAS) mission (Jacob et al., 2010) was grouped into three parts, ARCTAS-A, ARCTAS-B and ARCTAS-CARB. Three research aircraft took part in this campaign with a slightly different target of each mission. Here, we use the CO and
20
BC data from the NASA DC-8 to study the transport from mid-latitudes to the Arc-tic. ARCTAS-A and ARCTAS-B targeted mid-latitude pollution layers transported to the Arctic and wildfire plumes, respectively. ARCTAS-CARB was focused on Califor-nia air quality targeting fresh fire plumes in northern CaliforCalifor-nia, as well as various anthropogenic sources (Huang et al., 2010; Pfister et al., 2011). We concentrate on
25
ACPD
11, 5935–5983, 2011
Source contributions to NH CO and black carbon during spring
and summer 2008 S. Tilmes et al. Title Page Abstract Introduction Conclusions References Tables Figures J I J I Back Close
Full Screen / Esc
Printer-friendly Version Interactive Discussion Discussion P a per | Dis cussion P a per | Discussion P a per | Discussio n P a per
do not include the transit flights between California and Alaska. We further separate ARCTAS-A flights into two periods. The first period (Spring1) includes data that were for the most part not influenced by Siberian fire emissions, whereas the second part (Spring2) is strongly influenced by fire emissions. ARCTAS-B is also split into two groups, one including flights that sample lower latitudes and a second including flights
5
that sample higher latitudes (see Table 1).
The NOAA ARCPAC (Aerosol, Radiation, and Cloud Processes affecting Arctic Cli-mate) mission was conducted in spring between the end of March and 21 April using the WP-3D aircraft. It was designed to understand the radiative impacts of anthro-pogenic pollution and biomass burning sources. The campaign was based in Fairbanks
10
and frequently targeted fire plumes that were transported from Siberia (e.g., Warneke et al., 2009; Brock et al., 2010). For ARCPAC we consider all flights starting on 11 April, which covered latitudes north of 63◦N.
The scientific objectives of POLARCAT-France and POLARCAT-GRACE (Greenland Aerosol and Chemistry Experiment) are similar to those of the ARCTAS and
ARC-15
PAC missions. However, these aircraft missions took place in Europe and Greenland. POLARCAT-France, using the French ATR-42 aircraft, was based in Kiruna, Sweden, in Spring, and took place between 30 March and 11 April (de Villiers et al., 2010). The summer mission was based in western Greenland in Kangerlussuaq and took place between end of June and mid-July. The POLARCAT-GRACE mission was conducted
20
during the same time (1–17 July), using the DLR Falcon research aircraft. BC was not measured during either campaign.
The YAK-AEROSIB (Airborne Extensive Regional Observations in Siberia) was con-ducted in July 2008 covering the area of North and Central Siberia and using an Antonov-30 research aircraft, operated by the Tomsk Institute of Atmospheric Optics
25
(Paris et al., 2008). This campaign was also performed in collaboration with the PO-LARCAT program (Paris et al., 2009). During the first part of the mission (7–12 July 2008), CO but no BC measurements are available, whereas during the second part (21–29 July) BC was observed in addition to CO and other species. During the second
ACPD
11, 5935–5983, 2011
Source contributions to NH CO and black carbon during spring
and summer 2008 S. Tilmes et al. Title Page Abstract Introduction Conclusions References Tables Figures J I J I Back Close
Full Screen / Esc
Printer-friendly Version Interactive Discussion Discussion P a per | Dis cussion P a per | Discussion P a per | Discussio n P a per |
part of the mission, a number of biomass burning plumes over Siberia were encoun-tered.
The NSF START08/preHIPPO aircraft campaign was conducted at the same time as the POLARCAT mission in spring and summer 2008 (Pan et al., 2010). This cam-paign was designed to target exchange processes between Upper Troposphere and
5
Lower Stratosphere (UTLS). The preHIPPO mission shared the START08 payload and focused on testing global observations of greenhouse gases. A wingtip-to-wingtip com-parison was made between the ARCTAS DC8 and NSF/NCAR Gulfstream V (GV) air-craft, showing agreement within the measurement uncertainties between the two CO measurements. BC was not measured during START08/preHIPPO.
10
A description of CO measurements for the POLARCAT missions, ARCTAS, ARC-PAC, POLARCAT-France, POLARCAT-GRACE and YAK-AEROSIB are given in Pom-mier et al. (2010). A brief description of CO measurements for the START08/Hippo campaign is given in Tilmes et al. (2010). Wingtip-to-wingtip comparisons were also made between NASA-DC8 DACOM CO, the NOAA WP-3D and DLR Falcon
Vac-15
uum UV fluorescence CO measurements within the International Consortium for At-mospheric Research on Transport and Transformation ICARTT (2010). Further, inter-comparisons between NSF-GV NCAR CO and the NASA-DC8 DACOM CO were per-formed, as well as between the DLR Falcon and the ATR-42 on 14 July 2008, above Greenland (Kleb et al., 2009). The CO measurements agree for different campaigns
20
within their range of uncertainty (between 2-5%).
BC was measured during ARCTAS on the NASA DC8, during ARCPAC on the NOAA P3 and during YAK-AEROSIB on the Antonov-30 aircraft. For both ARCTAS and AR-CPAC campaigns a Single Particle Soot Photometer (SP2) was used, which has been described elsewhere (Spackman et al., 2010; Schwarz et al., 2010; Moteki and Kondo,
25
2010; Kondo et al., 2010). Briefly, the SP2 uses an intense intracavity laser to heat the refractory carbon component of fine-mode aerosols to vaporization. Analysis of the thermal radiation emitted by the particle is used to determine the mass of the refractory component and to constrain its carbon composition. The instrument operated on the
ACPD
11, 5935–5983, 2011
Source contributions to NH CO and black carbon during spring
and summer 2008 S. Tilmes et al. Title Page Abstract Introduction Conclusions References Tables Figures J I J I Back Close
Full Screen / Esc
Printer-friendly Version Interactive Discussion Discussion P a per | Dis cussion P a per | Discussion P a per | Discussio n P a per
NOAA P3 detects BC cores in the size range of ≈90–600 nm volume equivalent diame-ter (VED, assuming a density of 2.0 g/cc) irrespective of BC mixing state or morphology with precision of 15% (Cross et al., 2010). The NOAA results were scaled by a factor of 1.1 to represent the total BC concentration in the accumulation mode.
The SP2 instrument on the NASA DC8 was operated by the University of Tokyo and
5
detected BC over a wider size range (≈80–860 nm) than that on the NOAA P3. The BC mass was calculated for full size range using a lognormal fit and was provided in units ng/m3. The estimated uncertainty is ≈10%.
During YAK-AEROSIB, equivalent black carbon (EBC) mass concentration was mea-sured using an aethalometer based on diffuse attenuation of light by particles after
col-10
lection on a filter (Panchenko et al., 2000; Paris et al., 2009). The wavelength ranges between 400 and 1100 nm with maximum near 900 nm. The instrument is sensitive to submicron particles. EBC mass concentration is calculated from light absorption as described in Paris et al. (2009). The sensitivity of the aethalometer is ≈10 ng/m3EBC. The SP2 measurements of BC mass loadings generally agreed to within stated
un-15
certainties during wingtip-to-wingtip intercomparisons between the NOAA and NASA aircraft (G. Chen, private communication, 2010). The Arctic vertical profiles from all the SP2 measurements are shown in the context of a measurement-model intercom-parison in Fig. 10 of Koch et al. (2009). In their study differences between the different campaigns are likely due to the different sampling of airmasses, as discussed below.
20
2.2 Source regions using FLEXPART trajectories
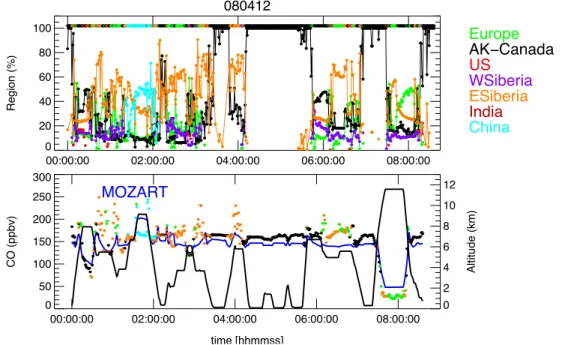
Backward trajectories from the FLEXPART model (Fuelberg et al., 2010) were used to identify the source region of ARCTAS-A and ARCTAS-B observations. We define the source of each single measurement to be the region where the 10-day back-trajectory remained for the longest time before it reached below 2 km of the ground. For
mea-25
surements at or below 2 km we considered the location of the back-trajectories for 5 days (see Fig. 2). The source region as defined here is often in agreement with the origin of the 10-day back-trajectories (as defined in the caption of Fig. 2). However,
ACPD
11, 5935–5983, 2011
Source contributions to NH CO and black carbon during spring
and summer 2008 S. Tilmes et al. Title Page Abstract Introduction Conclusions References Tables Figures J I J I Back Close
Full Screen / Esc
Printer-friendly Version Interactive Discussion Discussion P a per | Dis cussion P a per | Discussion P a per | Discussio n P a per |
differences occur, for example for those airmasses that originated in Europe but trav-eled for a few days over China or Siberia, where they experienced large contributions of anthropogenic or fire emissions. Using information of the source region of airmasses are helpful to analyze differences between model results and observations, and dis-crepancies can be assigned to airmasses that are influenced by pollution from specific
5
source regions. For example, MOZART-4 often underestimates high CO plumes with an origin in East Siberia, as shown in Fig. 2 (bottom panel).
2.3 MOPITT satellite data
MOPITT is a gas-filter correlation radiometer onboard the EOS Terra satellite and has provided observations since March 2000. V4 retrievals of CO profiles and total columns
10
are used in this study (Deeter et al., 2010). For evaluation of the model results, the MOPITT retrieval averaging kernels and a priori information are used to transform model CO profiles for comparison with MOPITT profiles, as described in Emmons et al. (2010).
2.4 The MOZART-4 model
15
The Model for Ozone and Related chemical Tracers, Version 4 (MOZART-4) was used to simulate the period between March and July 2008. MOZART-4 is an offline global chemical transport model (Emmons et al., 2010). We used dynamic fields from the National Centers for Environmental Prediction (NCEP) Global Forecast System (Kana-mitsu et al., 1991) to drive the model with a horizontal resolution of 1.4◦×1.4◦ and 64
20
layers up to 40 km. The model run was performed for the period March–July 2008, with a spin-up of the run starting in July 2007 at 2.8◦×2.8◦ resolution. The chemical mechanism describes the most important reactions in the troposphere including the representation of non-methane hydrocarbons, an online calculation of aerosols, and an online photolysis scheme (Emmons et al., 2010).
ACPD
11, 5935–5983, 2011
Source contributions to NH CO and black carbon during spring
and summer 2008 S. Tilmes et al. Title Page Abstract Introduction Conclusions References Tables Figures J I J I Back Close
Full Screen / Esc
Printer-friendly Version Interactive Discussion Discussion P a per | Dis cussion P a per | Discussion P a per | Discussio n P a per
Anthropogenic emissions were taken from the inventory compiled by Qiang Zhang and David G. Streets. This emission inventory it is built upon the INTEX-B inven-tory (Zhang et al., 2009) with additional data from other sources to make up NH emissions (see http://www.cgrer.uiowa.edu/arctas/emission.html for more information). Emissions of gases and particles from open burning were calculated using the Fire
IN-5
ventory from NCAR version 1; an emission framework method based on Wiedinmyer et al. (2006, 2010), using fire counts (MODIS Data Processing System) provided by the University of Maryland (e.g., Giglio and Descloitres, 2003) for the year 2008. Further details about the global fire emission inventory can be find in Wiedinmyer et al. (2010). Total CO in MOZART-4 can be divided into CO directly emitted from fire and
an-10
thropogenic emissions and the photochemically produced CO from the oxidation of methane and hydrocarbons. The contribution from methane oxidation (on average about 25% of total CO) is fairly uniform spatially and temporally, so is treated as back-ground. CO produced from hydrocarbons emitted from fire and anthropogenic sources are strongly correlated with the direct CO emissions from those sources. Therefore,
15
the contributions of different source regions to chemically produced CO are expected to scale similarly as the directly emitted CO. The CO tags in the simulation shown be-low are based on direct emissions and do not include chemically produced CO, but this does not change the partitioning of the total sources.
Global CO sources of both anthropogenic and fire emissions (summarized in Table 2)
20
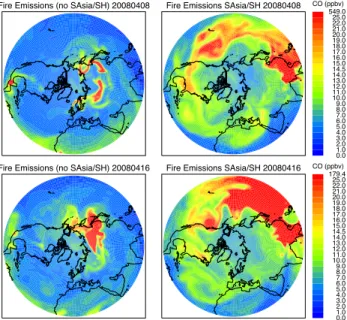
agree well, in general, with the results in Fisher et al. (2010). The largest differences are for anthropogenic emissions for Europe (3 Tg/month lower) and for the US (1.5 Tg/month greater). Fire emissions vary daily and have a large seasonal variability, as listed for April and July in Table 2. In comparison to previous years, the 2008 fire emissions from Siberia are relatively high in April but relatively low in summer (e.g.,
25
van der Werf et al., 2008).
Black carbon and organic carbon aerosols are emitted in a combination of hydropho-bic and hydrophilic forms (80% and 50% hydrophohydropho-bic, respectively) in MOZART-4. Hy-drophobic black carbon is chemically transformed into hydrophilic forms with a lifetime
ACPD
11, 5935–5983, 2011
Source contributions to NH CO and black carbon during spring
and summer 2008 S. Tilmes et al. Title Page Abstract Introduction Conclusions References Tables Figures J I J I Back Close
Full Screen / Esc
Printer-friendly Version Interactive Discussion Discussion P a per | Dis cussion P a per | Discussion P a per | Discussio n P a per |
of 1.6 days (as in Horowitz, 2006). In the simulation used here, fire emissions were injected at the surface. This approach might result in an underestimation of concen-trations at higher altitudes, since the strong convection that is possible during fires has not been included here (Val Martin et al., 2010). However, in MOZART-4 emissions are effectively transported out of the boundary layer and no significant differences occur
5
between this simulation and an approach where the fire emissions are injected evenly between the surface and 6 km, as also found in Pfister et al. (2005).
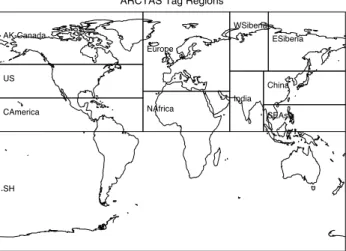
Besides the usual tropospheric species, 22 artificial CO and BC tracers were added to the simulation, describing the contribution of CO and BC from predefined source regions (Fig. 3). The region labeled “China” includes China, Korea and Japan, but the
10
majority of CO and BC emissions are from China. For each region two CO and BC tags were included, one describing fire emissions and the other describing anthropogenic emissions in each region. The tagging of CO and BC allows identification of source contributions to observed species.
To compare MOZART-4 to aircraft data, we interpolated the 6-h model output to the
15
flight tracks of one-minute aircraft observations for the POLARCAT campaigns and of one-second observations for the START08/preHIPPO campaign. Besides CO and BC, CO and BC tags are also sampled on the flight tracks for all aircraft data to analyze the contribution of different regions and emission types for both compounds.
3 Importance of CO and BC source regions for different aircraft campaigns
20
Aircraft campaigns during POLARCAT and START08/pre-HIPPO were conducted in different regions and periods, as described above. To determine model accuracy, we consider aircraft data during selected periods in spring and summer that are influenced by different pollution factors, as summarized in the following (see also Table 1).
ACPD
11, 5935–5983, 2011
Source contributions to NH CO and black carbon during spring
and summer 2008 S. Tilmes et al. Title Page Abstract Introduction Conclusions References Tables Figures J I J I Back Close
Full Screen / Esc
Printer-friendly Version Interactive Discussion Discussion P a per | Dis cussion P a per | Discussion P a per | Discussio n P a per
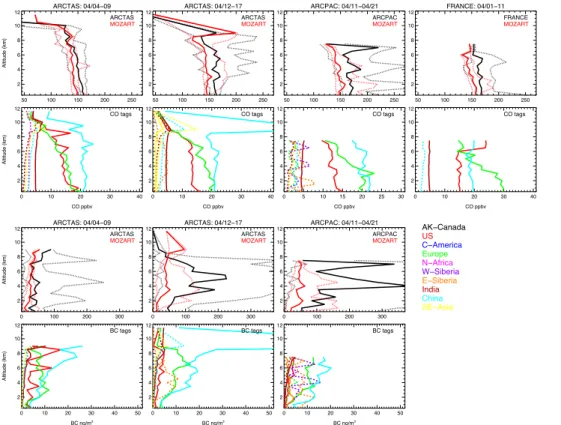
3.1 High latitudes Spring Campaigns: ARCTAS 4–9 April and POLARCAT-FRANCE 1–11 April 2008
Between 1 and 11 April, ARCTAS and POLARCAT-France aircraft observations sam-pled high northern latitudes. The western Arctic and Alaska were hardly influenced by fire emissions, as determined by the model, see for example one day in early April
5
(Fig. 4, top row). Agricultural fires in eastern Europe and west Siberia had started already by April (Warneke et al., 2009), however, by this time only very few plumes with high CO and BC values could be identified over North America using FLEXPART trajectories for ARCTAS (not shown). On the other hand, Siberian fire emissions show an influence in northern Europe (Fig. 4, top row left panel) in addition to a large impact
10
of anthropogenic emissions from Eastern Asia and Europe, as discussed in de Vil-liers et al. (2010) using POLARCAT-France observations. Also, East-Asian fire plumes are occasionally transported into high northern latitudes and contribute slightly to total CO (Fig. 4, top row, right panel). Depending on the location where measurements were taken, the importance of fire emissions in early April can vary greatly.
15
Since fire emissions are not a very important contributor for ARCTAS CO and BC measurements in early April (with less than 3 ppbv CO and 3 ng/m3BC below 6 km for single fire tags), a large part of the differences between model and observations at high latitudes in spring can be attributed to anthropogenic emissions (Fig. 5, first and fourth column). The median of simulated CO profiles during this period is ≈10% smaller than
20
observed. CO tags for ARCTAS show the largest contribution of anthropogenic emis-sions with source regions of China (more than 20 ppbv), followed by Europe and the US (≈15 ppbv). CO fire contributions are small, as described above. European CO contributions to the POLARCAT-France CO observations are larger at lower altitudes (up to 6 km) than those from China. Chinese anthropogenic CO contributions are
simi-25
lar to those calculated for the ARCTAS campaign. A large impact of US anthropogenic emissions (25 ppbv) is identified at altitudes above 6 km. A significant influence of Siberian fire emissions is not simulated by the model for areas investigated during
ACPD
11, 5935–5983, 2011
Source contributions to NH CO and black carbon during spring
and summer 2008 S. Tilmes et al. Title Page Abstract Introduction Conclusions References Tables Figures J I J I Back Close
Full Screen / Esc
Printer-friendly Version Interactive Discussion Discussion P a per | Dis cussion P a per | Discussion P a per | Discussio n P a per |
POLARCAT-France. Differences of more than 10% between modeled and observed CO median profiles for POLARCAT-France point to an additional underestimation of the model, either as a result of the impact of Siberian fire emissions in Northern Eu-rope or due to an additional underestimation of anthropogenic emissions coming from Europe in the beginning of April. An indicator for a reasonable simulation of the impact
5
of fire emissions is the good agreement of the 95th percentile of the CO distributions between model and observations.
The median of simulated BC is up to 25 ng/m3smaller in comparison to the ARCTAS aircraft observations (Fig. 5, first column, third and fourth row). A large underestima-tion of the model occurs for maximum BC values, which are ascribed to airmasses
10
influenced by biomass burning from Russia (Matsui et al., 2011). BC tags show the largest contribution of anthropogenic emissions from China at altitudes above 6 km. Interestingly, US anthropogenic CO shows maximum values between 2 and 8 km and has a similar vertical structure as the observed maximum BC peaks. CO contributions from Europe are dominant at altitudes below 5 km.
15
3.2 High latitudes Spring Campaigns: ARCTAS 12–17 April and ARCPAC
11–21 April 2008
During 11–21 April, high North American latitudes were strongly influenced by fire plumes coming from Siberia (see Fig. 5, second and third column). ARCPAC flight tracks were mostly concentrated over Alaska and the sea-ice north of Alaska, where
20
the influence of West-Siberian fire emissions was more pronounced than in the sam-pling region of ARCTAS-A. Anthropogenic CO contributions are 3–4 times larger than from fire emissions similar to the earlier period considered. The model results suggest that ARCTAS-A aircraft data are also strongly influenced by Southeast Asian fire emis-sions and anthropogenic emisemis-sions with a maximum in the upper troposphere around
25
9 km, in correlation to BC contributions from East-Siberian fires and anthropogenic emissions. The fire BC contribution from Siberia has the same magnitude as anthro-pogenic emissions from Europe between 2 and 5 km. At around 10 km, Indian fire and
ACPD
11, 5935–5983, 2011
Source contributions to NH CO and black carbon during spring
and summer 2008 S. Tilmes et al. Title Page Abstract Introduction Conclusions References Tables Figures J I J I Back Close
Full Screen / Esc
Printer-friendly Version Interactive Discussion Discussion P a per | Dis cussion P a per | Discussion P a per | Discussio n P a per
anthropogenic contributions are important as well.
A large discrepancy of ≈ 15% in CO between model and observations occurs for both aircraft campaigns. For the ARCPAC campaigns this difference is even larger. Since we assume an underestimation of the contribution of anthropogenic emissions of ≈ 10%, the additional difference between model and observations is ascribed to
5
an underestimation of the impact of fire emissions in high latitudes. BC profiles are greatly underestimated on average between 2 and 8 km and very high BC values are not simulated. Differences between model and observations are especially large for the ARCTAS campaign. Here, the model underestimates BC median values by more than 50% between 3 and 6 km. On the other hand, the model largely overestimates
10
BC above ≈8 km by about 1 order of magnitude, very likely due to an under-estimation of wet scavenging of BC in the model. Matsui et al. (2011) have shown that a smaller contribution of BC from Asian anthropogenic emissions compared to fire emissions in the Arctic is a result of different transport pathway and experience of precipitation of airmasses.
15
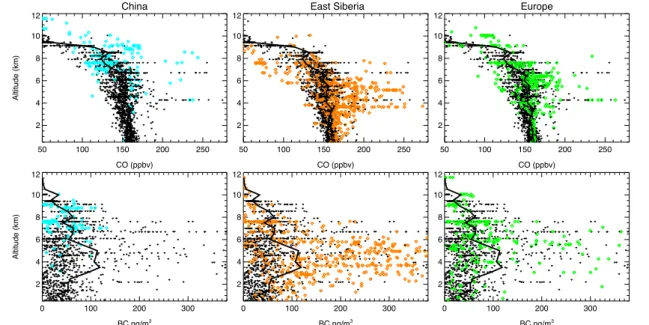
Using FLEXPART trajectories as described above, we identify measurements that sample airmasses with different origins and highlight them in Fig. 6, China (cyan, left column), Siberia (orange, middle column) and Europe (green, right column). Air-masses with the source region in Alaska and Canada are shown in black in all panels. ARCTAS CO and BC profiles show high CO mixing ratios at around 6 km coming from
20
East Siberia in this period (see Fig. 6, middle panel). Airmasses from Europe impact altitudes of 3–8 km for CO and BC (right panel). Further, the impact of CO emis-sions from China can be allocated to higher altitudes (around 8-10 km) as illustrated on the left. This result is consistent with studies by Paris et al. (2008), who observed enhancements of CO over Siberia due to Chinese emissions lofted by a cold front
25
in a warm conveyor belt in April 2006. Another YAK-AEROSIB campaign in spring 2010 also identified enhanced CO mixing ratios coming from China at altitudes above 4 km. The shape of the simulated CO median profiles is therefore similar to the one observed and attributed using the FLEXPART model, which points to a reasonable
ACPD
11, 5935–5983, 2011
Source contributions to NH CO and black carbon during spring
and summer 2008 S. Tilmes et al. Title Page Abstract Introduction Conclusions References Tables Figures J I J I Back Close
Full Screen / Esc
Printer-friendly Version Interactive Discussion Discussion P a per | Dis cussion P a per | Discussion P a per | Discussio n P a per |
altitude determination of the influence of fire emissions in MOZART-4, but an underes-timation of the magnitude.
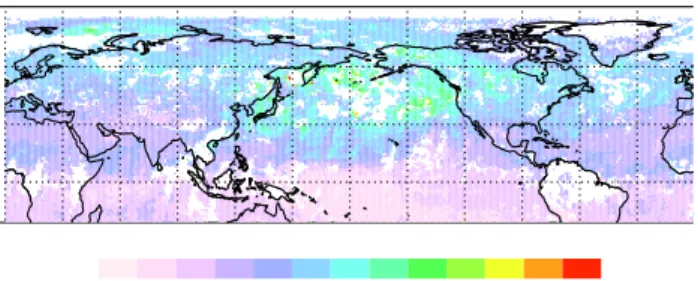
The underestimation of simulated CO at high latitudes is also present in the compar-ison of MOZART-4 to MOPITT satellite observations. A ten-day average of MOPITT satellite data over this period shows enhanced CO values in East Siberia and over the
5
Pacific Ocean at 400 hPa (≈6 km), reaching high latitudes (Fig. 7, top panel). Meteoro-logical conditions resulted in the transport of large amounts of pollution from Asia into high latitudes towards Alaska in spring 2008 (Fuelberg et al., 2010). Differences be-tween MOZART-4 and MOPITT show a significant underestimation of CO mixing ratios at 400 hPa by the model, especially over Alaska. This supports the findings from
air-10
craft observations that the influence of Siberian fire emissions over Alaska and Canada is underestimated in the model. On the other hand, Southeast Asian CO emissions are overestimated at 400 hPa (around 6 km), influencing mid-latitude CO values in North America (as further discussed below).
3.3 Summer Campaigns: ARCTAS-CARB, 18–24 June and ARCTAS B, 26 and
15
29 June, 10–13 July
The observations from ARCTAS-CARB campaign (sampled over California between 33 and 41◦N), are compared to the observations from those ARCTAS B flights that mainly sampled the mid-latitudes (between 33–70◦N). The MOZART-4 CO results show good agreement with the CO profiles sampled during the ARCTAS-CARB and ARCTAS-B
20
flights at mid-latitudes (Fig. 8). The highest observed CO mixing ratios in the free troposphere are not reproduced by the model, whereas surface CO mixing ratios are overestimated by MOZART-4. In general, the contribution of anthropogenic influence on the total CO that built up over the winter decreases in summer, due to higher OH concentrations and consequently shorter lifetime of CO (see Table 3). CO tags show
25
a large contribution of US anthropogenic emissions within the first 2 km above the surface. Above 2 km, anthropogenic emissions from China are dominant. Concen-trations from Indian anthropogenic emissions show almost the same magnitude as
ACPD
11, 5935–5983, 2011
Source contributions to NH CO and black carbon during spring
and summer 2008 S. Tilmes et al. Title Page Abstract Introduction Conclusions References Tables Figures J I J I Back Close
Full Screen / Esc
Printer-friendly Version Interactive Discussion Discussion P a per | Dis cussion P a per | Discussion P a per | Discussio n P a per
contributions from Europe and the US. ARCTAS-B mid-latitude aircraft data are more influenced by US and East-Siberian fire emissions than ARCTAS-CARB also at mid-latitudes. As for CO, BC is overestimated in MOZART-4 at altitudes below 2 km where the largest contributions come from US anthropogenic and fire emissions. The largest BC contribution at 3–4 km for ARCTAS-CARB is the influence of anthropogenic
emis-5
sions from our Central America region, which includes most of Mexico. Above 4 km, BC is overestimated by the model, likely a result of missing BC scavenging in higher altitudes that occurs during the wet season in China.
3.4 High Latitude Summer Campaigns: ARCTAS-B, GRACE, POLARCAT-France
and YAK-AEROSIB
10
At high latitudes in summer, ARCTAS-B CO median profiles are underestimated by up to 40 ppbv (Fig. 9). Maximum BC and CO mixing ratios are also strongly underesti-mated, especially below 4 km, suggesting the underestimation of the impact of Cana-dian fire emissions. POLARCAT GRACE and POLARCAT-France aircraft campaigns show better agreement between observations and model results, with differences of
15
±10–15 ppbv CO. POLARCAT GRACE median CO is overestimated by the model at altitudes below 6 km. On the other hand, the model underestimates CO above 6 km and maximum CO values of more than 150 ppbv are not reproduced. For YAK-AEROSIB, CO contributions are significantly overestimated by ≈20 ppbv at altitudes below 6 km, as discussed below.
20
As for the mid-latitudes, Chinese anthropogenic emissions show the largest frac-tion in the total amount during ARCTAS-B (Fig. 9, first column). With up to 10 ppbv CO, US and European anthropogenic emissions are as important as Chinese emis-sions for the campaigns that took place over Greenland and Europe (Fig. 9, third and fourth column). In all high latitude summer campaigns, East-Siberian fire
contribu-25
tions reach the magnitude of US and European anthropogenic emissions (≈5 ppbv). Similar to ARCTAS-CARB, BC concentrations for ARCTAS-B agree for low altitudes, where Canadian fires are important. In low altitudes, fresh fire plumes of Alaska and
ACPD
11, 5935–5983, 2011
Source contributions to NH CO and black carbon during spring
and summer 2008 S. Tilmes et al. Title Page Abstract Introduction Conclusions References Tables Figures J I J I Back Close
Full Screen / Esc
Printer-friendly Version Interactive Discussion Discussion P a per | Dis cussion P a per | Discussion P a per | Discussio n P a per |
Canadian fires contribute largely (up to 30 ppbv CO and 50 µg/m3 BC) to the amount of CO and BC.
FLEXPART trajectories calculated for each measurement of ARCTAS-B aircraft data (Fig. 10) indicate the contribution of large amounts of CO from East Siberia at altitudes around 8 km in summer high latitudes and from China around 10 km, in agreement
5
with simulated CO tags (shown in Fig. 9). As discussed above, BC values are very low above 5 km compared to the corresponding CO values. Wet scavenging likely results in the loss of BC coming from Asia and is therefore not correlated with the high CO mixing ratios. In summer, airmasses from Alaska and Canada show very large CO and BC values, especially at altitudes below 4 km. Enhanced airmasses from Alaska
10
and Canada are also identified in higher altitudes above 5 km, especially for CO (up to 220 ppbv). The underestimation of CO above 5 km by the model for the ARCTAS-B period is therefore, at least in part, the result of an underestimation of the impact of Canadian fire emissions on higher altitudes. This can be due to an underestimation of fire emissions or shortcomings in the model transport not bringing sufficient CO to
15
higher altitudes.
To further understand the large discrepancy between CO observations and model results in summer high latitudes, we compare the MOZART-4 results to MOPITT CO retrievals for the 800 and 400hPa level. A significant overestimation of Siberian fires at 800 hPa (see Fig. 12) is in agreement with the overestimation of CO mixing ratios
dur-20
ing the YAK-AEROSIB campaign, which samples fresh Siberian fires. At 400 hPa, large values of CO mixing ratios occur over the western Pacific Ocean. East-Siberian fire emissions are likely lofted up to the upper troposphere and transported over the Pacific Ocean towards high North American latitudes. The comparison between MOZART-4 and MOPITT also shows a large underestimation of North American surface emissions,
25
as well as an underestimation of CO mixing ratios at the 400 hPa altitude level. The CO differences of about 30% between MOZART-4 and the ARCTAS-B aircraft mea-surements in high northern latitudes are therefore an underestimation of North Amer-ican emissions in summer and likely an underestimation of the remote influence of
ACPD
11, 5935–5983, 2011
Source contributions to NH CO and black carbon during spring
and summer 2008 S. Tilmes et al. Title Page Abstract Introduction Conclusions References Tables Figures J I J I Back Close
Full Screen / Esc
Printer-friendly Version Interactive Discussion Discussion P a per | Dis cussion P a per | Discussion P a per | Discussio n P a per
East-Siberian fire emissions in the model simulation. This also influences CO concen-trations over Europe at higher altitudes. However, those differences between observa-tions and model results are much smaller in northern Europe than in North America.
3.5 Spring and summer mid latitudes: START08 16 April to 17 June 2008
The START08 aircraft campaign took place at latitudes ≈30–65◦N. This campaign did
5
not target anthropogenic pollution or forest fires, but provided a broad sampling of the troposphere. Median profiles of aircraft data and MOZART-4 results are in very good agreement for both seasons (Fig. 13). The model shows a large contribution of Chi-nese anthropogenic emissions followed by US and European emissions. At altitudes above 8 km, Indian emissions show the second largest anthropogenic contributions of
10
more than 5 ppbv. Further, fire emissions from China and India are most pronounced in high latitudes with a maximum of more than 10 ppbv for China and 7 ppbv for India around 8 km. CO concentrations from East-Siberian fires reach values up to 10 ppbv around 4 km. The good agreement between aircraft data and model results in spring can be in part a result of two compensating shortcomings of the model: the
overestima-15
tion of Asian fires and the underestimation of anthropogenic emission in mid-latitudes, as shown above in the comparison between MOPITT and MOZART-4. In summer, Chinese anthropogenic emissions are less important but are still much larger than fire emissions. Only East Siberian fire contributions are of the same magnitude as Euro-pean fire contributions.
20
4 Influence of CO and BC anthropogenic and fire emission for the entire NH
We use the MOZART-4 model to derive the contribution of fire and anthropogenic emissions of different source regions to the NH. Absolute and relative contributions of source regions were calculated using the simulated CO and BC tags for the de-fined regions, as shown in Fig. 3. Uncertainties between model and observations, as
ACPD
11, 5935–5983, 2011
Source contributions to NH CO and black carbon during spring
and summer 2008 S. Tilmes et al. Title Page Abstract Introduction Conclusions References Tables Figures J I J I Back Close
Full Screen / Esc
Printer-friendly Version Interactive Discussion Discussion P a per | Dis cussion P a per | Discussion P a per | Discussio n P a per |
discussed in Sect. 3 have to be kept in mind as a caveat. First, we discuss the altitude distribution of zonally averaged relative contributions of CO and BC for both anthro-pogenic and fire emissions for April and July (Figs. 14 and 15). Only the four regions with the largest CO and BC contributions are shown.
Anthropogenic pollution dominates CO mixing ratios from wildfire and agricultural
5
burning emissions in the entire NH. The largest fraction of CO pollution comes from China with up to 18% in April and 15% in July in high latitudes. The altitude distribution shows that emissions are lofted up to 12 km over China and get transported toward high latitudes, where they descend. This process occurs from the influence of the warm conveyor belts over China, as discussed above. CO contributions from Europe
10
and the US reach up to 16% and 12%, respectively. CO emissions are also transported towards high latitudes but stay at lower altitudes, which results in a maximum contri-bution between 0 and 4 km for these source regions. Indian anthropogenic emissions are stronger in summer than in spring, in contrast to those from China, Europe and the US. The high CO values at high altitudes (above 12 km) are very likely a result of the
15
Indian monsoon that occurs at around 30◦N. Some of those emissions are transported towards high latitudes and contribute (≈ 5%) to the entire CO abundance in the Arctic region.
The largest CO contributions from forest fires are denoted in Siberia and Southeast Asia during July and April, respectively. The impact of other fires on the total CO in
20
the zonal average can be neglected. In April, the strongest contribution of forest fires comes from China and Southeast Asia. However, only little CO contribution from China and East Asia is found in high latitudes at altitudes around 10 km. In spring, Siberian fires have a smaller percentage contribution to the total CO at the latitude of their source (around 40-50◦N) compared to summer, even though CO emissions are larger
25
in April compared to July (see Table 2). Due to the shorter lifetime of CO, anthropogenic emissions have reduced importance in summer compared to spring (see Table 3). In summer, the contribution of Siberian fires to high latitude pollution is very pronounced and almost reaches levels of anthropogenic pollution in summer at altitudes around
ACPD
11, 5935–5983, 2011
Source contributions to NH CO and black carbon during spring
and summer 2008 S. Tilmes et al. Title Page Abstract Introduction Conclusions References Tables Figures J I J I Back Close
Full Screen / Esc
Printer-friendly Version Interactive Discussion Discussion P a per | Dis cussion P a per | Discussion P a per | Discussio n P a per
6 km. In July, the relative contribution of East-Siberian fire emissions exceeds those from anthropogenic emissions coming from China.
The percentage anthropogenic contribution of BC is much larger than for CO, since BC is not photochemically produced, as is the case for CO. The altitude distributions of BC and CO are very similar. East-Siberian emissions show the strongest influence
5
in high latitudes between 0-8 km. As opposed to CO, the relative contribution of an-thropogenic emissions coming from all considered source regions increases between April and July. BC is not chemically destroyed but it is lost by washout, which is sea-sonally dependent. The lifetime of anthropogenic BC emissions therefore depends on the season.
10
The absolute and relative contribution of column CO and BC is summarized in Fig. 16. In spring, about half of the total CO is a result of photochemical produc-tion (hydrocarbon oxidaproduc-tion); in summer this is even more than half. The only source for BC is assumed to be surface emissions. Total emissions of BC maximize in mid-latitudes and strongly decrease towards high mid-latitudes. In spring, 70% of both CO
15
and BC contributions are from anthropogenic sources in mid and high latitudes. China shows the largest contribution for both CO and BC with ≈18%, followed by Europe and the US. In low latitudes (around 20◦N) in spring, fire emissions reach 40% for CO and 60% for BC. The main contributions are Chinese, Indian and Southeast Siberian fires. At 0–20◦N, North African emissions contribute significantly to the entire CO and
20
BC distributions. In high latitudes, the largest BC fire contributions are from Siberia, whereas other regions are equally important for the CO fire contributions. In summer, East-Siberian fires dominate the contribution of fire emissions in high latitudes, with up to 30% for CO and 20% for BC. Fire emissions in low latitudes (around 20◦N) are less important in July, whereas close to the equator the contribution of fire emissions of the
25
ACPD
11, 5935–5983, 2011
Source contributions to NH CO and black carbon during spring
and summer 2008 S. Tilmes et al. Title Page Abstract Introduction Conclusions References Tables Figures J I J I Back Close
Full Screen / Esc
Printer-friendly Version Interactive Discussion Discussion P a per | Dis cussion P a per | Discussion P a per | Discussio n P a per | 5 Conclusions
Aircraft observations from five POLARCAT aircraft campaigns and the START08/preHIPPO mid-latitude campaign were used to analyzed the contribu-tions of CO and BC anthropogenic and fire emissions in the NH using the MOZART-4 model. Depending on the sampling region of single campaigns considered, the
5
contributions of fire emissions varies significantly, whereas the contributions of anthro-pogenic emissions is rather similar. The comparison between aircraft observations and model results that are interpolated on the flight track allows the evaluation of the MOZART-4 model with regard to CO and BC contributions from different source regions. The performance of the simulated CO and BC in spring and summer is
10
summarized in the following:
– Since fire emissions did not significantly influence ARCTAS-A observations at
the beginning of April, the difference between model and CO observations of about 10% is concluded to be a result of an underrepresentation of anthropogenic emissions. An underestimation of anthropogenic emissions was also found in
15
Fisher et al. (2010) who used a similar inventory.
– During 11–21 April additional discrepancies between simulated and observed CO
and BC in high latitudes, as sampled by ARCTAS-A and ARCPAC, is a result of the underestimation of fire plumes coming from East Siberia. Further, POLARCAT-France observations show an underestimation of CO mixing ratios in Northern
20
Europe in the first part of April, which can be attributed to an underestimation of the remote influence of both fire and anthropogenic emissions. The sampling of model data on the flight tracks might not result in the same tracer characteristics as shown in the data, because observed pollution plumes might be slightly dis-placed and more strongly diluted in the model and flight track samples (Rastigejev
25
et al., 2010). In addition, MOPITT satellite data point to shortcomings in the trans-port of fire plumes towards high latitudes.
ACPD
11, 5935–5983, 2011
Source contributions to NH CO and black carbon during spring
and summer 2008 S. Tilmes et al. Title Page Abstract Introduction Conclusions References Tables Figures J I J I Back Close
Full Screen / Esc
Printer-friendly Version Interactive Discussion Discussion P a per | Dis cussion P a per | Discussion P a per | Discussio n P a per
– Mid-latitude CO mixing ratios over North America in spring are influenced by
Southeast-Asian fire plumes. The remote influence of East-Asian fire emissions were shown to be too large in the simulation compared to observations, whereas the impact of East-Siberian fire plumes are underestimated in spring. These com-pensating errors result, on average, in good agreement between observations and
5
MOZART-4 results.
– In summer high northern latitudes, the contribution of anthropogenic emissions
is in general less important for CO, due to the shorter lifetime of CO, whereas the amount of total fire emissions gain importance, especially in low- and mid-latitudes. Mid-latitude CO and BC mixing ratios agree well between model and
10
observations. At high latitudes, discrepancies between model and observations vary with region and altitude. Siberian fires are overestimated by the model, whereas North American emissions, especially Canadian fire emissions are un-derestimated. This results in an overestimation of CO for regions that are influ-enced by Siberian fires and an underestimation of regions that are influinflu-enced by
15
North American fire and anthropogenic pollution. BC is overestimated at altitudes above 6 km, partly due to an under-estimation of wet scavenging of BC during the rainy season in summer over Asia.
In summary, shortcomings of the model simulation occur due to uncertainties in-duced by transport errors in the model, e.g., problems in the transport of finescale fire
20
plumes to the Arctic, due to too much diffusion of a global model, as discussed in Pisso et al. (2009), but also due to uncertainties in emission inventories. This leads to the un-derestimation of CO in high latitudes, especially where fire plumes are important. Sim-ulated mid-latitude CO mixing ratios agree reasonably well with aircraft observations in spring and summer. Here, the underestimation of anthropogenic emissions is likely
25
compensated by an overestimation of South Asian fire emissions. Further, the anthro-pogenic amount of BC is reasonably well reproduced by the model in spring, whereas the impact of fires seems to be largely underestimated. MOZART-4 also overestimates
ACPD
11, 5935–5983, 2011
Source contributions to NH CO and black carbon during spring
and summer 2008 S. Tilmes et al. Title Page Abstract Introduction Conclusions References Tables Figures J I J I Back Close
Full Screen / Esc
Printer-friendly Version Interactive Discussion Discussion P a per | Dis cussion P a per | Discussion P a per | Discussio n P a per |
BC in spring and summer in the upper troposphere, likely as a result of too little wet scavenging of emissions coming from Asia (Matsui et al., 2011).
Contributions of fire emissions and differences between model and observations were shown to vary between different campaigns. Therefore, considering the results of single aircraft campaigns cannot be transferred to the global contributions of CO
5
and BC. We also provide an overview of zonally averaged contributions for different altitudes and latitudes in the NH. The largest contribution of CO and BC comes from Chinese anthropogenic emissions (≈18%) at high latitudes, followed by European and US emissions. The relative contributions of anthropogenic CO emissions decreases in summer high latitudes, whereas the BC contribution of anthropogenic emissions is
10
still around 70%. Chinese and Southeast Asian fires largely contribute to the pollution around 20◦N in spring, whereas Siberian fires show a contribution of up to 30% in sum-mer. BC fire contributions are larger in spring compared to CO but slightly smaller in summer. Different altitude intervals at high latitudes are influenced by different source emissions, depending on the transport pathways of polluted airmasses from different
15
regions.
The transport of CO and especially BC into high latitudes can have a significant impact on global radiation, mainly due to the deposition of BC on ice and snow. Further studies are necessary to explore the importance of mid-latitude pollution from different source regions on the Earth’s climate.
20
Acknowledgements. Thanks to Gabriele Pfister and Rebecca Hornbock for helpful comments. The POLARCAT-France project, including ATR-42 flights, were funded by French ANR, CNES, CNRS-INSU, IPEV and EUFAR. The YAK-AEROSIB campaigns were funded in France by the ANR Blanc POLARCAT, CNRS-DERCI, CNRS-INSU, the French Ministry of Foreign Affairs and CEA; in Russia by the RAS and RFBR; and by the Norwegian Research Council as part of 25
POLARCAT-Norway. The campaigns are operated in collaboration with IAO-SB-RAS, Tomsk, Russia. This work was supported by the NASA Tropospheric Chemistry Program under grant NNX08AD22G. The National Center for Atmospheric Research is funded by the National Sci-ence Foundation.
ACPD
11, 5935–5983, 2011
Source contributions to NH CO and black carbon during spring
and summer 2008 S. Tilmes et al. Title Page Abstract Introduction Conclusions References Tables Figures J I J I Back Close
Full Screen / Esc
Printer-friendly Version Interactive Discussion Discussion P a per | Dis cussion P a per | Discussion P a per | Discussio n P a per References
Brock, C. A., Cozic, J., Bahreini, R., Froyd, K. D., Middlebrook, A. M., McComiskey, A., Brioude, J., Cooper, O. R., Stohl, A., Aikin, K. C., de Gouw, J. A., Fahey, D. W., Ferrare, R. A., Gao, R.-S., Gore, W., Holloway, J. S., Hbler, G., Jefferson, A., Lack, D. A., Lance, S., Moore, R. H., Murphy, D. M., Nenes, A., Novelli, P. C., Nowak, J. B., Ogren, J. A., Peischl, J., Pierce, R. 5
B., Pilewskie, P., Quinn, P. K., Ryerson, T. B., Schmidt, K. S., Schwarz, J. P., Sodemann, H., Spackman, J. R., Stark, H., Thomson, D. S., Thornberry, T., Veres, P., Watts, L. A., Warneke, C., and Wollny, A. G.: Characteristics, sources, and transport of aerosols measured in spring 2008 during the aerosol, radiation, and cloud processes affecting Arctic climate (ARCPAC) project, Atmos. Chem. Phys. Discuss., 10, 27361–27434, doi:10.5194/acpd-10-27361-2010, 10
2010. 5939, 5941
Christensen, T., Knudsen, B. M., Streibel, M., Anderson, S. B., Benesova, A., Braathen, G., Davies, J., De Backer, H., Dier, H., Dorokhov, V., Gerding , M., Gil, M., Henchoz, B., Kelder, H., Kivi, R., Kyr ¨o, E., Litynska, Z., Moore, D., Peters, G., Skrivankova, P., St ¨ubi, R., Turunen, T., Vaughan, G., Viatte, P., Vik, A. F., von der Gathen, P., and Zaitcev, I.: Regional climate 15
projections, in: Climate change 2007: The physical science basis. contribution of working group I to the fourth assessment report of the Intergovernmental Panel on Climate Change, 2007. 5938
Clarke, A. and Noone, K. J.: Soot in the arctic snowpack: A cause for perturbations in radiative transfer, Atmos. Environ., 19, 2045–2053, 1985. 5938
20
Cross, E. S., Onasch, T. B., Ahern, A., Wrobel, W., Slowik, J. G., Olfert, J., Lack, D. A., Massoli, P., Cappa,C. D., Schwarz, J. P., Spackman, J. R., Fahey, D. W., Sedlacek, A., Trimborn, A., Jayne, J. T., Freedman, A., Williams, L. R., Ng, N. L., Mazzoleni, C., Dubey, M., Brem, B., Kok, G., Subramanian, R., Freitag, S., Clarke, A., t Thornhill, D., Marr, L., Kolb, C. E., Worsnop, D. R., and Davidovits, P.: Soot particle studies – instrument intercomparison – 25
project overview, Aerosol Sci. Technol., 44(8), 592–611 2010. 5943
Deeter, M. N., Edwards, D. P., Gille, J. C., Emmons, L. K., Francis, G., Ho, S.-P., Mao, D., Masters, D., Worden, H., Drummond, J. R., and Novelli P. C.: The MOPITT version 4 CO product: Algorithm enhancements, validation and long-term stability, J. Geophys. Res., 115, D07306, doi:10.1029/2009JD013005, 2010. 5940, 5944
30
de Villiers, R. A., Ancellet, G., Pelon, J., Quennehen, B., Schwarzenboeck, A., Gayet, J. F., and Law, K. S.: Airborne measurements of aerosol optical properties related to early
ACPD
11, 5935–5983, 2011
Source contributions to NH CO and black carbon during spring
and summer 2008 S. Tilmes et al. Title Page Abstract Introduction Conclusions References Tables Figures J I J I Back Close
Full Screen / Esc
Printer-friendly Version Interactive Discussion Discussion P a per | Dis cussion P a per | Discussion P a per | Discussio n P a per |
spring transport of mid-latitude sources into the Arctic, Atmos. Chem. Phys., 10, 5011–5030, doi:10.5194/acp-10-5011-2010, 2010. 5939, 5941, 5947
Emmons, L. K., Walters, S., Hess, P. G., Lamarque, J.-F., Pfister, G. G., Fillmore, D., Granier, C., Guenther, A., Kinnison, D., Laepple, T., Orlando, J., Tie, X., Tyndall, G., Wiedinmyer, C., Baughcum, S. L., and Kloster, S.: Description and evaluation of the Model for Ozone and 5
Related chemical Tracers, version 4 (MOZART-4), Geosci. Model Dev., 3, 43–67, 2010. 5939, 5944
Fisher, J. A., Jacob, D. J., Purdy, M. T., Kopacz, M., Le Sager, P., Carouge, C., Holmes, C. D., Yantosca, R. M., Batchelor, R. L., Strong, K., Diskin, G. S., Fuelberg, H. E., Holloway, J. S., Hyer, E. J., McMillan, W. W., Warner, J., Streets, D. G., Zhang, Q., Wang, Y., and Wu, 10
S.: Source attribution and interannual variability of Arctic pollution in spring constrained by aircraft (ARCTAS, ARCPAC) and satellite (AIRS) observations of carbon monoxide, Atmos. Chem. Phys., 10, 977–996, doi:10.5194/acp-10-977-2010, 2010. 5939, 5945, 5956
Flanner, M. G., Zender, C. S., Ramanathan, V., and Rasch, P. J.: Present day climate forcing and response from black carbon in snow, J. Geophys. Res., 112, 2481–2497, 2007. 5938 15
Flanner, M. G., Zender, C. S., Hess, P. G., Mahowald, N. M., Painter, T. H., Ramanathan, V., and Rasch, P. J.: Springtime warming and reduced snow cover from carbonaceous particles, Atmos. Chem. Phys., 9, 2481–2497, doi:10.5194/acp-9-2481-2009, 2009. 5938
Fuelberg, H. E., Harrigan, D. L., and Sessions, W.: A meteorological overview of the ARC-TAS 2008 mission, Atmos. Chem. Phys., 10, 817–842, doi:10.5194/acp-10-817-2010, 2010. 20
5940, 5943, 5950
Giglio, L. and Descloitres, J.: An enhanced contextual fire detection algorithm for modis, Re-mote Sens. Environ., 87(2–3), 273–282, 2003. 5945
Hansen, J. and Nazarenko, L.: Soot climate forcing via snow and ice albedos, Proc. Natl. Acad. Sci., 423–428, 2004. 5938
25
Horowitz, L. W.: Past, present, and future concentrations of tropospheric ozone and aerosols: Methodology, ozone evaluation, and sensitivity to aerosol wet removal, J. Geophys. Res., 111, D2211, doi:10.1029/2005JD006937, 2006. 5946
Huang, M., Carmichael, G. R., Adhikary, B., Spak, S. N., Kulkarni, S., Cheng, Y. F., Wei, C., Tang, Y., Parrish, D. D., Oltmans, S. J., D’Allura, A., Kaduwela, A., Cai, C., Weinheimer, A. J., 30
Wong, M., Pierce, R. B., Al-Saadi, J. A., Streets, D. G., and Zhang, Q.: Impacts of transported background ozone on California air quality during the ARCTAS-CARB period – a multi-scale modeling study, Atmos. Chem. Phys., 10, 6947–6968, doi:10.5194/acp-10-6947-2010, 2010.
ACPD
11, 5935–5983, 2011
Source contributions to NH CO and black carbon during spring
and summer 2008 S. Tilmes et al. Title Page Abstract Introduction Conclusions References Tables Figures J I J I Back Close
Full Screen / Esc
Printer-friendly Version Interactive Discussion Discussion P a per | Dis cussion P a per | Discussion P a per | Discussio n P a per 5940
ICARTT: Icartt field campaign observation assessment report, Tech. rep., National Aeronautics and Space Administration (NASA), http://www-air.larc.nasa.gov/TAbMEP.html, 2010. 5942 Jacob, D. J., Crawford, J. H., Maring, H., Clarke, A. D., Dibb, J. E., Emmons, L. K., Ferrare, R.
A., Hostetler, C. A., Russell, P. B., Singh, H. B., Thompson, A. M., Shaw, G. E., McCauley, 5
E., Pederson, J. R., and Fisher, J. A.: The Arctic Research of the Composition of the Tropo-sphere from Aircraft and Satellites (ARCTAS) mission: design, execution, and first results, Atmos. Chem. Phys., 10, 5191–5212, doi:10.5194/acp-10-5191-2010, 2010. 5939, 5940 Jacobson, M. Z.: Strong radiative heating due to the mixing state of black carbon in atmospheric
aerosols, Nature, 409, 695–697, 2001. 5938 10
Kanamitsu, M., Alpert, J. C., Campana, K. A., Caplan, P. M., Deaven, D. G., Iredell, M., Katz, B., Pan, H.-L., and White, G. H.: Recent changes implemented into the global forecast system at NMC, Weather Forecast., 1145–1160, 1991. 5944
Kleb, M. M., Chen, G., Belli, K., Crawford, J. H., and Rowell, A. F.: Overview of polarcat in-tercomparisons, AGU conference presentation, December 2009, http://adsabs.harvard.edu/ 15
/abs/2009AGUFM.A43A0187K, 2009. 5942
Koch, D. and Del Genio, A. D.: Black carbon semi-direct effects on cloud cover: review and synthesis, Atmos. Chem. Phys., 10, 7685–7696, doi:10.5194/acp-10-7685-2010, 2010. 5938 Koch, D., Schulz, M., Kinne, S., McNaughton, C., Spackman, J. R., Balkanski, Y., Bauer, S., Berntsen, T., Bond, T. C., Boucher, O., Chin, M., Clarke, A., De Luca, N., Dentener, F., Diehl, 20
T., Dubovik, O., Easter, R., Fahey, D. W., Feichter, J., Fillmore, D., Freitag, S., Ghan, S., Ginoux, P., Gong, S., Horowitz, L., Iversen, T., Kirkev ˚ag, A., Klimont, Z., Kondo, Y., Krol, M., Liu, X., Miller, R., Montanaro, V., Moteki, N., Myhre, G., Penner, J. E., Perlwitz, J., Pitari, G., Reddy, S., Sahu, L., Sakamoto, H., Schuster, G., Schwarz, J. P., Seland, Ø., Stier, P., Takegawa, N., Takemura, T., Textor, C., van Aardenne, J. A., and Zhao, Y.: Evaluation of 25
black carbon estimations in global aerosol models, Atmos. Chem. Phys., 9, 9001–9026, doi:10.5194/acp-9-9001-2009, 2009. 5938, 5943
Kondo, Y., Matsui, H., Moteki, N., Sahu, L., Takegawa, N., Zhao, Y., Cubison, J., Jimenez, J. L., Vay, S., Diskin, G. S., Anderson, B., Wisthaler, A., Mikoviny, T., Fuelberg, H. E., Blake, D. R., Huey, G., Weinheimer, A. J., Knapp, D. J., and Brunell, H.: Emissions of black carbon, 30
organic, and inorganic aerosols from biomass burning in North America and Asia in 2008, J. Geophys. Res., submitted, 2010. 5942