HAL Id: hal-01358351
https://hal.sorbonne-universite.fr/hal-01358351
Submitted on 31 Aug 2016
HAL is a multi-disciplinary open access
archive for the deposit and dissemination of
sci-entific research documents, whether they are
pub-lished or not. The documents may come from
teaching and research institutions in France or
abroad, or from public or private research centers.
L’archive ouverte pluridisciplinaire HAL, est
destinée au dépôt et à la diffusion de documents
scientifiques de niveau recherche, publiés ou non,
émanant des établissements d’enseignement et de
recherche français ou étrangers, des laboratoires
publics ou privés.
Polymorphism in nanoparticle-based crystals depending
upon their single or polycrystalline character
Nicolas Goubet, P.A. Albouy, A. Thompson, M.P. Pileni
To cite this version:
Nicolas Goubet, P.A. Albouy, A. Thompson, M.P. Pileni. Polymorphism in nanoparticle-based crystals
depending upon their single or polycrystalline character. CrystEngComm, Royal Society of Chemistry,
2016, 18 (33), pp.6166-6175. �10.1039/C6CE01006G�. �hal-01358351�
ARTICLE
J. Name., 2013, 00, 1-3 | 1
a.
Sorbonne Universités, UPMC Univ Paris 06, CNRS, UMR 8233, MONARIS, F-75005, Paris, France. E-mail: [email protected]
b.Laboratoire de Physique des Solides, CNRS, Univ. Sud, Université
Paris-Saclay, 91405 Orsay Cedex, France
c.
Synchrotron SOLEIL, L’Orme des Merisiers, Saint Aubin B.P. 48, 91192 Gif-sur-Yvette, France
d.CEA/IRAMIS, CEA Saclay, 91191 Gif-sur-Yvette, France
† Electronic Supplementary Information (ESI) available. See DOI: 10.1039/x0xx00000x
www.rsc.org/
Polymorphism in nanoparticle-based crystals depending upon
their single or polycrystalline character
N. Goubet,a* P. A. Albouy,b A. Thompsonc and M. P. Pilenia,d
Colloidal single-crystals with submillimeter size (colloidal crystal) are built by self-assembly of gold nanoparticles with nearly similar size (ca.5nm) but different nanocrystallinities. The external shape of the gold nanoparticles was characterized by electron microscopy and related to their nanocrystallinity. A synchrotron-based experiment is used to collect X-ray diffraction patterns from individual single-crystals over the wide q-range relevant to both inter-atomic and inter-particles periodicities. This makes possible a detailed reconstruction of the reciprocal space including diffuse scattering. X-ray diffraction demonstrates that colloidal crystals made of single-crystal nanoparticles belong to the body-centered cubic system while face-body-centered cubic single crystals are observed in case of self-assembly by polycrystalline particles; a remarkable feature is the preferential orientation of the symmetry axes of the single-crystal nanoparticles along those of the colloidal crystal; on the contrary polycrystalline nanoparticles display random orientation. These results show the importance of the nanocrystallinity for the packing behavior.
Introduction
There is no doubt that the research on nanoparticle (NPs) self-assembly is coming to a new stage with the challenge of the growth of single-crystals of NPs large enough to allow easy manipulation. This step is determinant as the precise knowledge of the structure and symmetries of these objects open the door to a deeper study of their physical properties.1–7 Indeed the arrangement of NPs coated with organic ligands give rise to a new class of functional materials where specific properties, different from those of the NP or of the corresponding bulk phase, can be expected.8–11 It must be insisted that these single-crystals are periodic crystals as defined by the IUCr12 and need to be distinguished from the recently introduced notion of a mesocrystal, where orientational order, and not translational order, is essential.13–
15
We shall keep to the term “colloidal crystal” instead of “superlattice” to designate them, albeit this last is often found in the literature; however it has a specific and quite different meaning in crystallography. A challenge for the development of technologies based on these materials is to achieve a precise control of the self-assembly process. The presence of the translational order expands the variety and complexity of the mesoscopic structures made of one or multiple
components.16–25 In case of spherical NPs with low size dispersion, face-centered (fcc) or body-centered cubic (bcc) lattices are most often observed. Hexagonal close packing (hcp) is more seldom reported although the difference in free energy compared to fcc is not expected to be large.26–28 On the other hand, the free energy balance between fcc and bcc structures is mainly controlled by the gold volume fraction ΦAu
and the ratio χ between the ligand length and the radius of the inorganic core.29,30 It is generally accepted that for a given ΦAu
value, the bcc structure is favored above some threshold for χ. Below this threshold, the NPs are assimilated to hard spheres with short-range interactions that self-assemble into the denser fcc packing. However, several studies report the unexpected observation of the bcc structure. Choi et al. have reported that oxidized PbS NPs with anisotropic ligand coverage self-assemble into the bcc structure, whereas PbS NPs with an isotropic coating pack on a fcc lattice.31 Solvation processing of the ligand shell have shown to be a good way for the control of the bcc/fcc polymorphism control in assemblies of PbSe NPs.32 Inclusion of either extra organic molecules or ligand excess can also induce the fcc to bcc transition in PbSe or Au NPs colloidal crystals.33,34 These emerging parameters have thus to be taken into account. Following the same rationale, the involvement of orientational ordering between NPs in colloidal crystals, as encountered in mesocrystals, is still unclear. Indeed, contrary to semiconductors, Au NPs can be grown as single or polycrystals due to the easy generation of planar defects; well-ordered colloidal crystals can be grown by self-assembly in both cases.
In this paper, we elaborate sub-millimeter colloidal single-crystals by self-assembling either gold truncated octahedral single-crystal NPs (thereafter denominated nanocrystals, NCs)
ARTICLE Journal Name
2 | J. Name., 2012, 00, 1-3
or polycrystalline decahedral and icosahedral NPs also known as Multiply Twinned Particles (MTP).35 Their average size is ca. 5nm in both cases. The high X-ray scattering power of gold atoms combined with the brilliance of synchrotron sources allowed the acquisition of high-quality diffraction patterns from individual colloidal single-crystals. To the best of our knowledge, only a few studies are reported based on such a technique, mainly due to difficulties in growing and handling large and isolated samples.36–38 It is thus possible to reconstruct in great detail a large portion of the reciprocal space associated with these objects. This approach allows to access important structural details as, for instance, intrinsic disorder, that are hard to reveal when samples are under the form of a crystalline powder as usually reported.18–20,32,39 This is presently exemplified by the observation of diffuse scattering outside the Bragg reflections.
Experimental
Materialschlorotriphenylphosphine gold (I) and tert-butylamine borane were obtained from STEM chemicals. Dodecanethiol, ethanol were obtained from Sigma–Aldrich Chemical Co. Toluene (98%) from Riedel de Haen. Ethanol (99.8%) from Prolabo. All reagents were used as received without further purification. Synthesis of 5,2 nm gold nanocrystals
The gold nanocrystal were synthesized by revisiting a method from the Stucky’s groups.40 The solution of gold precursor is made with 124 mg of chlorotriphenylphosphine gold (I) dissolved in 25 mL of toluene with 500µL of dodecanethiol. The reducing solution is made of 330 mg of tert-butylamine borane complex dissolved in 5 mL of toluene. The two solutions are heated up to 100°C in a silicone oil bath. The tert-butylamine borane solution is then quickly added to the gold precursor solution. The solution changes from colorless to dark red. After 5 minutes of reaction, the solution is let to cool down to room temperature. After evaporation of the solution, the gold nanocrystals are then washed with ethanol and redispersed in toluene. The resulting colloidal solution consists in a mixture of single crystals and polycrystals as shown in Fig. S1.
Formation of colloidal crystals with gold single crystals Ethanol (3% v/v) is added to the washed colloidal solution at [Au]=2.5 10-6 M and 500µL are poured into a NMR tube with a glass capillary inside. In order to prevent toluene evaporation, the NMR tube is confined inside a larger tube with toluene at the bottom. After one week, some shinny reflections can be seen on the glass wall of the NMR tube that reveals presence of micrometric crystals.
Fig. 1 (a) View of a colloidal crystal made of crystal gold nanoparticles (typeI), (b) View of a colloidal single-crystal made of polysingle-crystalline gold nanoparticles (typeII). Formation of colloidal crystals with gold polycrystals
The remaining colloidal solution is poured into a new NMR tube and confined in a larger tube with 2 mL ethanol at the bottom. The solution is let to destabilize for one week. The solution becomes colorless and shinny reflections appear on the wall of the tube and capillary.
Results and discussion
The colloidal crystals are obtained by self-assembly of gold NPs coated with dodecanethiol; these NPs are synthesized by
degradation of the organometallic precursor
triphenylphosphine gold (I) in toluene.40 The as-synthesized NPs reveal a size distribution below 5% that is mandatory for the observation of 3D long-range order. However, their single or polycrystalline character could not be controlled using synthesis parameters and dark field pictures reveal a mixture of both types (see ESI). They were separated using the crystallinity segregation already reported in previous works.39,41 However, contrary to these previous work, the NPs are too small to induce a spontaneous self-assembly at room temperature.42 Consequently, the NPs mixture is redispersed into toluene and a first crystallization process is induced by
Journal Name ARTICLE
J. Name., 2013, 00, 1-3 | 3
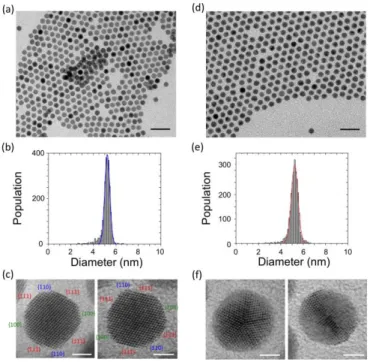
Fig. 2 (a and d) Low magnification TEM images (scale are 20 nm), (b and e) diameter distribution and (c and f) HRTEM images for particles obtained after dissolution of a colloidal crystal into a solvent and drop deposition on a carbon grid (scale bar are 2 nm). Images a and c (resp. d and f) correspond to particles obtained after dissolution of a few colloidal crystals of the first (resp. second) type.
adding a small amount of bad solvent (ethanol) to the solution (see Experimental Section). Solution evaporation is prevented by placing the solution in an enclosure saturated with toluene vapor. Addition of a polar solvent is preferred to induce ordered self-assembly compare to lowering the temperature, which may prevent crystallization as reported elsewhere.42 After one week, the solution remains red-colored but shiny reflections can be seen on the glass walls and at the bottom of the tube. This is indicative for the growth of large NPs-based single-crystals (hereafter denominated type I colloidal crystals) as confirmed by the optical micrograph displayed in ESI. The
solution with remaining free NPs is poured into another tube and placed in an enclosure saturated with ethanol vapor. The slow (one week) diffusion of this bad solvent into the colloidal solution induces NPs precipitation. The process is made visible by the progressive discoloration of the solution that starts from the top and propagates to the bottom, while some shiny reflections become visible at the bottom and on the glass wall. These last colloidal crystals are denominated type II.
SEM pictures of the as-grown colloidal crystals show that their shape is mostly distorted octahedron for both types (Fig. 1-a and b). Their average size is 50 µm in the longer dimension, which makes their manipulation and isolation possible; twinned or aggregated samples could be eliminated by visual inspection.
The size and single or polycrystalline character for NPs present in each type was assessed by HRTEM. For this purpose colloidal crystals of the same type are dissolved into a good solvent (chloroform) before deposition on a grid. Typical TEM images of the NPs obtained from type I (Fig. 2-a and b) and type II (Fig. 2-d and e) show an average diameter of 5.2 ± 0.2 nm and 5.2 ± 0.4 nm, respectively. A statistical analysis of the HRTEM pictures demonstrates that NPs recovered from type I samples are essentially single-crystals (NCs); their shape is close to a truncated octahedron. Fig. 2-c shows [110]NC
projections of two gold NCs with larger {111}NC facets
compared to the {100}NC ones. Small additional {110}NC facets
are also often distinguishable. On the contrary NPs associated to type II are polycrystalline, mainly in the form of icosahedron and decahedron. Twins are clearly observable in their internal structure (Fig. 2-f).
It is well-known that the periodic location of Bragg reflections in the reciprocal space reflects the 3D-periodicity of the crystal in the real space. In the present case, two levels of periodicities can be distinguished: at a sub-nanometer level, the periodicity associated to the packing of the gold atoms within the NP and at a nanometer level, the periodicity associated to the NPs packing into the colloidal crystal. Both
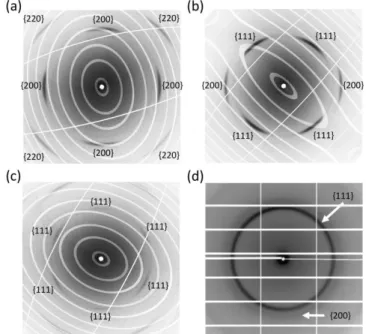
Fig. 3. Reconstruction of the reciprocal planes of equation l = 0 (a), h+k = 0 (b) and h+k+l = 0 (c) in the smaller q-value zone (qmax =
7 nm-1) for a colloidal crystal grown from single-crystal gold nanoparticles (type I). The planes are reconstructed based on 720 diffractions patterns obtained in the rotating crystal geometry.
ARTICLE Journal Name
4 | J. Name., 2012, 00, 1-3
Fig. 4 Reconstruction of the reciprocal planes of equation l = 0 (a), h+k = 0 (b) and h+k+l = 0 (c) in the smaller q-value zone (qmax =
7 nm-1) for a colloidal crystal grown from polycrystalline gold nanoparticles (type II). The planes are reconstructed based on 720 diffractions patterns obtained in the rotating crystal geometry.
levels could be observed using the protein crystallography beamline PROXIMA1 of the synchrotron facility SOLEIL. Samples were glued at the tip of a glass capillary by a small amount of silicon grease and placed on the φ-rotation stage of the goniometer. 720 diffraction patterns were taken every 0.5° with an exposure time of 1s per frame. In order to access to both levels of periodicities, the measure was repeated for two different sample-to-detector distances and wavelengths without changing the crystal orientation: 850mm and 0.1042nm for the detection of smaller scattering vectors, and 196mm and 0.0867nm for larger ones. The choice of wavelengths is dictated by the necessity of minimizing fluorescence and absorption effects. A common orientation matrix can thus be used for both sets of data. This last is determined by the software CrysAlisPro43 based on the reflections associated to the colloidal crystal periodicities. The subsequent reconstruction of the reciprocal space and data reduction are performed with the same software.
Data relevant to the NPs packing are discussed first. We show representative reconstructed reciprocal planes in Fig. 3 and 4 for type I and II respectively: the large numbers of well-defined Bragg reflections (50 to 100) is a sign for the good quality of both types of colloidal crystals. The ellipses and straight lines originate from the inactive inter-chips zones of the Pilatus 6M detector and of the beam-stop holder. The indexation of the Bragg reflections indicates that both colloidal crystals belong to the cubic system. Condition for reflection is h+k+l = 2n for type I, that points to a bcc direct lattice (fcc reciprocal lattice). Conversely condition for reflection in type II is similar parity for
h, k, l indices: this means that the direct lattice is fcc (bcc
reciprocal lattice). Apparently forbidden reflections visible in Fig. 4-c (white hexagons) are in fact diffuse scattering features that are discussed below.
Three samples of type I with better quality were selected for data analysis; they have very similar cubic parameters with an average value a = 8.02 ± 0.05nm. The two samples of type II with better quality that have been selected display somehow
different cubic parameters, 9.79nm and 10.45nm; it is shown below to correlate with slightly different NP size. Diffraction features associated to the NP inner structure are observed at larger scattering vectors and discussed below (see Fig. 5). The case of type I samples is first discussed. Patterns in Fig. 5-a,b and c correspond to planar cuts of the reciprocal space perpendicular to three relevant symmetry axis from the colloidal crystal: four-fold [001]CC axis (a), two-fold [110]CC axis
(b) and three-fold [111]CC axis (c). The positions of the larger
angle diffraction lines are accounted for by the expected fcc unit cell of atomic gold with a cubic parameter of 0.409nm, very close to the bulk value (0.408nm); their indexation is noted in Fig. 5-a,b and c. A remarkable feature is the arcing of
Fig. 5 Reconstruction of the reciprocal planes of equation l = 0 (a), h+k = 0 (b) and h+k+l = 0 (c) in the larger q-value zone (qmax
= 42 nm-1) for a type I (a, b and c) and type II (d) colloidal single-crystal. The planes are reconstructed based on 720 diffractions patterns obtained in the rotating crystal geometry.
Journal Name ARTICLE
J. Name., 2013, 00, 1-3 | 5
the lines that indicates a strong preferential orientation of NCs. Indeed the arc centers in Fig. 5-a, b are located at the positions expected for the Bragg reflections of a hypothetical nanocrystal with crystallographic axes exactly parallel to those of the colloidal crystal. It means that the NCs crystallographic axes are in average parallel to those of the colloidal crystal. More quantitatively the angular intensity distribution along the arcs can be adjusted by a Gaussian function with half-width at half-maximum 10°. It is to notice that only reflections of the family {220}NC are expected for the plane of equation
h+k+l = 0 represented in Fig. 5-c. Indeed the diffraction range
presently covered is not sufficient to observe them completely. The weak {111}NC reflections that are present on
the diffraction pattern are contamination by the {111}NC
reflections located on the upper and lower planes of equation
h+k+l = ±1. A similar observation of common shared
orientation has been previously reported in the case of a few layers of PbS NCs on the basis of electron diffraction.33 Unexpectedly, the colloidal crystals type I are distorted octahedra ({111}CC facets), which is not the more stable crystal
habit for a bcc lattice (rhombic dodecahedron with {110} facets).44 However, the co-axial alignment between NCs and colloidal crystals makes favorable the stabilization of colloidal crystal facets made with the larger NC facets, i.e. {111}NC
facets. A close examination of the {111}NC diffraction line in Fig.
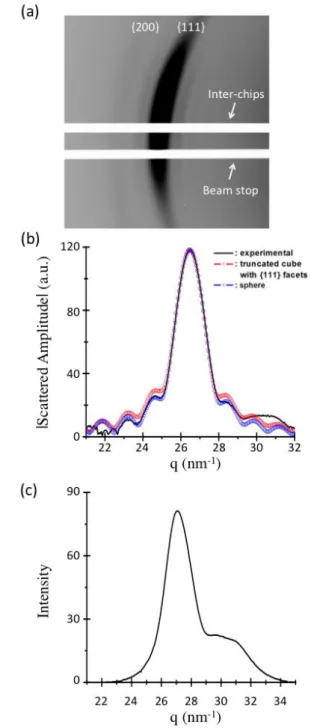
6-a further reveals well-defined secondary maxima; their observation is made possible by the very low NC size dispersion within the colloidal crystal. They are clearly distinguished in the radial scan plotted in Fig. 6-b. Fitting the line profile gives valuable information on the shape and size of the NCs. Based on HRTEM images, a NC is first modelled by a cube originally containing N3 fcc unit cells and subsequently truncated so as to grow symmetric {111}NC facets. For this
purpose, nodes of coordinates (u,v,w) such that ±𝑢 ± 𝑣 ± 𝑤 > 𝑚 are removed; particular values are 𝑚 = 𝑁 for cuboctahedron, 𝑚 = 3𝑁/4 for truncated octahedron and 𝑚 = 𝑁/2 for an octahedron. As noticed above, the statistical misorientation of NCs crystallographic axis with respect to those of the host colloidal crystal may be represented by a 2D-Gaussian function with half-width at half-maximum 10°; the Box- Muller method is most convenient to create orientations that follow this type of statistics.45 Both levels of periodicities are incommensurate and the amplitudes scattered by the NCs present no phase relation at large angles; in these conditions the intensities corresponding to the accessible NC orientations simply add. The atomic scattering factor of gold is taken from the International Tables for Crystallography.46 A satisfying adjustment in terms of main peak width and secondary maxima positions is obtained for 𝑁 = 11 and 𝑚 = 9.5 (4116 gold atoms; see Fig. 6-b, red curve). In that case the{100}NC and
{111}NC facets are very similar: 4.5nm. This added to the
frequent observation by HRTEM of {110}NC additional facets
points to an average nearly spherical shape for the NC. Spherical truncations of the original cube were thus tried byrejecting nodes with coordinates that satisfy 𝑢2+ 𝑣2+ 𝑤2> 𝑛. A better overall agreement compared to the
truncated cube is indeed found for 𝑛 = 40 that corresponds to a sphere
Fig. 6 (a) Oscillations surrounding an enhancement in the 111 Debye-Scherrer ring of a type I colloidal crystal. (b) Adjustment for the radial intensity profile by different particle shapes. For the sake of clarity the square root of the intensity is plotted in ordinate.
radius of 2.59 nm containing 4196 gold atoms (see Fig. 6-b, blue curve). The number of gold atoms within the NC is actually quite similar for both shapes.
We now turn to the case of type II colloidal crystals composed of multiply twinned particles (MTP). We see in Fig. 5-d that the diffraction lines are now homogeneous which indicates a perfectly random orientation of the coherent domains; the corresponding radial scan for the scattered intensity is shown
ARTICLE Journal Name
6 | J. Name., 2012, 00, 1-3
in Fig. 6-c. In order to determine the location and breadth of the main peak and of the shoulder, the profile has been adjusted by two Gaussian functions. The location of the main peak at 26.93nm-1 and corresponds to a cubic parameter 0.404nm for a (111)NP assignation. The broadening and shift
towards smaller angles for the (200)NP diffraction line is typical
for decahedral or icosahedral NPs that can be viewed as twinned assemblies of defective fcc tetrahedral subunits.47 For the sake of simplicity, we simply estimate a NP size p defined as the cube root of the coherent volume using the Scherrer formula 𝑝 = 𝐾𝜋/Δ𝑞1/2. Here Δ𝑞1/2= 1.04 𝑛𝑚−1 is the
(111)NP peak half-width at half-maximum and K is taken equal
to 0.8894, as found in the literature for the (111)NP diffraction
line in tetrahedral crystallites.48 The value p=2.62nm gives an estimate of 18nm3 for the coherent volume. We show below that the NPs are close to spheres of radius 2.74nm for this particular sample. It corresponds to 4.8 coherent volumes per particle close to the value of 5 expected for decahedral structures. However, no definite conclusion can be drawn for the proportion of decahedral and icosahedral NPs, as tetrahedrons in icosahedron are expected to be much smaller, and thus to give a much more diffuse signal.
The intensities of Bragg reflection associated to the NP lattice are now analyzed for the two types of colloidal crystals. As mentioned above, an automatic data reduction is performed by the software CrysAlisPro; however, the listed intensities need to be inspected to reject data clearly impacted by the proximity of the inactive zones of the detector during acquisition. A reliability factor is defined as 𝑅𝑓= ∑||𝐹𝑜𝑏𝑠| −
|𝐹𝑐𝑎𝑙𝑐|| / ∑|𝐹𝑜𝑏𝑠| where Fobs and Fcalc respectively refer to the
observed and calculated amplitudes. A Debye-Waller-like correction 𝑒𝑥𝑝(−𝑈𝑖𝑠𝑜𝑞2/2) is further introduced; indeed its
main purpose is to account for possible static shifts of NPs out of their equilibrium position (by an average amplitude √𝑈𝑖𝑠𝑜)
as temperature is shown below to have no visible impact on the Bragg intensities. Due to the shape factor of NPs, the intensity of Bragg reflections falls rapidly with increasing scattering vector and signals typically disappear into the background for q 8nm-1 for type I and q 6nm-1 for type II. For the sake of simplicity only the 26 first reflections are included in the fitting procedure (q 5nm-1 for both colloidal crystals).
We first consider the data analysis of type I colloidal crystals. Contrarily to the previous case, NPs diffract coherently in this scattering range and averages on diffracted amplitudes and not intensities have to be considered. They are calculated considering the different possible NCs orientation as explained above. Following the same lines, {111}NC truncated cubes are
first tested. A best agreement is found for N=13 and m=9.5 (4794 atoms; Rf = 0.17 and Uiso = 0.02nm2) that correspond to
a distance of 5.32nm between {100}NC opposite facets and
4.49nm between {111}NC opposite facets. It is to notice that
the distance between {100}NC opposite facets is slightly bigger
than the one deduced previously. However a significantly better reliability factor (Rf = 0.13) is obtained with a spherical shape, as already seen in the treatment of the larger angle
data (see Table 1). This probably reflects some rounding up of the NCs edges. The as-determined radius is 2.63nm close to Table 1 Comparison of measured and calculated (spherical particle shape) amplitudes for type I colloidal crystals. Indices marked with the same color are associated to reflections of similar d-spacing.
h k l │Fobs│ │Fcalc│ h k l │Fobs│ │Fcalc│
1 1 0 819 853 4 3 1 24 22 2 0 0 186 145 5 1 0 12 22 2 1 1 195 135 5 2 1 18 16 2 2 0 262 190 4 4 0 24 28 3 1 0 148 145 4 3 3 38 35 2 2 2 77 71 5 3 0 30 35 3 2 1 14 4 4 4 2 36 37 4 0 0 60 45 6 0 0 29 37 4 1 1 74 68 5 3 2 32 34 3 3 0 68 68 6 1 1 25 34 4 2 0 70 73 6 2 0 20 28 3 3 2 74 62 5 4 1 18 21 4 2 2 48 43 6 2 2 10 12
the previous determination. Reflections associated to similar
d-spacing are pointed to by similar colors in Table 1. The
corresponding amplitudes are expected similar for a perfectly spherical shape, which is not completely verified: this probably reflects a still present faceting. The Debye-Waller factor value corresponds to a rather small out-of-equilibrium average displacement: √𝑈𝑖𝑠𝑜= 0.14 𝑛𝑚. The minimum inter-particle
gap is along the longer diagonal and its determination is rather model-dependent: 2.45nm for the truncated cube and 1.69nm for the sphere.
Data for type II colloidal crystals are now discussed. In accordance with HRTEM images, a spherical particle shape is directly chosen. The procedure has been applied to the two above-mentioned best samples with slightly different cubic parameters. As an example, data for sample with cubic parameter 10.45nm are given in Table 2. A good agreement between measured and calculated amplitudes is found for a particle radius 2.74nm (RF=0.04); it is significantly better than
for type I. The amplitudes of reflections with similar d-spacing are further rather close so that a spherical model is really pertinent. As expected, the particle radius for the second sample with smaller cubic parameter 9.79nm is found smaller 2.59nm (Uiso = 0.1nm2; Rf = 0.08); indeed the minimum
inter-particle gap found along the shorter diagonal is rather similar for both samples: 1.91nm and 1.74nm.
We now discuss the possible origin of the difference in packing mode observed for NCs and MTPs. It has been shown in the literature that the presence of ligand excess can induce polymorphism in colloidal crystals.33,34 However in the present study, the gold colloidal crystals are made with the same colloidal solution, i.e. same ligand excess. We mentioned in introduction that a large corpus of experimental data and theoretical work enlightens the importance of the gold volume
Journal Name ARTICLE
J. Name., 2013, 00, 1-3 | 7
fraction ΦAu and the ratio χ between the ligand length and the
radius of the inorganic core; in particular a (ΦAu, χ) curve is
Table 2 Comparison of measured and calculated (spherical particle shape) amplitudes for type II colloidal crystals. Indices marked with the same color are associated to reflections of similar d-spacing.
h k l │Fobs│ │Fcalc│ h k l │Fobs│ │Fcalc│
1 1 1 744 758 6 0 0 24 24 2 0 0 509 492 4 4 2 23 24 2 0 2 46 44 6 2 0 9 10 1 1 3 147 136 5 3 3 4 0 2 2 2 145 139 6 2 2 4 3 4 0 0 86 90 4 4 4 7 10 3 1 3 40 39 7 1 1 11 13 4 2 0 25 23 5 5 1 11 13 4 2 2 21 21 6 4 0 12 13 5 1 1 32 36 6 4 2 12 13 3 3 3 29 36 5 5 3 11 10 4 4 0 38 36 7 3 1 10 10 5 3 1 27 27 8 0 0 6 16
determined that separate fcc and bcc as the most stable packing modes.29,30 Indeed, ΦAu and χ as evaluated with the
assumption of a spherical particle shape for both types of colloidal crystals and using the X-ray data, and are found very similar: ΦAu =0.3 and χ =0.59 (with the hypothesis of an
extended length for a ligand with an alkyl chain of n carbons 0.12(n+1)=1.56nm).49 The corresponding point in the (ΦAu, χ)
diagram lies within the domain for expected fcc packing. Unexpectedly, type I colloidal crystals exhibit a bcc lattice instead of the expected fcc which shows that the softness of the ligand shell alone is not enough to predict the packing. Indeed, the nanocrystallinity influences the packing process via two major effects. The first is related to the nanocrystal shape. Indeed, the parameters for the cube truncation (N=13 and m=9.5 as found by the fitting procedure) are very close to those of a truncated octahedron (m=9.75) that constitutes the Wigner-Seitz cell of the bcc structure; bcc would be the most efficient packing for NPs with such a shape. Another parameter that can favor such a face-to-face packing is the spatial distribution of the ligands on the NCs. Indeed, we know that the dominant interaction between the nanoparticles comes from van der Walls forces between the ligand bundles fixed on their surface.50 Contrary to PbS NCs,31 the potential functions for the S-Au bond given shows that the {100} and {111} facets have similar S-Au bonding behavior, so that the coverage is quite similar for both surfaces.51 However, this is not affecting the bundle formation51 and one can expect that the organic shell replicates the nanocrystal shape. In the case of single crystals, the truncated octahedron is the Wigner-Seitz cell of the bcc lattice. However in the case of polycrystals, five-fold symmetry of icosahedron and decahedron is incommensurate to the translational order of the colloidal crystals, which leads to polycrystals behaving like spheres. One can notice that the bcc/fcc polymorphism was not observed in
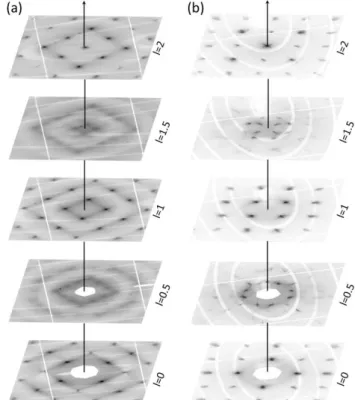
Fig. 7 Cuts of the reciprocal space for different elevations of index l are used for a reconstruction of the diffuse scattering. These snapshots are taken from an animation provided in ESI. (a) type I colloidal crystal, (b) type II colloidal crystal.
the case of slightly larger NPs as reported by us in a previous study.39 To check this point, the same self-assembly experiment was performed with NCs of 5.5nm and MTPs of 5.6nm. The corresponding SAXS powder patterns are given in the ESI and show that either NCs and NPs self-assemble into a
fcc lattice. This observation reveals that the nanocrystallinity
plays an important role in the polymorphism of smaller NPs size. Moreover, Klabunde et al. have reported a slight effect of the nanocrystallinity on the formation of thin colloidal film.28 In their study, the NCs and polycrystals self-assemble into fcc and fcc/hcp lattice mixture, respectively. This only modest influence of nanocrystallinity can be due to the method for NPs deposition, as evaporation of the solvent is known to induce compression of the NPs lattice and favor a compact structure.4
An analysis of the Bragg reflection intensities only yields an average structure for the colloidal crystal (lattice parameters, average NP shape). Diffuse scattering results from any difference between the real crystal structure and the average one;52 the most simple example is given by thermal vibrations that displace atoms from their average position, as it was observed in materials such as silicon, ice or tin polymorphs.53–
55
Moreover, the presence of acoustic phonons in such NC colloidal crystal has been revealed in recent work by pump-probe spectroscopy.56,57 In the present case, diffuse lines extending between Bragg reflections are clearly visible on diffraction patterns from both colloidal crystals (see Fig. 3, 5 and 7). We show in Fig. 7 successive cuts in the reciprocal
ARTICLE Journal Name
8 | J. Name., 2012, 00, 1-3
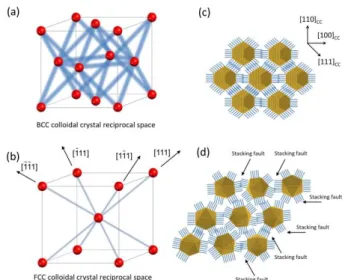
Fig. 8 Representation of the various features observed in the reciprocal space for the type I (a) and II (b) of colloidal crystals. The blue lines represent the diffuse scattering located between the Bragg nodes (red dots). Packing model of the single crystal (c) and polycrystals (d).
space with increasing l-index that allow a spatial reconstruction of the diffuse scattering. Animations are provided in ESI that displays this exploration in a vivid and precise way. In case of type I colloidal crystals with bcc packing, diffuse scattering takes the form of broad diffuse rods passing through the Bragg reflections and pointing in the eight {110}CC directions: this is schematically represented in Fig. 8.
The observation of rods is typically correlated to some planar disorder that should affect the (110)CC denser planes in real
space.52 No diffuse scattering is furthermore detected close to the center of the reciprocal space, which is in favor of a displacement disorder. This disorder can be static or dynamic, which is easily probed comparing similar diffraction planes recorded at different temperatures. For this purpose, X-ray data were collected on a same sample at room temperature and at 110K; cooling was obtained by gently blowing cold nitrogen gas on the sample using an Oxford Cryostream 700 cooling device devoted to protein crystallography (see ESI). No significant differences were observed due to this change in temperature, which indicates that the disorder is static. Indeed collective motion of NCs requires at least some thermal activation of the organic capping agent and this is not expected to occur for temperatures below typically 350K. It can be assumed that the truncated octahedrons interact more strongly through their facet-to-facet contacts within the denser {110}CC planes. In these conditions we propose the
existence short-range orientational correlations between neighboring NPs within a given {110}CC plane; this is
exemplified in Fig. 8-c where a perfect orientation of the central NP with respect to the colloidal crystal axis is chosen for the sake of simplicity. However the intensity distribution along the diffuse lines appears rather homogeneous so that these orientational correlations should not extend to neighboring NPs located on adjacent {110}CC planes (no
explanation is proposed for this last point).
We now turn to the case of type II colloidal crystals. Diffuse scattering consists in well-defined lines that extend from each Bragg reflection in the four [111]CC directions, except for those
directions that point toward the reciprocal space center. Apparently forbidden well-defined reflections are clearly visible on the plane of equation ℎ + 𝑘 + 𝑙 = 0 (see hexagons in Fig. 4-c). In fact they correspond to intersections at the points (h+1/3,k+1/3,l+1/3) of those lines that run along the [111]CC
direction and that join a h,k,l Bragg reflection of the plane ℎ + 𝑘 + 𝑙 = −1 to the next (h+1,k+1,l+1) reflection of the planeℎ + 𝑘 + 𝑙 = 2. The presence of these apparently forbidden reflections was also reported in observations by electron diffraction of Ag and Au plate like crystals and by X-ray diffraction on opals.58–60 The diffuse lines may be interpreted as being due to stacking faults that are known to be frequent in fcc NPs assemblies.61 Due to the isotropic growth of the colloidal crystal in solution, no specific [111] faulting direction is favored and all four directions are equally represented. Indeed, by mapping the reciprocal space perpendicularly to the four compact directions, each reconstructed slice shows forbidden reflections (see ESI).
Conclusions
In summary, large (up to 50µm) and high-quality well-faceted NPs colloidal crystals could be grown in solution from either single- or polycrystalline particles; the average particle diameter was quite similar for both cases (ca. 5.2nm in diameter). Their high crystallographic quality allowed us to collect diffraction data from single samples, opening the door to detailed structural investigations. In particular, weaker diffuse scattering features outside Bragg reflections have been evidenced in both mesostructures and have been related to orientational or packing disorder. With similar gold volume fraction and the ratio of coating length to nanoparticle radius, the packing mode for these colloidal crystals exhibits a drastic sensitivity to the single or polycrystalline character of NPs: self-assembly of polycrystalline particles leads to a compact fcc structure with stacking faults distributed along the four [111]CC
stacking axes, whereas single-crystal particles self-assemble in a bcc structure. In this last case, a very pronounced preferential orientation of the NCs crystallographic axis along those of the colloidal crystal is observed. This observation is related to the faceting of the single-crystal particles clearly observed by HRTEM.
In a more general perspective, this study is a further demonstration for the possibility to record high-quality X-ray diffraction data (including diffuse scattering) from isolated NPs colloidal crystals. Indeed, a detailed knowledge of the internal structure of such materials is a prerequisite for the comprehension of their physical properties.
Acknowledgements
Nicolas Goubet and Pierre-Antoine Albouy thank Pierre Fertey from the CRYSTAL beamline at SOLEIL and Alla Arakcheeva
Journal Name ARTICLE
J. Name., 2013, 00, 1-3 | 9
from EPFL, Switzerland for very helpful discussions on the use of the CrysAlisPro software. This work was carried out at the PROXIMA1 beamline at SOLEIL under proposal n° 20130947. Financial support was obtained from the advanced grant of the European Research Council under n° 267129.
References
1 J.-S. Lee, M. V. Kovalenko, J. Huang, D. S. Chung and D. V. Talapin, Nat. Nanotechnol., 2011, 6, 348–352.
2 M. Gauvin, N. Yang, Z. Yang, I. Arfaoui and M.-P. Pileni, Nano
Res., 2015, 1–8.
3 M. B. Ross, J. C. Ku, V. M. Vaccarezza, G. C. Schatz and C. A. Mirkin, Nat. Nanotechnol., 2015, 10, 453–458.
4 N. Goubet, C. Yan, D. Polli, H. Portalès, I. Arfaoui, G. Cerullo and M.-P. Pileni, Nano Lett., 2013, 13, 504–508.
5 J. Wei, N. Schaeffer, P.-A. Albouy and M.-P. Pileni, Chem.
Mater., 2015, 27, 5614–5621.
6 Z. Yang, J. Wei, P. Bonville and M.-P. Pileni, Adv. Funct.
Mater., 2015, 25, 4908–4915.
7 P. Podsiadlo, B. Lee, V. B. Prakapenka, G. V. Krylova, R. D. Schaller, A. Demortière and E. V. Shevchenko, Nano Lett., 2011, 11, 579–588.
8 Z. Nie, A. Petukhova and E. Kumacheva, Nat. Nanotechnol., 2010, 5, 15–25.
9 M.-P. Pileni, Nanocrystals Forming Mesoscopic Structures, John Wiley & Sons, 2006.
10 L. Wang, L. Xu, H. Kuang, C. Xu and N. A. Kotov, Acc. Chem.
Res., 2012, 45, 1916–1926.
11 J. Gong, G. Li and Z. Tang, Nano Today, 2012, 7, 564–585. 12 Acta Crystallogr. Sect. A, 1992, 48, 922–946.
13 L. Bergström, E. V. Sturm (née Rosseeva), G. Salazar-Alvarez and H. Cölfen, Acc. Chem. Res., 2015, 48, 1391–1402. 14 J. Seto, Y. Ma, S. A. Davis, F. Meldrum, A. Gourrier, Y.-Y. Kim,
U. Schilde, M. Sztucki, M. Burghammer, S. Maltsev, C. Jäger and H. Cölfen, Proc. Natl. Acad. Sci., 2012, 109, 3699–3704. 15 D. Gur, B. Leshem, M. Pierantoni, V. Farstey, D. Oron, S.
Weiner and L. Addadi, J. Am. Chem. Soc., 2015, 137, 8408– 8411.
16 E. V. Shevchenko, D. V. Talapin, N. A. Kotov, S. O’Brien and C. B. Murray, Nature, 2006, 439, 55–59.
17 Z. Yang, J. Wei, P. Bonville and M.-P. Pileni, J. Am. Chem.
Soc., 2015, 137, 4487–4493.
18 B. T. Diroll, V. V. T. Doan-Nguyen, M. Cargnello, E. A. Gaulding, C. R. Kagan and C. B. Murray, ACS Nano, 2014, 8, 12843–12850.
19 B. W. Goodfellow, Y. Yu, C. A. Bosoy, D.-M. Smilgies and B. A. Korgel, J. Phys. Chem. Lett., 2015, 6, 2406–2412.
20 I. Lisiecki, D. Parker, C. Salzemann and M. P. Pileni, Chem.
Mater., 2007, 19, 4030–4036.
21 C. B. Murray, C. R. Kagan and M. G. Bawendi, Science, 1995, 270, 1335–1338.
22 L. Motte, F. Billoudet and M. P. Pileni, J. Phys. Chem., 1995, 99, 16425–16429.
23 C. Lu and Z. Tang, Adv. Mater., 2016, 28, 1096–1108. 24 Y. Xiong, K. Deng, Y. Jia, L. He, L. Chang, L. Zhi and Z. Tang,
Small, 2014, 10, 1523–1528.
25 Y. Xia, T. D. Nguyen, M. Yang, B. Lee, A. Santos, P. Podsiadlo, Z. Tang, S. C. Glotzer and N. A. Kotov, Nat. Nanotechnol., 2011, 6, 580–587.
26 A. Mayence, D. Wang, G. Salazar-Alvarez, P. Oleynikov and L. Bergström, Nanoscale, 2014, 6, 13803–13808.
27 A.-I. Henry, A. Courty, M.-P. Pileni, P.-A. Albouy and J. Israelachvili, Nano Lett., 2008, 8, 2000–2005.
28 S. I. Stoeva, B. L. V. Prasad, S. Uma, P. K. Stoimenov, V. Zaikovski, C. M. Sorensen and K. J. Klabunde, J. Phys. Chem.
B, 2003, 107, 7441–7448.
29 R. L. Whetten, J. T. Khoury, M. M. Alvarez, S. Murthy, I. Vezmar, Z. L. Wang, P. W. Stephens, C. L. Cleveland, W. D. Luedtke and U. Landman, Adv. Mater., 1996, 8, 428–433. 30 B. A. Korgel and D. Fitzmaurice, Phys. Rev. B, 1999, 59,
14191–14201.
31 J. J. Choi, C. R. Bealing, K. Bian, K. J. Hughes, W. Zhang, D.-M. Smilgies, R. G. Hennig, J. R. Engstrom and T. Hanrath, J. Am.
Chem. Soc., 2011, 133, 3131–3138.
32 K. Bian, J. J. Choi, A. Kaushik, P. Clancy, D.-M. Smilgies and T. Hanrath, ACS Nano, 2011, 5, 2815–2823.
33 Y. Nagaoka, O. Chen, Z. Wang and Y. C. Cao, J. Am. Chem.
Soc., 2012, 134, 2868–2871.
34 N. Goubet and M.-P. Pileni, Nano Res., 2014, 7, 171–179. 35 S. Ino and S. Ogawa, J. Phys. Soc. Jpn., 1967, 22, 1365–1374. 36 R. Li, K. Bian, T. Hanrath, W. A. Bassett and Z. Wang, J. Am.
Chem. Soc., 2014, 136, 12047–12055.
37 P. Simon, E. Rosseeva, I. A. Baburin, L. Liebscher, S. G. Hickey, R. Cardoso-Gil, A. Eychmüller, R. Kniep and W. Carrillo-Cabrera, Angew. Chem. Int. Ed., 2012, 51, 10776–10781. 38 R. Li, K. Bian, Y. Wang, H. Xu, J. A. Hollingsworth, T. Hanrath,
J. Fang and Z. Wang, Nano Lett., 2015.
39 N. Goubet, H. Portalès, C. Yan, I. Arfaoui, P.-A. Albouy, A. Mermet and M.-P. Pileni, J. Am. Chem. Soc., 2012, 134, 3714–3719.
40 N. Zheng, J. Fan and G. D. Stucky, J. Am. Chem. Soc., 2006, 128, 6550–6551.
41 H. Portalès, N. Goubet, S. Sirotkin, E. Duval, A. Mermet, P.-A. Albouy and M.-P. Pileni, Nano Lett., 2012, 12, 5292–5298. 42 T. Geyer, P. Born and T. Kraus, Phys. Rev. Lett., 2012, 109,
128302. 43 CrysAlisPro, .
44 E. Auyeung, T. I. N. G. Li, A. J. Senesi, A. L. Schmucker, B. C. Pals, M. O. de la Cruz and C. A. Mirkin, Nature, 2014, 505, 73–77.
45 G. E. P. Box and M. E. Muller, Ann. Math. Stat., 1958, 29, 610–611.
46 International Tables for X-Ray Crystallography, Birmingham, Kynoch Press., 1968, vol. III.
47 B. D. Hall, D. Zanchet and D. Ugarte, J. Appl. Crystallogr., 2000, 33, 1335–1341.
48 J. I. Langford and A. J. C. Wilson, J. Appl. Crystallogr., 1978, 11, 102–113.
49 R. L. Whetten, M. N. Shafigullin, J. T. Khoury, T. G. Schaaff, I. Vezmar, M. M. Alvarez and A. Wilkinson, Acc. Chem. Res., 1999, 32, 397–406.
50 N. Goubet, J. Richardi, P.-A. Albouy and M.-P. Pileni, Adv.
Funct. Mater., 2011, 21, 2693–2704.
51 J. A. Olmos-Asar, A. Rapallo and M. M. Mariscal, Phys. Chem.
Chem. Phys., 2011, 13, 6500–6506.
52 A. Guinier, X-ray Diffraction in Crystals, Imperfect Crystals,
and Amorphous Bodies, Freeman, San Francisco, 1963.
53 M. Holt, Z. Wu, H. Hong, P. Zschack, P. Jemian, J. Tischler, H. Chen and T.-C. Chiang, Phys. Rev. Lett., 1999, 83, 3317–3319. 54 B. Wehinger, D. Chernyshov, M. Krisch, S. Bulat, V. Ezhov and
A. Bosak, J. Phys. Condens. Matter, 2014, 26, 265401. 55 B. Wehinger, A. Bosak, G. Piccolboni, K. Refson, D.
Chernyshov, A. Ivanov, A. Rumiantsev and M. Krisch, J. Phys.
Condens. Matter, 2014, 26, 115401.
56 P.-A. Mante, H.-Y. Chen, M.-H. Lin, Y.-C. Wen, S. Gwo and C.-K. Sun, Appl. Phys. Lett., 2012, 101, 101903.
57 I. Lisiecki, D. Polli, C. Yan, G. Soavi, E. Duval, G. Cerullo and M.-P. Pileni, Nano Lett., 2013, 13, 4914–4919.
58 V. Germain, J. Li, D. Ingert, Z. L. Wang and M. P. Pileni, J.
ARTICLE Journal Name
10 | J. Name., 2012, 00, 1-3
59 G. Nihoul, K. Abdelmoula and J. J. Métois, Ultramicroscopy, 1983, 12, 353–366.
60 J. Hilhorst, V. V. Abramova, A. Sinitskii, N. A. Sapoletova, K. S. Napolskii, A. A. Eliseev, D. V. Byelov, N. A. Grigoryeva, A. V. Vasilieva, W. G. Bouwman, K. Kvashnina, A. Snigirev, S. V. Grigoriev and A. V. Petukhov, Langmuir, 2009, 25, 10408– 10412.
61 B. E. Warren, X-Ray Diffraction, Addison-Wesley Publishing Company, 1969.