1
A Data-Driven Approach to Continuous Improvement in Reverse Logistics
By Hannah Phillips
B.S.E., Chemical and Biomolecular Engineering University of Pennsylvania, 2015
Submitted to the MIT Sloan School of Management and the Department of Civil and Environmental Engineering in Partial Fulfillment of the Requirements for the Degrees of
MASTER OF BUSINESS ADMINISTRATION AND
MASTER OF SCIENCE IN CIVIL AND ENVIRONMENTAL ENGINEERING IN CONJUNCTION WITH THE LEADERS FOR GLOBAL OPERATIONS
PROGRAM AT THE
MASSACHUSETTS INSTITUTE OF TECHNOLOGY MAY 2020
© 2020 Hannah Phillips. All rights reserved.
The author hereby grants to MIT permission to reproduce and to distribute publicly paper and electronic copies of this thesis document in whole or in part in any medium now known or
hereafter created.
Signature of Author……… MIT Sloan School of Management Department of Civil and Environmental Engineering May 8, 2020 Certified by………
Stephen Graves, Thesis Supervisor Professor of Operations Management Certified by………
David Simchi-Levi, Thesis Supervisor Professor of Civil and Environmental Engineering Accepted by………...
Colette L. Heald, Professor of Civil and Environmental Engineering Chair, Graduate Program Committee Accepted by………...
Maura Herson, Assistant Dean, MBA Program MIT Sloan School of Management
2 (This page intentionally left blank)
3
A Data-Driven Approach to Continuous Improvement in Reverse Logistics
By Hannah Phillips
Submitted to the MIT Sloan School of Management and the Department of Civil and Environmental Engineering on May 8, 2020 in Partial Fulfillment of the Requirements for the
Degrees of Master of Business Administration and Master of Science in Civil and Environmental Engineering
ABSTRACT
Verizon may rely on third-party logistics providers (3PLs) to manage some aspects of the reverse supply chain of Fios equipment. As a result, it depends on the 3PL to continually strive for increased quality, reliability, capacity, and speed. Above all, in order to have a successful partnership, the process must be economical for the 3PL. As several sources of variation are detrimental to the 3PL’s margins and cause operational problems, Verizon is investing in the supplier relationship to ensure that the 3PL is profitable and positioned for the future. Making sure there is a “win-win” relationship is beneficial for both parties and helps to ensure that the investments that have been made will continue to result in success, including operational
improvements. To do this, a culture of continuous improvement and data-driven decisions needs to be cultivated and developed at the 3PL.
The goal of this project is two-fold. First, there is a need to understand the variation that exists in the 3PL’s process as well as the associated costs, which include overtime, ineffective labor and production planning, and high turnover. The secondary goal of the project is to empower the 3PL to make data-driven decisions in the future and start to shift their culture to one that aligns better with Verizon’s. By showing the benefits of collaboration between the two companies, this project will help build trust.
In this thesis, we discuss how process mining is used to understand the 3PL’s current state and guide data-driven continuous improvement. We introduce several opportunities for handling variation, including creating visibility into return volumes, reducing defects caused by incorrect packaging, and creating feedback mechanisms for operators. This is done in close collaboration with the 3PL to ensure they will ultimately have ownership of implementation.
Thesis Supervisor: Stephen Graves
Title: Professor of Operations Management Thesis Supervisor: David Simchi-Levi
4 (This page intentionally left blank)
5
Acknowledgements
First, I would like to thank Verizon for hosting this internship and for their continued support of the LGO program. Thank you to Frank Frontiera and Jim Gowen for sponsoring the project. Thank you to the LGO community at Verizon for offering advice and support throughout the entire process, and to my supervisor, Christine Wong, who was instrumental in helping me navigate the internship project. Thank you for welcoming me onto the team, introducing me to stakeholders, giving continuous feedback, and making the internship a valuable learning experience.
I’d also like to thank my thesis advisors, Professor Stephen Graves and Professor David Simchi-Levi, for their guidance and advice throughout the internship.
6 (This page intentionally left blank)
7
Contents
Chapter 1: Introduction ... 11
1.1 Verizon ... 11
1.1.1 Verizon Wireline ... 12
1.2 Fios Reverse Supply Chain Business Model ... 12
1.2.1 Outsourcing of Reverse Supply Chain ... 14
1.3 Motivation ... 15
1.4 Problem Statement ... 16
1.5 Project Approach ... 16
1.6 Thesis Overview ... 16
Chapter 2: Literature Review ... 18
2.1 Reverse Logistics ... 18
2.2 Process Mining ... 22
2.2.1 Event Logs... 23
2.3 Supplier Collaboration and Development ... 26
2.3.1 3PL Partnerships ... 29
2.4 Good Jobs Strategy... 29
Chapter 3: Clean and Screen Process Overview ... 31
3.1 Sources of Returns ... 31
3.2 Process steps ... 32
3.3 Systems and Data Collection... 33
3.4 Current State Value Stream Map ... 34
3.5 Current State Discovered Process Map ... 35
Chapter 4: Measuring Variation in the Process ... 42
4.1 Return Quality Variation ... 42
4.2 In-feed Quantity Variation ... 42
4.3 Operator Variation... 45
4.3.1 Context of Operator Variation... 51
4.4 Resulting Process Variation ... 52
Chapter 5: Continuous Improvement Opportunities ... 56
5.1 In-feed Transparency... 56
5.2 In-feed Quality Variation Reduction ... 59
8
5.4 Operator Variation Reduction ... 62
Chapter 6: Other Considerations ... 68
6.1 Design for Repair ... 68
6.2 Reducing Unnecessary Returns ... 69
Chapter 7: Conclusions ... 72
7.1 Moving towards a win-win relationship... 72
7.1.1 Formal and Relational Contracts ... 73
7.1.2 Relational Contracts at Verizon ... 74
7.1.3 Implementation Plan ... 75
9
List of Figures
Figure 1- Reverse Logistics Process Diagram [12] ... 20
Figure 2- Diagram of Process Mining [16] ... 23
Figure 3 - Tree Structure of Event Log [18] ... 24
Figure 4 - Example discovered process map ... 25
Figure 5 - Elements of supplier philosophy that Toyota looks for [22]... 28
Figure 6- Vicious cycle of bad jobs [26] ... 29
Figure 7 – Depiction from value stream mapping exercise ... 34
Figure 8 - Sample discovered process map ... 37
Figure 9 - Throughput time distribution ... 38
Figure 10 - Sample paths of individual routers ... 39
Figure 11 - Rework loop at FVU ... 40
Figure 12 - Router return quantities over time ... 43
Figure 13- Sample distributions of Router returns over one day ... 44
Figure 14 - Hourly throughput rates for Initial Inspection, FVT, Wipe-down, and Packout ... 52
Figure 15 - Queue length by hour for wipe-down and FVT ... 53
Figure 16 - Examples of damaged units unsuitable for testing ... 59
Figure 17 - Mock-up of real-time operator feedback dashboard ... 64
Figure 18 - Relative frequencies of throughput rates at FVT ... 65
Figure 19 - Relative frequencies of throughput rates at Refurbish ... 66
Figure 20 - Relative frequencies of FVT false failure rates ... 67
10
List of Tables
Table 1- Steps in Reverse Logistics [11] ... 19
Table 2 - Comparison of Forward Logistics and Reverse Logistics [14] ... 21
Table 3- Sample Event Log [19] ... 25
Table 4 - Sample Raw Data ... 35
Table 5 - Sample Formatted Data ... 36
Table 6 - Sample operator throughput rate data... 47
Table 7 - Two sample t-test analysis comparing operator throughput rates ... 48
Table 8 - Extra capacity under error rate scenarios ... 50
Table 9 - Queue lengths of various operations ... 53
11
Chapter 1: Introduction
The research presented in this thesis is based on a six-month engagement with Verizon, starting in February 2019. The primary outcome is a data-driven approach to continuous improvement and handling variation. Additionally, this thesis explores the nature of Verizon’s relationship with third party logistics providers (3PLs) and how increased collaboration and trust can result in a win-win partnership.
This chapter provides the context for the content presented in this paper. First, an overview of Verizon and the Verizon Fios reverse supply chain is discussed. This chapter also presents the motivation for the thesis, the problem statement, and the approach used for this project.
All absolute numbers in this thesis are disguised to protect confidential information and are for illustrative purposes only.
1.1 Verizon
Verizon is an American integrated telecommunications company that provides communication, information and entertainment products and services to consumers, businesses and governmental agencies. The company, which is currently ranked 19th on Forbes’ Fortune 500 list, is
headquartered in New York City and had approximately 144,500 employees as of December 31, 2018. In 2018, Verizon had $130.9 billion in consolidated revenues with a net income of $15.5 billion. Over the five-year period from 2013-2018, Verizon’s stock cumulative total returns outperformed the S&P 500 Telecom Services Index by 30 percent. The two main business segments, wireless and wireline, make up 69.3% and 22.5% of revenues respectively. The
12 remaining 8.2% of revenue is attributed to Verizon’s media business and telematics business [1]. The scope of this thesis only applies to the wireline segment.
1.1.1 Verizon Wireline
Verizon’s wireline business segment provides communication products and enhanced services, including video and data services, corporate networking solutions, security and managed
network services, and local and long-distance voice services. The main product offering is under the Fios brand, which is a bundled internet access, telephone, and television service that operates over a fiber-optic network. Fios serves residential and business customers in the mid-Atlantic and northeastern United States. As of December 2018, there were 4.5 million Fios video
subscribers and 6.1 million Fios internet subscribers. There was a 2.1% growth in Fios revenues in 2018, with a 3.7% increase in internet subscribers and a 3.6% decline in video subscribers. This reflects two major industry trends: a continued demand for higher speed internet
connectivity, and a shift from traditional linear video to over-the-top offerings such as Netflix, Amazon Prime Video, and Hulu. Competitors to Verizon’s wireline business include cable companies like Comcast and Optimum, wireless service providers, telecommunications
providers, satellite television companies, internet service providers, and over-the-top providers [1].
1.2 Fios Reverse Supply Chain Business Model
There are three main pieces of equipment, referred to as consumer premise equipment, that need to be installed at the customer’s home: optical network terminals (ONTs), routers, and set-top boxes. The ONT converts the optical signal coming through the fiber into separate signals for TV, voice, and data and can be installed either outside or inside the home [2]. The router receives
13 input from the ONT and sends information to devices in the home, such as computers and
phones. Finally, the set-top box receives television signal from the ONT or router.
A high percentage of Verizon Fios consumer premise equipment is leased to the customer, and as a result, Verizon processes a large volume of returns each year. Products are returned for various reasons, such as a customer moving, switching service providers, upgrading equipment, or real or perceived technical issues with the product. When a current product model is returned, it is tested and refurbished so it can be redeployed in a process called “clean and screen.” This business model creates several benefits to Verizon, outlined below, including economic, environmental, risk mitigation, and social.
Each time a product is refurbished, the life of the equipment is extended, decreasing the need to manufacture new products and increasing the ROI of each piece of equipment. Each year, the clean and screen process results in cost avoidance of an amount equal to the
incremental cost that would have been spent manufacturing new equipment.
In addition to the economic benefit of refurbishing equipment, there is also an
environmental benefit. Not only does a refurbished product prevent the need to manufacture a new unit, but Verizon can also manage the disposal of all end-of-life or damaged equipment. This means that products can either be sold in the secondary market to extend their life or recycled responsibly. In fact, Verizon recycled 41 million pounds of telecom equipment in 2018 [3]. In addition, Verizon can harvest useful parts from damaged equipment to salvage the
remaining value. Finally, there is an opportunity for Verizon to close the loop on its supply chain and work with recyclers and original equipment manufacturers (OEMs) to re-use materials. For example, Verizon could choose to incorporate plastic from end-of-life products into the
14 Another business reason for operating a reverse supply chain for consumer equipment is to reduce risk of regulation. For example, in the EU, businesses that sell electrical and electronic equipment (EEE) are required to provide take-back, recycling, and recovery solutions to
stakeholders in their supply chain as well as consumers [4]. While no national regulation exists in the US, many states have passed legislation on e-waste disposal and the World Economic Forum suggested that electronic waste will be one of the major environmental challenges on the public mind in the future [5]. With a reverse supply chain in place, Verizon is prepared to respond to changes in e-waste regulation.
Due to the short lead time of refurbished equipment, the reverse supply chain also reduces Verizon’s exposure to the risk of forward supply chain disruptions. For example, if an OEM in Asia were to have a disruption that increased the lead time of new products, the impact on service level would be reduced since Verizon uses both new and refurbished equipment to satisfy demand. If Verizon had excess inventory of returned product, they would also be able to react to the disruption and refurbish additional equipment to reduce the impact further.
Lastly, Verizon has partnered with non-profit Employment Horizons to create a social benefit. Employment Horizon’s mission is to “serve people with disabilities to help them achieve their employment goals.” Each month, Verizon sends Fios equipment to Employment Horizons to be sorted, tested and refurbished. As of October 2018, this program created about 25 jobs at Employment Horizons [6]. This program has generated significant cost savings for Verizon as well as including a traditionally marginalized group into the workforce.
1.2.1 Outsourcing of Reverse Supply Chain
Two of Verizon’s regional distribution centers (RDCs), each outsourced to a 3PL, are located in the eastern United States. These RDCs are used for both the forward and reverse supply chains
15 but have dedicated areas and teams for processing returns. Returns are routed to the appropriate RDC based on product model and customer location. The 3PL is responsible for receiving returns, inspecting, testing, refurbishing, repairing, storing, and redistributing equipment. The inspection, refurbishment and repair are subcontracted to a company that specializes in after-market services, but for the purposes of this thesis, both companies will be referred to as “the 3PL.”
1.3 Motivation
As a result of Verizon outsourcing management of the reverse logistics process for Fios equipment, it relies on 3PLs to continually strive for increased quality, reliability, capacity and speed. Above all, in order to have a successful partnership, the process must be economical for the 3PLs. In the current competitive labor market, one 3PL is experiencing high turnover, switching over most of their workforce each year. They not only need to invest time and money training new operators, but new operators tend to work more slowly and make costly mistakes. This, in combination with other sources of variation described in detail in this thesis, are detrimental to the 3PL’s margins and cause operational problems. Verizon can avoid the large investment and disruption of switching suppliers by collaborating with the current 3PL to create a “win-win” relationship.
Verizon is investing in the supplier relationship to ensure the 3PL is profitable, positioned for the future, and aligned culturally with Verizon. As Verizon grows and expands its customer base, they depend on the 3PL to be able to grow in capacity as well and handle more returns and product models. To do this, a culture of continuous improvement and data-driven decisions at the 3PL needs to be cultivated and developed.
16
1.4 Problem Statement
The goal of this project is two-fold. First, there is a need to understand the variation that exists in the 3PL’s process as well as the associated costs. This thesis proposes and implements several continuous improvement projects to reduce variation and bring the process into better control. The intended outcome is to help the 3PL reduce overtime costs, plan labor and production more effectively, and retain an engaged and reliable workforce of operators. The second goal of the project is to empower the 3PL to make data-driven decisions in the future and start to shift their culture to one that aligns better with Verizon’s. By showing the benefits of collaboration
between the two companies, this project will help build trust between the 3PL and Verizon.
1.5 Project Approach
The first phase of this project is studying the current state. Through observations, stakeholder interviews, and data analysis, an understanding of the current state is developed. While a
traditional kaizen event was held, process mining was found to be the most insightful method of understanding the flow of material through the process. The second phase of the project is to use the current state analysis to identify opportunities for improvement. This is done in close
collaboration with the 3PL to ensure they will ultimately have ownership of implementation. Finally, projects are piloted and when possible, results are measured. Throughout each phase of the project, a focus on data-driven decisions is highlighted.
1.6 Thesis Overview
17 Chapter 1: This chapter provides an introduction to Verizon and the Verizon Fios reverse
supply chain. It also discusses the motivation for this thesis, the problem statement, project approach, and thesis structure.
Chapter 2: This chapter summarizes a literature review of related academic work on reverse supply chains, process mining, supplier development, and the good jobs strategy. Chapter 3: A description of the process is discussed, and the current state is analyzed
through process mining.
Chapter 4: This chapter uses a data-driven approach to measure the sources of variation in the process, including return quality, in-feed quantity, and operator variations. This chapter also discusses the interrelated nature of the variations and the resulting process variation. Wherever possible, the cost of the variation or the benefit of reducing the variation is quantified.
Chapter 5: Several continuous improvement projects are proposed based on the current state analysis. If possible, projects are piloted, and results are measured. If not, challenges are discussed, and a roadmap is presented to implement the change.
Chapter 6: This chapter discusses additional topics Verizon should consider when thinking about improving the reverse supply chain. This includes considering the ease of refurbishment and repair in the design process and efforts to reduce unnecessary returns. Chapter 7: The final chapter presents conclusions on challenges and best practices for
18
Chapter 2: Literature Review
The purpose of this chapter is to summarize existing literature related to this research project. We start with what makes reverse logistics unique, discuss process mining techniques, review the benefits of supplier collaboration, and finally introduce the Good Jobs Strategy.
2.1 Reverse Logistics
In 2018, the value of products that U.S. consumers returned to the nation’s retailers was $369 billion [7]. There are several reasons for this staggering amount, including the rise of e-commerce, lenient return policies becoming the norm for customer-centric brands, and lower tolerance among consumers for imperfection [8]. The process of handling the growing number of returns is referred to as reverse logistics.
One of the most widespread definitions of reverse logistics was presented by Tibben-lembke and Rogers in 1999: “the process of planning, implementing, and controlling the efficient, cost-effective flow of raw materials, in-process inventory, finished goods and related information from the point of consumption to the point of origin for the purpose of recapturing value or proper disposal” [9]. This definition has been critiqued because it implies the flow must go back to the origin of the original product, which is not the case in many instances. We prefer the broader definition presented by the European Working Group on Reverse Logistics, which expands the “point of consumption” to “a manufacturing, distribution or use point” and “point of origin” to “a point of recovery or point of proper disposal” [10].
Most reverse supply chains are organized to carry out four key processes: collection, inspection and separation, reprocessing, and redistribution. Table 1 describes each of these processes, breaking out reprocessing into various levels: repairing (product level), refurbishing
19 (module level), remanufacturing (component level), recycling (material level), and incineration (energy level) [11].
Table 1- Steps in Reverse Logistics [11]
Step Description
Collection Used products are moved to a point of recovery Inspection &
Separation
Products are inspected and separated by their level of reusability Repairing Broken products have some aspect of their life cycles restored. This
could result in a loss of quality Refurbishing Upgrading a product
Remanufacturing A product or component is used to create a new and usable product. This includes cleaning, disassembly, replacement, and reassembly Recycling Products are changed into more basic forms such as scrap metal, glass,
plastic, and paper
Incineration Products are burned and the released energy is captured
Redistribution Products are distributed to various markets. This includes storage, sales, and transportation
The flow of materials through the reverse supply chain is illustrated in Figure 1. Product returns can be classified as manufacturing returns, distribution returns, and customer returns. Manufacturing returns occur during production and can be caused by raw material surplus, failed quality checks, excessive production, or production by-products. Distribution related returns are initiated during the distribution phase and are caused from product recalls, business to business commercial returns, and stock adjustments. Finally, customer returns are initiated after the product has reached the final user. Examples of customer related reasons are business to consumer returns, returns in warranty period, returns for service or repair, end-of-use returns, and end-of-life returns [12].
20
Figure 1- Reverse Logistics Process Diagram [12]
It is important to note the differences between the forward and reverse supply chains, summarized in Table 2. As Fleischmann et al. point out, reverse logistics is “not necessarily a symmetric picture of forward distribution” [13]. Rogers and Tibben-Lembke note that reverse supply chains are much more reactive, with much less visibility. Generally, returns are not initiated by firms themselves, but rather by customers or downstream players [14].
21
Table 2 - Comparison of Forward Logistics and Reverse Logistics [14]
Forward Logistics Reverse Logistics
Forecasting is relatively straightforward. Forecasting is more difficult because of greater uncertainty. Forecasts are needed both for customer demand and for availability of product to be remanufactured (returns).
Transportation is one origin to many destinations
Transportation is many origins to one destination
Product quality, packaging, and pricing are relatively uniform. Products are packaged so they are protected during transit, and new products can be palletized and handled easily. Products come in large quantities. Product SKUs can clearly be identified from packaging.
Product quality and packaging are not uniform. Customers likely do not package products properly, and units could be damaged. Returns come in smaller volumes which are harder to organize and palletize. Product SKUs cannot easily be identified by packaging.
Destination, routing, and disposition options are clear. No screening is necessary
regarding shipping to potential customers.
Disposition, destinations and routing are unclear. Different customers are willing to purchase different qualities of products, so screening is necessary.
Traditional inventory management models can be used.
Because the arrival of product is random and the price at which the product will be sold is not known, traditional models cannot be applied.
In practice, reverse logistics is difficult because there are many unknown parameters, such as product return quantity, quality and timing. These uncertainties increase the complexity of material requirement planning and create challenges with transportation planning and resource allocation [15].
While many companies view reverse logistics as a cost, it should be an opportunity to build competitive advantage and can even become a profit center. Good reverse logistics practices can reduce the customer’s risk when buying a product, which increases customer preference for the product. In addition, there is significant value that can be recaptured from managing the reverse flow cost-effectively. Stock et al. list three ways companies can turn reverse logistics into a profit center. First, returns should be processed in their own facility with
22 their own leadership. Second, returns should be treated as goods for sale. This means targeting different buyers like resellers, scrap merchants, and auction sites like eBay.com and
FastAsset.com. Finally, companies should design efficient routes for returned products, which may be significantly different from those defined for forward distribution [8].
2.2 Process Mining
Process mining is a research discipline that sits between machine learning, data mining, process modeling and process analysis. The idea of process mining is to discover, monitor, and improve real processes by extracting knowledge from logs of information systems, referred to as event logs [16]. This has largely been an academic topic pursued by researchers like Wil van der Alst, a Dutch computer scientist. However, process mining gained practical relevance in 2011, when Celonis, a Munich-based company, was founded. Gartner published a market guide for process mining in 2018 that included an analysis of the vendor community. In the report, it identified over a dozen process mining vendors, and Celonis was judged to be the market leader. With the introduction of these software providers, process mining can help organizations easily capture information from enterprise transaction systems and provide data-driven information about how key processes are performing [17].
There are three types of process mining applications: discovery, conformance, and enhancement. In a discovery application, event logs are used to produce a model without using any a-priori information. This can be used to visualize the flow of material or a social network showing how people work together in an organization. In a conformance application, an existing process model is compared with an event log of the same process in order to detect, locate, and explain deviations, and to measure the severity of any deviations. Finally, process mining can be used to extend or improve an existing process model using information about the actual process.
23 The model may need to be fixed to better reflect reality or extended with information about resources or quality metrics. Figure 2 depicts the connection between the three main types of process mining and real processes, data, and models.
Figure 2- Diagram of Process Mining [16]
While traditional process improvement approaches, such as Lean and Six Sigma, have not emphasized information technologies as enablers of process management, Wil van der Alst notes that process mining can be used as a tool to add more substance to those methodologies. Process discovery can be used to eliminate non-value-added activities, reduce waste, and visualize rework and waiting. In addition, conformance checking can improve the quality of value-add activities and diagnose deviations from the model [16].
2.2.1 Event Logs
An event log is a set of actions recorded in the context of a process. Figure 3 shows the tree structure of an event log.
24
Figure 3 - Tree Structure of Event Log [18]
A process consists of cases, which are the objects, people, or information that are flowing through the system. Each case consists of one or more events, and each event is related to precisely one case. Events within a case are ordered and can have attributes, such as activity, time, costs, and resources. Events referring to the same activity should typically have the same attributes. Events should also include a reference to a life cycle transition (e.g. schedule, assign, start, complete) [18]. The following example in Table 3 shows an event log for an emergency department. Each row contains a case ID (patient), activity label, activity instance ID, timestamp,
25 transactional life cycle stage (status), and resource. The activity instance ID is necessary because a case can go through multiple instances of the same activity, and we need to know which events belong together. For example, we know the patient has multiple surgeries because we see two activity instance IDs (2 and 4) for the surgery activity [19].
Table 3- Sample Event Log [19]
Patient Activity Activity Instance ID Timestamp Status Resource John Doe check-in 1 5/10/2017 8:33 complete Samantha
John Doe surgery 2 5/10/2017 8:38 schedule Danny
John Doe surgery 2 5/10/2017 8:53 start Richard
John Doe surgery 2 5/10/2017 9:25 complete Richard
John Doe treatment 3 5/10/2017 10:01 start Danny
John Doe treatment 3 5/10/2017 10:35 complete Danny
John Doe surgery 4 5/10/2017 10:41 start William
John Doe surgery 4 5/10/2017 11:05 complete William John Doe check-out 5 5/11/2017 14:52 complete Samantha
Once data is in the event log format, process mining is used to create a visual
representation of what occurred. Figure 4 shows a discovered process map from the event log in Table 3. Key information displayed in the diagram includes average activity lengths, average wait times between activities, and total number of cases along each path and through each activity.
26
2.3 Supplier Collaboration and Development
McKinsey defines supplier collaboration as the “joint development of capabilities for both the customer and supplier for the purposes of reduced cost, process improvements, and innovation in products or services.” The best supplier relationships result in a competitive advantage for all players and drive innovation and growth. A 2012 McKinsey survey of over 100 large global companies showed that fewer than 10 percent of respondents could demonstrate systematic efforts on supplier collaboration. Among those who did collaborate, the EBIT growth rate was double that of their peers [20]. In fact, McKinsey suggests that companies that develop supplier collaboration capabilities tend to outperform their peers, with lower supply chain costs and better service levels [21]. In addition to company benefits, suppliers also benefit from more stable business, cost-competitiveness, and improvement in core capabilities that can be used to win more business externally [20].
McKinsey lays out several ways to collaborate with suppliers, all of which are built on a foundation of trust and transparency. The first is a value-sharing model that incentivizes
performance for both the customer and supplier. Common incentives for suppliers include extending contract length, splitting cost savings 50/50, negotiating a pre-determined benefit to the buyer (e.g., 5 percent cost reduction per year) with the rest going to the supplier, and joint investment in capital projects for further capacity. Another way to collaborate is for cost reduction. Suppliers are not treated as cost centers, but instead as partners, which require the development of long-term, trusting relationships. This can result in several improvements to how interactions change between the buyer and supplier. For example, negotiations will be based on full transparency into costs, with margins and growth built in. In addition, specifications are
27 jointly optimized to eliminate waste. Finally, demand transparency is created to optimize
inventories [20].
One company that is recognized for best-practices in supplier relationships is Toyota, which is known for creating a base of suppliers that are “committed to continuous improvement, unshakably loyal, integrated into an extended network, and generating stable financial
results”[22] . Suppliers prefer to work with Toyota because Toyota “allows them acceptable returns on their investments, is reliable in honoring its contract price agreements, supports suppliers in improving their operations, respects their capabilities and intellectual property, and provides an equitable split of any cost reductions they achieve” [22].
The positive supplier relationship begins with careful supplier selection. BCG interviewed Toyota suppliers to create Figure 5, which shows what values Toyota considers when choosing suppliers. The supplier selection process is based on Toyota’s belief that long-term partnerships create more value than short-long-term relationships. Working with familiar suppliers not only reduces transaction costs, but long-term suppliers can also be integrated into longer-term product planning processes [22].
28
Figure 5 - Elements of supplier philosophy that Toyota looks for [22]
Once suppliers are selected, Toyota takes responsibility for helping that supplier develop and grow as a business. Toyota has a philosophy that the success of the supplier reflects its own success. As examples, Toyota monitors supplier performance, performs quality audits, employs proprietary processes that facilitate the rapid resolution of problems and makes a robust
knowledge-sharing network available to its suppliers, allowing them to learn from each other [22].
BCG suggests that for companies to emulate Toyota’s effective supplier relationships, they need to adopt a corporate philosophy of treating all stakeholders fairly. They should choose suppliers that are committed to building long-term partnerships and that share a high-level work ethic. Finally, the company and its supplier should create a shared understanding that the close monitoring of suppliers’ performance is not because of mistrust, but because there is a desire to identify potential performance gaps and collaborate to close them [22].
29
2.3.1 3PL Partnerships
In 2017, 90% of Fortune 500 companies relied on 3PLs for outsourced logistics and supply chain services [23]. Although the concept of supplier development can apply to creating more value out of 3PL relationship, it is not uncommon for companies to approach a 3PL contract as procuring a commodity, with the overriding goal to achieve the lowest possible unit cost [24]. This approach can be counterproductive and can end up in increased costs over the long run. Research from Langley found that while 43% of shippers think of themselves as “strategic” buyers of 3PL services, only 31% of 3PLs feel that their customers manage them as a strategic partner [25].
2.4 Good Jobs Strategy
The Good Jobs Institute, a nonprofit that emerged from research at MIT, defines a good job as one that both meets people’s basic needs and offers conditions for engagement and motivation. On the other hand, companies that offer bad jobs can get stuck in a “vicious cycle,” depicted in Figure 6 [26].
30
In addition to high employee turnover costs, low sales from poor customer service, and unnecessary costs from operational problems, companies that are in a vicious cycle “find it hard to differentiate themselves from competitors, hard to adapt to changes in their environment, and hard or impossible to drive improvement through their employees” [26].
MIT’s Zeynep Ton, founder of the Good Jobs Institute, makes the case for good jobs with financial, moral and operational arguments. Companies with bad jobs have high turnover and high absenteeism, which costs companies in recruitment and training new employees. In terms of operations, the Good Jobs Strategy creates “superior value for employees, customers, and
investors by combining investment in employees with operational choices that increase employees’ productivity, contribution, and motivation.” The operational changes both require investment in people and enable further investment [26].
Finally, Ton points out that with bad jobs, companies and their employees can’t have high expectations of one another because their operations and people are too unstable. Good jobs companies can have higher expectations for their employees and in return, employees expect to be rewarded for their productivity and contributions [27].
31
Chapter 3: Clean and Screen Process Overview
The purpose of this section is to provide a description of the system being studied and a detailed picture of the current state. The clean and screen process runs on a 3-shift schedule, 24 hours a day, 5 days a week. Much of this thesis focuses on the highest volume product at the 3PL of interest, the broadband home router, hereafter referred to as “Router”. Process steps for the Router line are presented, although each product line follows similar steps.
3.1 Sources of Returns
Returns can come from three sources: directly from the customer, retail stores, or garage work centers (GWCs), which are regional warehouses for Verizon technicians. Below is a description of each of the return sources.
Directly from the customer: Customers can log into their Verizon account to initiate a return. Verizon will provide the customer with a return shipping label which routes the product to the appropriate receiving location. Trucks delivering returns arrive at the RDC daily, Monday through Friday, to deliver the customer returns.
Retail store: Customers also have the option to bring their returns to a Verizon retail store. Verizon contracts with various carriers to pick up returns on a set schedule, ranging from twice a week to five days a week, depending on the historical volume of returns and available storage space in the retail store.
GWCs: Verizon technicians will swap equipment at a customer’s home if they determine that there is a technical issue or for a service or equipment upgrade. At the end of each day, the technicians place the used equipment in a designated area in the GWC. These returns are picked up six days a week by Verizon and delivered to the RDC.
32 3.2 Process steps
Below is a description of each step in the clean and screen process for Routers.
Receiving: An operator unpacks parcels and scans each product. If the product model is obsolete, the inventory tracking system tells the operator to scrap the unit. Otherwise, units are sorted by product model. Products must be in pallet quantities before moving on to the next steps. This step also signals Verizon to remove the product from the customer’s account to ensure they are no longer billed.
Initial Inspection: An operator inspects the unit for physical damage that is beyond economic repair. This is an important screening step to ensure that units are viable to be reused. Common fallout occurs because of insect infestation, loose items, liquid damage, and Wi-Fi label damage.
Firmware Version Upgrade (FVU): An operator plugs units into a test slot and an automated script upgrades the unit to the latest version of firmware if necessary. This step also screens for login failures and broken LEDs.
Functional Verification Testing (FVT): An operator plugs units into a tester which runs automated test scripts to check that the unit is working properly. Examples of tests include measuring signal strength and checking functionality of LAN and WAN ports. Depending on circumstances, if a unit fails, it may be re-tested at another tester to ensure that it is a true fail. The 3PL currently uses a heuristic testing policy for determining true fails. False failures can occur due to timing issues in the test, faulty cables, or human errors like not fully inserting a cable.
33 Automated Cosmetic Inspection (ACI): A camera system with a robotic arm is used to pick up and image the unit. The system rejects units with predefined defects such as scratches.
Refurbish: An operator replaces defective components such as covers, bezels, and labels, resulting in a working unit that is considered like-new.
In Process Quality Control (IPQC): If appropriate, an operator verifies the quality of the unit by performing a final cosmetic and functional inspection.
Pack-out: An operator scans the unit to signal that it is now considered a finished good.
Each process step has multiple stations so that the line can be balanced depending on the production schedule. After pack-out, units are moved out of the clean and screen room to be kitted with power cords and redeployed to the field, whether they are being sent to GWCs or directly to customers.
3.3 Systems and Data Collection
Verizon and the 3PL have separate inventory tracking systems, but the 3PL sends data transmissions to Verizon’s systems at certain points in the process to sync them and provide transparency. Because each operation includes a barcode scan, the 3PL’s IT system can track each product by serial number throughout the process, along with operator names, timestamps, operation names, fail codes, warranty status, and other product attributes. This is a rich data source for process mining and other process analysis. Verizon employees have limited access to the data through an online portal, but detailed data was provided for this project on an exception basis.
34
3.4 Current State Value Stream Map
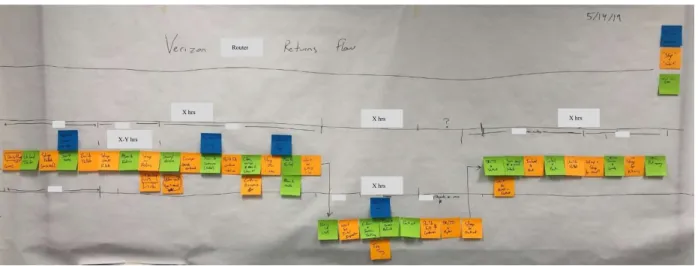
A traditional kaizen event was held to understand the current state of the process and to identify areas of improvement. This included a gemba walk and the exercise of creating a value stream map with a team of stakeholders across the 3PL and Verizon. Participants included members of both companies responsible for quality, process engineering, and production, as well as the site leadership. The resulting depiction of the process, in Figure 7, is purely based on observation, experience, and intuition, rather than data; hence, there are a few major differences when compared to the discovered process map created using process mining.
Figure 7 – Depiction from value stream mapping exercise
For example, participants came to an agreement about how long it would take to get from the time of receipt to initial inspection. In reality, it takes about twice as long. In other cases, participants were focused on the “average path” of a router instead of thinking about costly exceptions. One benefit of this exercise was that it got all the stakeholders on the same page about the high level of the process and information flow. It also created momentum around collaboration for continuous improvement.
Router X hrs X-Y hrs X hrs X hrs X hrs
35
3.5 Current State Discovered Process Map
In order to use process mining techniques, data output from the 3PL’s inventory tracking system first had to be cleaned and formatted into an event log. BupaR, an open-source, integrated suite of R-packages, was chosen for the analysis. BupaR consists of eight packages that help with importing event data, calculating process metrics, and process visualization. Referencing the elements of an event log from section 2.2.1, in this event log, the process is clean and screen, the activity is the operation being performed (i.e. initial inspection or FVT), the case is the specific serial number, and resource could refer to an operator or a workstation, depending on the analysis.
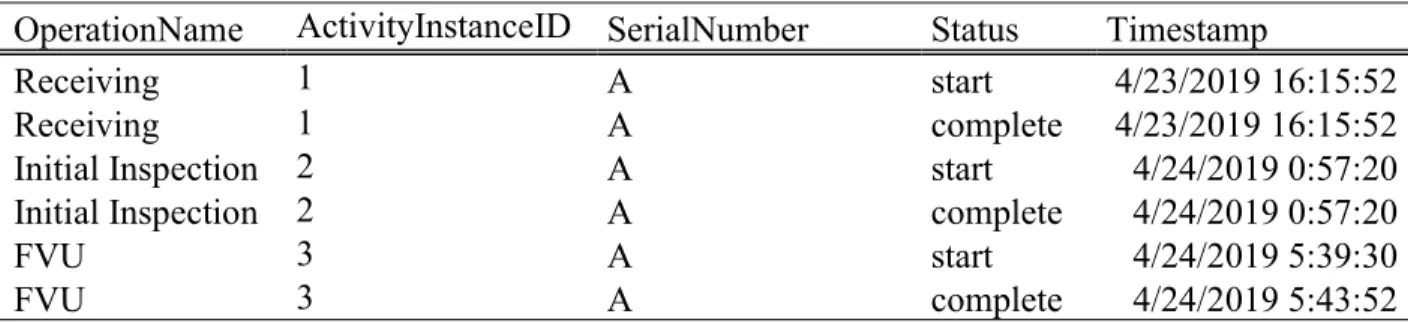
An R script was written to read in the raw data file, fix known data issues, add useful attributes like shift, and translate the data into the correct format. In this case, a transformation was needed to convert the data from a list of activity instances. To do this, a unique ID was added to define the activity instance and the timestamp columns were gathered, as shown in the example in Tables 4 and 5. Note that for manual operations like initial inspection, we only have one timestamp which is triggered by the operator scanning the unit and represents the beginning of the operation. However, it is listed under both the start and end time columns in the raw data file. For automated steps like FVU, the test script sends an accurate start and stop time to the inventory tracking system.
Table 4 - Sample Raw Data
OperationName SerialNumber StartTime EndTime
Receiving A 4/23/2019 16:15:52 4/23/2019 16:15:52
Initial Inspection A 4/24/2019 0:57:20 4/24/2019 0:57:20
36
Table 5 - Sample Formatted Data
OperationName ActivityInstanceID SerialNumber Status Timestamp
Receiving 1 A start 4/23/2019 16:15:52
Receiving 1 A complete 4/23/2019 16:15:52
Initial Inspection 2 A start 4/24/2019 0:57:20
Initial Inspection 2 A complete 4/24/2019 0:57:20
FVU 3 A start 4/24/2019 5:39:30
FVU 3 A complete 4/24/2019 5:43:52
One week of data was analyzed at a time. This time frame was chosen because it eliminates the impact of weekends, which artificially inflate throughput times. In addition, it greatly reduces the chance that the same router comes back into the system twice, which would complicate the visualization. The resulting discovered process map for the week of 4/22/19 is shown in Figure 8. It shows the most common paths taken by routers, corresponding to 95% of the router volume. For simplification, it only includes routers that were both received and packed out in the same week. In the diagram, the times on the arrows represent average wait times and the times inside the bubbles represent average task times. Note that times are scaled to disguise absolute values and are only for illustrative purposes to show relative values. As discussed, only some operations have both start and end times recorded, and all other operations show a task time of 0 because units are only scanned once. The bubbles and arrows are shaded darker for the operations and paths that take longer. This picture gives a much better idea of what is actually happening on the floor than the value stream map created during the kaizen event.
37 F ig ur e 8 - S am ple d isc ov er ed p ro ce ss m ap
38 A few elements stand out as areas for opportunity. The first is the long wait times
between each step. While the longest wait time is from receiving to initial inspection, more data is needed to understand the cause. This could be due to time for the pallet to build up, waiting time in the warehouse, or waiting in a queue before the clean and screen room. Although there is no visibility as to where the units are between those two points, we can conclude from
observation that units are waiting in a queue before initial inspection for most of that time. Therefore, we will focus instead on the clean and screen room, starting at initial inspection. From initial inspection to pack-out, the total scaled throughput time averages 2.09 hours. The
distribution of process throughput times is shown in Figure 9, with a standard deviation that is 110% of the mean.
Figure 9 - Throughput time distribution
During this week, the average times between FVU and FVT, ACI and refurbish, and IPQC and pack-out were approximately the same. The average time between initial inspection and FVU was almost twice as long. We found that units with the longest throughput times go through Wi-Fi recovery, right-side cover repair, or are set aside to be looked at by a quality
39 technician. Wi-Fi recovery and right-side cover repair are both repairs that were recently brought in-house instead of sending units back to the OEM. When those units are excluded, average throughput time is about 75% of the overall average time. The American Society for Quality (ASQ) defines the metric value-added ratio (VAR) as time devoted to process steps of interest to the customer divided by the total process cycle time [28]. Splitting the throughput time into value added touch time and non-value-added wait time, we calculate the VAR of this process to be about 9%. According to ASQ, world-class organizations attain VARs much higher than 20%. Figure 10 shows two examples of individual routers flowing through the process, highlighting the largest contributors to the long throughput time
.
The first is an average path and takes about half the amount of time as the second to complete. Both the range of throughput times and queuing theory, which lists process variation as a cause of long wait times between steps, point to variation reduction as a significant
opportunity for improvement in this system.
The second opportunity is the rework at FVU and FVT, which can be seen in Figure 8 by the loop above FVU and the re-test counter loop at FVT. The re-test counter is not a real
40 operation, but a way to track the number of times a unit has failed before it should be considered a true fail. A zoomed in picture of the FVU rework loop is shown in Figure 11
.
During this week, about 20% of units in this sample were retested at FVU. While FVU is a relatively short operation compared to some others, units waited a significant amount of time before being retested, increasing the total FVU time for this portion of the population. In
addition, during this week, about 10% of the tests run at FVT were re-tests. This is the result of a heuristic retesting policy used to determine if a unit needs to be retested before considering it a true fail. A fraction of all retested units was ultimately sent to the Failure Warranty Verification (FWV), which signifies that they were true fails. The others are considered false fails because they pass a subsequent test. As described in the next chapter, operator behavior can impact the number of false failures.
These examples show the power of visualizing the process to quickly spot inefficiencies, especially when we don’t have prior information about what areas need improvement and are trying to quickly develop an understanding. In addition to giving a non-biased representation of the current state and setting the direction for improvement projects, process mining was also a useful exercise to validate the data. The first time the process map was generated, there were some unexpected paths that helped us identify data issues. Once those were addressed and
41 everyone agreed that the picture matched reality, future analysis could be trusted without
questioning the validity of the data.
In conclusion, the most important learnings from the Router process mining exercise were the long wait times between each step, suggesting process variation, and the significant amounts of re-work, suggesting either operator or tester variation. In order to increase the operational efficiency of the process, it became clear that the sources of variation needed to be studied.
42
Chapter 4: Measuring Variation in the Process
The purpose of this section is to describe and measure the sources of variation in the process and determine the associated costs. Each of these observed variations are interrelated and create a reinforcing cycle.
4.1 Return Quality Variation
Products come back from customers in varying conditions, resulting in different lengths of time required to test, clean and refurbish. For example, we might expect a unit with a missing rubber foot to take 15 seconds to refurbish while a product with a scratch on the cover to take 45 seconds. Similarly, a unit that comes back clean should take 20 seconds to wipe down, while a unit with excess dirt and residue could take 40 seconds. While testing, some units will need a firmware upgrade while others might be up to date. Also, since a unit might be tested more than once before it is considered a true fail, a unit that comes in with functional issues might take longer to test than one that passes on the first try. There are several other examples where the product quality will affect the touch time required on the unit. As each unit requires slightly different work, work instructions can be complicated and creating standard work is difficult. The operation that is most affected is refurbishing units, which has a 60-page work instruction
manual to detail what to do in each possible scenario.
4.2 In-feed Quantity Variation
In reverse logistics, the timing and quantity of returns is a major source of uncertainty. Figure 12 shows daily return volumes for Routers at this location, the highest volume product processed at the 3PL. As opposed to a forward supply chain that can operate just in time and order inputs as needed, Verizon has no control over how much input it has. This is completely dependent on
43 unpredictable factors such as customers moving, switching service providers, and technical issues. Historical data can be used to forecast returns on a monthly basis, but no forecast is created on a daily basis. The seasonality of people moving in certain months helps to explain the spike in Figure 12, but it would be hard to predict what day that spike would occur or if it would be concentrated on one day or spread out. The 3PL refers to a product like the Router as hand-to-mouth, because they need to process everything that gets returned to meet the demand set by the Verizon planning team. As the return forecast is an important input into the production goal, problems arise when the forecast is incorrect
.
Figure 12 - Router return quantities over time
Not only are daily return quantities unstable, but the timing on a given day is random. Since the operators unloading the trucks have no visibility into the contents of the boxes, boxes are unloaded randomly. Therefore, by random chance, the Routers for the day may be received at
44 any time with any distribution. Figure 13 show two examples. On one day, returns peak at 3pm, while on the other day, returns peak at noon.
Figure 13- Sample distributions of Router returns over one day
Because of the high demand and random nature of the returns, the clean and screen process can easily be starved for in-feed at times and have too much in-feed at other times. If the process is starved for long enough, capacity is lost at the bottleneck, which is FVT. While the process does have some extra capacity, many times the 3PL is unable to make up for lost capacity and overtime is needed to meet the monthly production targets.
45 In addition to lost capacity, the other challenge with not knowing the quantity or timing of returns is that it makes it difficult for the 3PL to plan for short-term labor allocation. If these variables were known, supervisors could optimize resources based on product demands,
available in-feed, and operator certification for various stations. Because of the uncertainty, the 3PL is forced to be reactive instead of proactive. If the process is starved for in-feed, line supervisors need to make a judgement call if they want to wait and have operator idle time, re-allocate operators to different production lines or training, or send operators home before the shift is over. In one instance during the project, a supervisor decided to re-allocate most of the operators from the Router line to cross-training for another line for the rest of the shift. By the time the shift had ended, a few hours of Router work had accumulated. The next shift had steady in-feed and could not make up for the lost capacity. Without visibility into incoming in-feed, there is no way to make an educated guess when faced with a starved production line.
In summary, the costs of in-feed variation are lost capacity resulting in overtime and operator idle time.
4.3 Operator Variation
To measure operation variation, one week of throughput rates for individual operations was analyzed. Select data representing a range of operators across shifts is presented in Table 6. One of the challenges with analyzing operator data is that operators move between different tasks, all of which have different target cycle times. This analysis needed to take that, as well as scheduled breaks, into account. To accomplish this, data was divided into 30-minute intervals and filtered for periods where an operator only performed one type of task. To only measure rates of work for sustained periods of time, each time period must have a difference between the maximum timestamp and minimum timestamp of greater than 20 minutes. The number of units completed
46 during the period is scaled to an hourly rate based on the number of minutes worked during the time period. In addition, time periods where the operator worked on less than 8 units are discarded, because those were likely scenarios where the operator worked for a few minutes at the beginning of the period and a few minutes at the end of the period, skewing the difference between maximum and minimum timestamps. This methodology makes sure that operators are not penalized for their breaks. Time periods will be discarded if operators were on break for more than 10 minutes, and the units will be scaled based on the number of minutes they were actually working. Finally, we only look at operators who have a sample size (n) of at least 8 time periods at that operation.
For FVT, additional considerations need to be made because operators can handle various numbers of testers simultaneously. While the testers are clustered into cells of 6 or 7, operators can handle up to 10 testers if staffing is low. As operators handle more testers, they are likely to have higher individual throughput rates, although overall process throughput rate will suffer. To take this into account, an operator can only be compared to another operator who handles the same number or less testers. For example, using the scaled numbers from Table 6, we could say that operator 7, who processed 8.42 units/hour on 6 testers, should be able to match operator 2, who processed 10.16 units/hour also on 6 testers. We could also compare operator 6, who processed 8.53 units/hour on 8 testers to operator 2, who was able to process more units on less testers.
47
Table 6 - Sample operator throughput rate data
Operation Name Operator ID Mean Hourly Units SD Sample Size (n) Shift # Testers
FVT 1 10.96 1.62 28 2 9 FVT 2 10.16 1.10 42 3 6 FVT 3 9.77 0.79 18 3 7 FVT 4 9.09 2.03 13 1 9 FVT 5 8.62 1.46 21 1 7 FVT 6 8.53 1.65 32 1 8 FVT 7 8.42 1.05 11 3 6 FVU 8 48.88 10.71 34 3 1 FVU 9 26.50 6.67 73 2 1 FVU 10 24.03 6.15 51 2 1 FVU 11 20.42 6.81 24 1 1 Initial Inspection 12 44.77 4.80 14 2 1 Initial Inspection 13 29.34 6.43 17 3 1 Initial Inspection 14 25.95 11.05 35 1 1 Initial Inspection 9 16.75 5.48 19 2 1 REFURBISH 16 14.75 3.81 10 3 1 REFURBISH 17 10.18 1.83 46 1 1 REFURBISH 12 8.50 1.10 38 2 1 WIPEDOWN 19 22.02 2.98 8 1 1 WIPEDOWN 20 17.69 3.00 34 2 1 WIPEDOWN 3 13.68 3.77 29 3 1
An assumption is made that functional and cosmetic defects are spread evenly, and each operator receives the same number of units in good and poor condition. Therefore, product quality variation could justify an individual operator’s standard deviation in throughput rate, but it does not justify the large spread between throughput rates of different operators performing the same task.
To more precisely quantify the operator variation, we need to compare sample means between low-performing and high-performing operators. For operations with normally distributed data, two-sample t-tests were performed to show that the differences in means are
48 statistically significant. Table 7 shows one example of this analysis. To quantify both a
conservative and optimistic scenario, we calculate a 95% confidence interval for the difference in means. Data was tested for normality using the Shapiro-Wilk normality test, where a p-value greater than 0.05 implies the distribution of the data is not significantly different from a normal distribution.
Table 7 - Two sample t-test analysis comparing operator throughput rates
Operator 2 Operator 6 Confidence Interval for Difference in Means Operation
Name Mean Units/Hour SD Mean Units/Hour SD Two Sample T-test P-value Lower 95% Upper 95%
FVT 10.16 1.10 8.53 1.65 1.22E-05 .957 2.311
We can combine the information in Table 6 with the information in Table 7 to calculate the excess capacity that could be generated at the bottleneck, FVT, if operator variation was eliminated and low-performing operators were brought in-line with high-performing operators. Monthly excess capacity is calculated by multiplying the difference in mean throughput time by the number of monthly hours worked at FVT. For example, using the lower confidence interval for the difference in mean throughput rate, if operator 6 was brought in-line with operator 2 for 16 hours per week, they would be able to complete 61 additional units per month. We use 16 hours per week because operator 6 worked 32 30-minute periods at FVT during the week of this analysis and we assume weekly hours at each station will remain constant throughout the month.
If each operator were compared to the highest-performing operator with equal or fewer testers, and if both operator datasets had normal distributions and a two-sided t-test gave a p-value less than .05, we found that capacity could increase by about 2% per month for a conservative estimate and by about 8% per month for an optimistic estimate. Conservative
49 estimates were calculated using lower 95% confidence interval values for the difference in
means, while optimistic estimates used upper 95% confidence interval values. Although the process is constrained by the in-feed units, this excess capacity would allow the 3PL to complete more units at peak times, eliminating the need for overtime and positioning them for future growth.
Another implication of operator variation is difficulty balancing the line. Line leads need to react to the local bottlenecks that result from operators having differing throughput rates, with the goal of never starving the FVT station. Moving operators to fill holes tends to create new local bottlenecks and therefore more variation. When operators switch between tasks, it also takes a few minutes of transition time to get set up and in the mind-set for the next task,
exacerbating operator variation further. Ideally, operators jumping from station to station would be minimized to reduce the disruption and noise.
In addition to throughput rate differences between operators, we also see differences in false failure rates. Some level of false failure is expected due to the nature of consumer
electronic firmware, but the data shows a very large range among operators during the chosen time period, from 3% to 15%. When comparing operator throughput rates per tester and false fail rates, a correlation of -.54 was found. The Pearson’s product moment correlation test was
performed with a p-value of .012 to show statistical significance. This means that operators who have lower throughput rates also are observed to have higher false failure rates. Each time a false failure occurs, time on the FVT tester is wasted that could be used to test a new unit. The
following definitions are used in the analysis:
False Failure (FF): A working unit that fails one or more test, but subsequently passes the test. Each time a FF unit fails, we say there is a false failure error.
50 True Pass (TP): A working unit that passes all tests on the first attempt.
False Fail Rate (FF Rate): A ratio describing the number of false failure errors out of the total tests run on working units (FF+TP).
A scenario analysis was performed to calculate the additional capacity that could be gained if operator variation was eliminated and every operator could reach a specific error rate. The error rate scenarios considered were 10%, 7%, 5%, and 3%. For each scenario, the number of false failure errors for a given operator is the minimum of the error rate multiplied by total tests on working units (FF+TP) and the actual FF errors. The 10% error rate scenario would be a slight improvement, reducing the number of errors in the bottom 25% of operators. For example, under the 10% scenario, an operator who tested 75 working units would have 8 false failure errors (10% * 75 total tests on working units). After doing this calculation for all operators, we can compare the number of false failure errors under a given scenario and the number of false failure errors which actually occurred. This can be translated into the number of additional tests per month and therefore a percent increase in monthly capacity. A summary of the results under each scenario are presented in Table 8. In an optimistic scenario where all operators were brought in-line with the highest-performing operators, capacity would increase by 2.9% per month.
Table 8 - Extra capacity under error rate scenarios
Error Rate Scenario Monthly Capacity Increase
3% 2.9%
5% 1.7%
7% 0.9%
51
4.3.1 Context of Operator Variation
The 3PL is operating in a competitive labor market with very low unemployment rates that decreased in 2019 to 4.5%. The 3PL experienced an average turnover rate of around 30-35% per quarter in 2018. Each quarter, the number one reason for involuntary turnover, or termination, was attendance and punctuality. In fact, absenteeism was such a major issue that the 3PL had a policy to overstaff because they expected a certain percentage of associates to not show up.
The turnover situation has many effects, but one of the biggest is the way it influences decisions to invest in training. When line leads know that associates will likely leave within a few months, it is hard for them to justify investing in people, whether that is cross-training or time spent giving constructive feedback. This in turn creates operator variation, as operators do not get as much training as they may need.
Other costs of turnover include recruiting and talent acquisition, mistakes made by new operators, and the overall morale on the floor. This fits with the definition of a vicious cycle that Ton presents, discussed in section 2.4. According to the Good Jobs Institute, when a company is operating in this type of environment, it can be “hard or impossible to drive improvement through their employees” [26]. The Good Jobs Strategy makes the case that improving employee’s jobs will also result in operational effectiveness (less variation in this case) and higher employee productivity.
52
4.4 Resulting Process Variation
In a continuous flow process, one step produces an item and immediately passes it on to the next step [29]. Each step should have a similar production rate and ideally queues before each step would be minimal and relatively constant.
As a result of the variation in in-feed quality, quantity, timing, and operator throughput rates, the resulting clean and screen process is not continuous flow. Figure 14 shows the variation in hourly throughput rates over one week for several key operations.
H ou rl y T hr ou gh pu t R at e H ou rl y T hr ou gh pu t R at e H ou rl y T hr ou gh pu t R at e H ou rl y T hr ou gh pu t R at e
53 Hourly throughput rates vary between hours, shifts, days, and operations. As expected with such drastically differing throughput rates across the line, queue lengths also vary. Figure 15 shows two examples of queue lengths over time at wipe-down and FVT respectively.
Queue length data was obtained by analyzing the event log and counting the routers in queues before each step once an hour. The data is summarized in Table 9 for major operations. It is important to note that the initial inspection queue never drops below the number of routers in one full pallet. From this, we can assume there was always sufficient in-feed during this week. This is a key assumption because insufficient in-feed is one source of variation in the system. By analyzinga time period with enough in-feed, we can isolate the other sources of variation.
Table 9 - Queue lengths of various operations
Queue Length (Units)
Operation Name Mean Median SD Min Max
Initial Inspection 1,070.90 1053 365.86 184 1615 FVU 166.41 140 100.14 28 554 FVT 66.21 66 41.39 5 201 Wipe-down 75.92 66.5 54.24 2 216 ACI 18.28 10 16.54 1 70 Refurbish 77.32 56 59.61 1 176 Packout 53.87 23 61.75 8 255
![Table 1- Steps in Reverse Logistics [11]](https://thumb-eu.123doks.com/thumbv2/123doknet/14538881.535170/19.918.108.804.231.548/table-steps-in-reverse-logistics.webp)
![Figure 1- Reverse Logistics Process Diagram [12]](https://thumb-eu.123doks.com/thumbv2/123doknet/14538881.535170/20.918.243.706.114.433/figure-reverse-logistics-process-diagram.webp)
![Table 2 - Comparison of Forward Logistics and Reverse Logistics [14]](https://thumb-eu.123doks.com/thumbv2/123doknet/14538881.535170/21.918.113.805.133.589/table-comparison-forward-logistics-reverse-logistics.webp)
![Figure 2- Diagram of Process Mining [16]](https://thumb-eu.123doks.com/thumbv2/123doknet/14538881.535170/23.918.279.634.252.522/figure-diagram-of-process-mining.webp)
![Figure 3 - Tree Structure of Event Log [18]](https://thumb-eu.123doks.com/thumbv2/123doknet/14538881.535170/24.918.219.690.111.719/figure-tree-structure-event-log.webp)
![Table 3- Sample Event Log [19]](https://thumb-eu.123doks.com/thumbv2/123doknet/14538881.535170/25.918.140.782.314.545/table-sample-event-log.webp)
![Figure 5 - Elements of supplier philosophy that Toyota looks for [22]](https://thumb-eu.123doks.com/thumbv2/123doknet/14538881.535170/28.918.113.808.113.471/figure-elements-supplier-philosophy-toyota-looks.webp)
![Figure 6- Vicious cycle of bad jobs [26]](https://thumb-eu.123doks.com/thumbv2/123doknet/14538881.535170/29.918.272.646.733.962/figure-vicious-cycle-bad-jobs.webp)